CHAPTER III
METHOD OF THE STUDY
This part discusses the type of the study, design of the study, Variable of the study, population and sample, instrumentation, data collecting procedure, and data analysis procedure.
A. Type of the Study
The researcher used quantitative approach in this study. It was because the researcher investigated the effect of corrective feedback on students’ speaking
score. The type of this study is quasi-experimental design. Quasi-experimental designs are similar to randomized experimental designs in that they involve manipulation of an independent variable but differ in that subjects are not randomly assigned to treatment groups. Because the the researcher does not provide full control. It is extremely important that researchers be aware of the threats to both internal and external validity and consider these factors in their interpretation.1
B. Design of the Study
The design of the study was quasi-experimental design. Experimental design is a plan for an experiment that specifies what independent variables will be applied, the number of levels of each, how subject are assigned to groups, and the dependent variable. The researcher used quasi- experimental design since it was not possible to randomly assign subjects to treatment group.2
1
Donald Ary, et al., Introduction to Research..., p.316. 2Ibid.
p. 316.
There were three goups. in this stuy. The first group was control group (CP) using conventional treatment. The second was experiment group (EG) group which was applied self-correct method and the third was experiment group (EG) which was applied self-repair method. The groups were given pre-test and post-test to measure the result of the students’ speaking score.
The description of the experiment is in the following table: Table 3.1. The Description of the Experiment
Group Type of
a. Corrective feedback of self-correct b. Corrective feedback of self-repair 2. Dependent variable
a. The students’ speaking score. D. Population and Sample
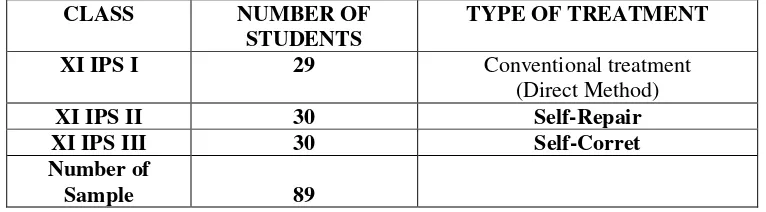
number of the population was 119 students. There were four classes of eleventh grade. They were class XI IPS I ( 29 students ), class XI IPS II ( 30 students ), class IPS III ( 30 students ) and class IPA ( 30 students). The researcher took students of three classes as the sample of the study. They were class XI IPS I, class XI IPS II, class X IPS III. It was because the English teacher at SMA Negeri 1 Katingan Tengah wanted it and the the researcher did not have full control to group the students at the school. Therefore, it was called by quasi experimental design.
Table 3.2. The description of the population and sample
CLASS NUMBER OF
STUDENTS
TYPE OF TREATMENT
XI IPS I 29 Conventional treatment
(Direct Method)
XI IPS II 30 Self-Repair
XI IPS III 30 Self-Corret
Number of
Sample 89
The researcher took the classes as the sample for some reasons. First, the syllabus showed that the material was given in class XI. Second, the students are difficult to speak. Third, the researcher wanted to know the effect of corrective feedback on students’ speaking score.
E. Instrumentation 1. Test Type
The types of the test used to collect the data was in the form of oral test. The students were assigned to choose one topic of their past experiences that interest them. They were given 3-5 minutes to present the chosen topic.
The test construction is based on the objectives of the study. The study is to find out the effect of teacher’s corrective feedback self-repair and self- correct during oral interaction on speaking score. To investigate it, the students were asked to retell their experiences in the past.
To gain the appropriate speaking test for the aim of this study, the researcher did some steps:
a. Planning the Speaking test
To produce a good speaking test, the researcher made plan on the test construction. In this sense, the objective of the test was determined. Then, the researcher decidesd the appropriate type of test. The test type and test objectives were very close. The test objective cannot be achieved without having appropriate test type. Then, the researcher cared for the adequacy of the content. The test content should match with test types and objectives.3
b. Preparing the Speaking Test
The Speaking test was used to elicit the data covering direction and instructions of what the subjects have to do. To make the instruction clear and understood by the students, the instructions must be simple. The instruction was accompanied with several alternative topics. The topics were familiar to the students and it can be developed.
To construct the directions, the researcher took into account the guidelines as follow: (1).The question should be clear, (2). The question should be brief, (3).The question should be definite, (4). The question should be able to be
developed by all of the students to measure their speaking score. (5). The vocabulary used and the concepts expressed in the topic should not be too difficult for ordinary students to understand immediately, (7). The instructions were designed to measure the students’ speaking score.
3. Validity
This section attempts to summarize much of what is contained in chapter one. Briefly, the validity of a test is the extent to which it measures what it is supposed to measure and nothing else.
a. Face Validity
The type of face validity, if the test looks right to other testers, teacher, indicators and test. The type of the test which used in this study can be suitable to the others at the same level in Senior High school. The validity of the test items below:
a.1. The test used oral test. In this case, the students were assigned to speak. a.2. The evaluation was based on scoring system.
a.3. The Language of test used English.
a.4. The test was suitable to eleventh grade students at SMA Negeri 1 Katingan Tengah.
In this case, the test was designed for students to retell a topic which they choose from the general topic given by the researcher. The students had 3-5 minutes to retell the chosen topic orally.
This kind of validity depends on a careful analysis of the language being tested and of the particular course objective. The test should be so constructed as to contain a representative sample of the course, the relationship between the test and the course objective always being apparent.4 In the present study, the test was about recount form in order to measure the students’ speaking
score on speaking. English speaking is a skill which should be mastered by eleventh grade students at SMA Negeri 1 Katingan Tengah on EFL context. The course objective belows:
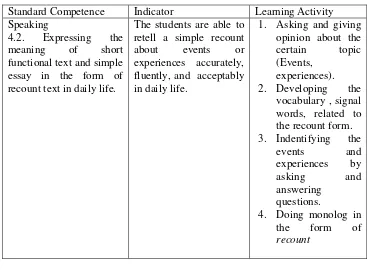
Table 3.3. The Course Objective of English Speaking
Standard Competence Indicator Learning Activity Speaking
Construct validity is a type of validity which assumes the existence if certain learning theories or constructs underlying the acquisition of abilities and skills.5
4. Reliability
Researcher conducted try-out to know the reliability of the test. Reliability is necessary characteristic of any good test for it be valid at all, a test must first be reliable as a measuring instrument. If the test is ad ministated to the same candidates on different occasion (with no language practice work taking place between these occasions), then, to the extent that it produces different results, it is not reliable.6
In this case, the two raters were employed to score the students’
speaking score. The two raters were the researcher and the English teacher who had lot of experience in teaching English language in senior high school. One important thing in using the inter rater method in rating process was focused with the training of the raters. It could maximize the score of the speaking assessment. It made the raters be consistent in scoring and avoided subjectivity of the raters in scoring. For this purpose, the training was done to get inter rater agreement in order to give reliable scores to students’ speaking product.
4.1.Rater Reliability
5Ibid
, P. 231 6
Reliability refers to the consistency with which a test measured whatever it measured.7 In the present study, reliability of the speaking test mainly focused on the rater reliability since the score were obtained from the judgment of two different raters. Here, the consistency in rating score was very important in measuring the students’ speaking skill. The consistency can be achieved through rater training.
In rater reliability, there are inter rater and intra rater. In this study, the researcher used inter rater reliability. Inter rater reliability indicates score in compositions of different raters. In addition, there are some procedures to measure an estimate of test reliability: test retest, parallel, split half, Kuder-Richardson (K-R 20 and K-R 21), and rater reliability. To achieve the acceptable score of inter rater reliability, the rater was trained. First, the researcher explained the purpose of the test and intendeded uses of the test results to the rater. Then, each point of the criteria used to score was explained.
After, the rater got same understanding of criteria, the researcher gived the rater two composition sample to be rated. The score of two raters from the researcher and the rater are correlated to examine whether the scores belong to acceptable scores or not. To obtain inter- rater reliability, the score of two raters were correlated using Intra-class Correlation Coefficient (ICC). Then, the researcher got the interpretation of coefficient correlation, whether they belong to high, moderate, or positive weak/ negative inter rater reliability category. The obtained coefficient should indicate that the students’ speaking products both
7
using corrective feedback and without using corrective feedback have achieved the acceptable level of reliability. In this case, the researcher applyed the coefficient correlation and the interpretation of inter-rater reliability proposed by Winkle et al as shown in table 3.2.8
Table 3.4. Inter Rater Coefficient Correlation and Interpretation Correlation Coefficient Interpretation
.90 to 1.00 or -.90 to -1.00 Very high positive or negative correlation .70 to .89 or -.70- to -.89 High positive or negative correlation .50 to .69 or -.50 to -.69 Moderate positive or negative correlation .30 to .49 or -.30 to -.49 Low positive or negative correlation .00 to .29 or -.00 to -.29 Little if any correlation
To measure the reliability,the Reliability Analysis with Formula of Intra-class Correlation Coefficient using SPSS 17.0 Program.
The results of the calculation showed that the calculation of the ICC
Interval F Test with True Value 0 Lower Two-way mixed effects model where people effects are random and measures effects are fixed.
a. Type C intraclass correlation coefficients using a consistency definition-the between-measure variance is excluded from the denominator variance.
b. The estimator is the same, whether the interaction effect is present or not.
showed the reliability between the raters was 0.80. It indicated High positive reliability.
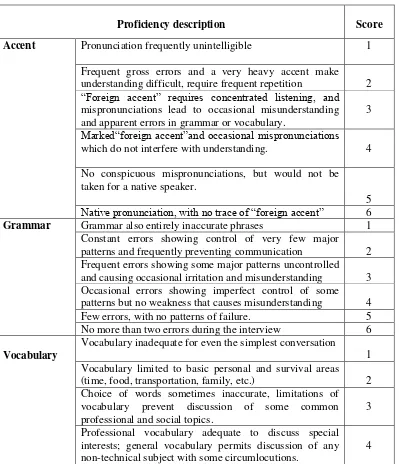
5. Scoring Method
In the present study, the researcher used analytic scoring method. The scoring method can be seem in the table below:
Table 3.6. Scoring Method
Proficiency description Score
Accent Pronunciation frequently unintelligible 1
Frequent gross errors and a very heavy accent make understanding difficult, require frequent repetition 2
“Foreign accent” requires concentrated listening, and
mispronunciations lead to occasional misunderstanding and apparent errors in grammar or vocabulary.
3
Marked“foreign accent”and occasional mispronunciations
which do not interfere with understanding. 4
No conspicuous mispronunciations, but would not be taken for a native speaker.
5
Native pronunciation, with no trace of “foreign accent” 6 Grammar Grammar also entirely inaccurate phrases 1
Constant errors showing control of very few major patterns and frequently preventing communication 2 Frequent errors showing some major patterns uncontrolled and causing occasional irritation and misunderstanding 3 Occasional errors showing imperfect control of some patterns but no weakness that causes misunderstanding 4 Few errors, with no patterns of failure. 5 No more than two errors during the interview 6
Vocabulary
Vocabulary inadequate for even the simplest conversation 1 Vocabulary limited to basic personal and survival areas (time, food, transportation, family, etc.) 2 Choice of words sometimes inaccurate, limitations of vocabulary prevent discussion of some common professional and social topics.
3
Professional vocabulary adequate to discuss special interests; general vocabulary permits discussion of any non-technical subject with some circumlocutions.
Professional vocabulary broad and precise; general vocabulary adequate to cope with complex practical problems and varied social situations. 5 Vocabulary apparently as accurate and extensive as that of an educated native speaker. 6
The way of calculating final Score:
Score : Total score (accent, grammar, vocabulary) x 100% Total maximum score (18)9
F. Data Collecting Procedures
To answer the research questions of the effect of teacher’s corrective
feedback self-repair and self- correct during oral interaction on speaking score, the researcher conducted the following steps:
1. Grouping the students into experimental group and control group. 2. Giving pre-test to the experimental group and control group.
3. Teaching English speaking to students in the experimental group by implementing the corrective feedback and teach English speaking to students in the control group by using conventional treatment (direct method).
4. Giving pos-test to the experimental group and control group. 5. Taking the result of the test.
To get the accurate data in the present study, the researcher selected the appropriate instruments to the problem statement, they were:
1. Test
9
A test is a set of stimuli presented to an individual in order to elicit responses on the basis of which a numerical score can be assigned. This score, based on a representative sample of the individual’s behavior, is an indicator of the extent to which the subject has the characteristic being measured.10 In the present study, the method was used to get data about score of the pre-test and post-test that was given to the three groups. The test in this study was oral test or subjective test. In the test of speaking, the students were given a free chance to think as much as possible. They can freely express and organize their ideas in oral form.
a. Pre- test
The researcher gave pre-test to the experiment class and the control class before giving the treatment.
b. Post- test
Post-test was given to the experiment class and the control class after receiving treatment. It was purposed was to know the improvement of students’
speaking score. 2. Documentation
In the present study, documentation was used in order to find the information needed in this research. This technique of collecting data was done by seeing the documentation to get the real information of the experiment like; a. The students’ name, b. The syllabus of English subject, c. The result of the test, d. pictures of the students of the experiment.
10
G. Data Analysis Procedures
Before analyzing the data using ANOVA, there were two kinds of requirements which should be measured; normality and homogeneity.
a. Normality Test
It was used to know the normality of the data that was going to be analyzed whether both groups had normal distribution or not. In this study, researcher used One-Sample Kolmogorov-Smirnov Test to test the normality. SPSS 17.0 was used to know the normality of the test.
b. Homogeneity Test
Homogeneity test is used to know whether experimental group and control group, that are decided, come from population that has relatively same variant or not. The formula is:11
F = Notice:
F : Frequence
The hypotheses in homogeneity:
Fvalue ≤ Ftable, means both of variants are homogeneity.
Fvalue > Ftable, both of variants are homogeneity.
If calculation result of F is lower than F table by 5% degree of significance so Ho is accepted, it means both groups have same variant. In
11Ibid,
addition, the SPSS program will be applied.
Pengambilan keputusan dalam uji homogenitas dalam SPSS:
1. Jika nilai Signifikansi atau nilai probabilitas < 0,05, maka dikatakan bahwa
varian dari dua atau lebih kelompok populasi data adalah tidak sama.
2. Jika nilai Signifikansi atau nilai probabilitas > 0,05, maka dikatakan bahwa
varian dari dua atau lebih kelompok populasi data adalah sama.12
It means, to analyze the result of homogeneity test on SPSS program:
1. If the Significant value is lower than 0,05, so the data population among two or more groups is different.
2. If the Significant value is higher than 0,05, so the data population among two or more groups is not different.
The data of this study were the students’ speaking scores. The data were in form of quantitative data. The data were analyzed by means of inferential statistics.
The researcher analyzed the data by applying some procedures in the following:
1. Collecting the data of the students’ speaking scores of pre test and post test. 2. Arranging the obtained score into the distribution of frequency of score table. 3. To answer the research problems, the researcher applied the one way ANOVA
statistical calculation. The formula:
12
∑ ∑
Where
SSt = sum of squares total
ΣX2 = each score squared, then summed
( Σ Xt )2= all the scores summed first, then this sum squared
N = number of scores
Next, find the part of the total sum of squares that is due to the deviations of the group means from the grand mean. This index is called the “sum
of the squares between groups.” (To be grammatically correct, we should say “the
sum of squares among groups” when more than two groups are involved. However, it is a long-standing tradition to use the term “sum of squares between groups,” and to be consistent with other texts we are retaining this usage here.)
This index is found by applying the formula:
∑ ∑ ∑ ∑
Then, find the part of the total sum of squares that is caused by the deviations of each individual score from its own group mean. This index, called the “sum of the squares within groups,” is found by applying the raw score formula for the sum of squared deviations to each group and then summing across groups (SSw = SS1 + SS2 + . . . ).
∑
(∑
∑
) (∑
∑
)
A shortcut to find the sum of the squares within groups is to subtract the sum of squares between groups from the total sum of the squares, expressed as follows:
SSw = SSt - SSb
The sum of squares between groups is a systematic variation, possibly due to effects of treatment. the sum of squares within groups is associated with spread within groups (error varience).13
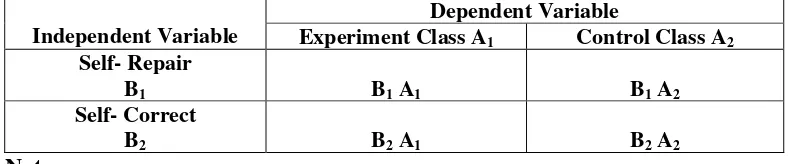
Table 3.7. The ANOVA Table of the Research
Independent Variable
Dependent Variable
Experiment Class A1 Control Class A2 Self- Repair
B1 B1 A1 B1 A2
Self- Correct
B2 B2 A1 B2 A2
Note:
B1 A1 = Experiment group using Self- Repair
B2 A2 = Control group using Self-Repair
B2 A1 = Experiment group using Self-Correct
B2 A2 = Control group using Self-Correct
In addition, the statistical technique analysis of the data used SPSS 17. The SPSS (Statistical Package for the Social Sciences) is used as a statistical analytical instrument. ANOVA Analysis is used to make the analysis of variance
13
for quantitative dependent variable caused the existence single factor independent variable.14
4. Interpreting the result the finding. Previously, the researcher accounted the degrees of freedom (df) with the formula:
df = (N1+N2-2) Where :
df : degrees of freedom
N1 : Number of subject group 1 N2 : Number of subject group 2 2 : Number of variable
5. Making discussion to clarify the research finding. 6. Concluding the result of the interpretation.
14