Int. J. Ani. Fish. Sci. 5(5): 464-469, December 2012, website: www.gurpukur.com or www.gscience.net
SUBSTITUTION OF FISH MEAL BY MEAT AND BONE MEAL FOR THE PREPARATION OF TILAPIA FRY FEED
M. T. HASAN1. S. M. I. KHALIL2, M. A. KASHEM3, S. HASHEM4 and S. K. MAZUMDER5
ABSTRACT
The study was conducted at the Agro-3, Fish hatchery and Culture farm situated at Boilor under Trishal upazila under Mymensingh district of Bangladesh during April to May 2012. The collected samples were analyzed at the Laboratory of Fish Nutrition, Faculty of Fisheries, Bangladesh Agricultural University, Mymensingh, Bangladesh. A 28 days feeding experiment was conducted to evaluate the effect of the substitution of fish meal by meat and bone meal in the tilapia (Oreochromis niloticus) fry feed. Four experimental diets viz, diet-1 (Fish meal: Rice bran: Wheat flour = 61.51% : 19.75% : 19.75%), diet-2 (Fish meal: Meat and bone meal: Rice bran: Wheat flour = 30.255% : 36.62% : 16.57% : 16.57%), diet-3 (Fish meal: Meat and bone meal: Rice bran: Wheat flour = 15.12% : 54.94% : 14.97% : 14.97%) and diet-4 (Meat and bone meal: Rice bran: Wheat flour = 73.23% : 13.39% : 13.39%) respectively were used for the experiment. The experimental diets were randomly distributed to twelve hapas and each with three replicates. Three days aged fry (0.012g) were stocked at the rate of 105fry/m2 in hapa. Fish were fed
experimental diets up to their satiation level five times in a day. The results of the study showed that the weight gain of the fish fed with diet-1(Control) was significantly (p>0.05) higher than fish fed with other experimental diets. The FCR values of different diets ranged from 1.03 to 1.24 and the lowest FCR was exhibited by the diet-2. Significantly higher apparent net protein utilization (ANPU) value was also exhibited by the treatment feeding with diet-2. The feed cost varies from 36.34 to 48.26 Taka/kg but according to different feeds diet-1 and diet -2 produce the more or less same result but diet-2 having less cost about 6.33Taka∗/kg than the control diet. There was no significant difference among the final carcass moisture, lipid, protein and ash content of fish fed with different experimental diets. The results of the study indicated that fish meal containing diet-1 can be substituted by diet-2. With the 50% substitution of fish meal by meat and bone meal exerted no adverse effects on growth and survival rate of tilapia (O.
niloticus) fry and it also makes cost effective for fry production.
Keywords: Oreochromis niloticus, FCR, ANPU and Proximate composition.
INTRODUCTION
Tilapia fish has become one of the most commercially important groups of cultured freshwater fish and have been dubbed as the “Aquatic chicken” (Maclean, 1984). Tilapia has also been described as the important aquaculture species of the 21st century (Fitzsimmons, 2000) and Tilapia is an excellent fish for growing in the shallow and seasonal ponds in a country like Bangladesh (Hussain et al., 1989; Gupta et al., 1994). For good growth and survival rate of the tilapia seeds in nursery needs good quality feeds of appropriate protein content. (Rukhsana, 2011) reported that tilapia (O. niloticus) fry grows well at 36% protein. For the purpose of commercial production of good quality tilapia seeds must be concerned about the main protein source of the feed as well as the cost of feed. In aquaculture, diet is often the single largest operating cost item and can represent over 50% of the operating costs in intensive aquaculture (El-Sayed, 1999). Protein is the most expensive macro-nutrient in fish feeds. However, use of fishmeal as the only protein source for fish feed makes the feed expensive. One way of reducing feed cost is to substitute the fish meal with other animal and plant protein sources of indigenous origin (Hossain and Paul, 2007). The product rendered such as meat and bone meal which generally contain 43 to 58% crude protein and good sources of indispensable amino acids. The price of meat and bone meal are comparatively cheap than that of fish meal (Habib et al., 2001). If the high cost protein source can be substituted by meat and bone meal the production cost will be lowered and the hatchery owners and fish farmers will be benefited. The present experiment was planned to substitute
1Department of Aquaculture, 2Department of Fish Health Management, 3Department of Fisheries Technology and Quality
Control, 5Department of Aquatic Resource Management, Sylhet Agricultural University, Syleht-3100 and 4Department of
Aquaculture, Bangladesh Agricultural University, Mymensinh-2202, Bangladesh.
465
fish meal by a graded levels of meat and bone meal to see how the fish meal is substituted for the production of tilapia (O. niloticus) fry in the farm condition. The present study was undertaken with the objectives are to recommend the maximum substitution level of fish meal by meat and bone meal and to determine the economic viability of using meat and bone meal as substitute of fish meal for rearing of tilapia (O. niloticus) fry.
MATERIALS AND METHODS
In this experiment, Agro-3, Fish hatchery and Culture farm situated at Boilor under Trishal upazila under Mymensingh district of Bangladesh during April to May 2012 to produce 3 days old larvae were used. After yolk sac absorption feeding will be started with a fixed protein content (36%) diet (4 different feed prepared by using different ingredients) mixed with 17α-methyl testosterone. Then the fry were stocked in the experimental hapa having average weight of 0.012g.
Construction and setting of synthetic hapa:Synthetic hapa was made with nylon net of 1 m3 size. The study was conducted in 105 fry/ m2 nylon net hapa with a mesh size of 1mm. The hapas were arranged on two columns (6 hapas per columns) and were tightly fixed to bamboo poles that were set longitudinally as well as vertically. The water depth of experimental synthetic hapa was 0.62m.
Experimental design:The experiment was designed into four experimental groups (Diet 1, diet 2, diet 3 and diet 4) each having three replications. Three days old fry of initial average length 0.8 cm and weight 0.012g were released at same stocking density (105fry/m²). Fries were acclimatized with the experimental pond water in plastic bowl and then stocked in hapa on 21st April 2012.
Feed preparation and formulation:All the dietary ingredients were collected from local market. Then the required amount of dietary ingredients were measured and mixed to form four experimental feeds with the substitution of fish meal by the graded level (50, 75 and 100) of meat and bone meal.
Analytical method:
Moisture (%) = Original sample weight – Dried sample weight x 100 Original sample weight
% of Nitrogen = Milliequiv alent of nitrogen (0.014) x titrant value (ml) x strength of HCL Sample weight (g)
Nitrogen free extract(NFE) = 100 - % (Moisture + Crude protein + Crude lipid + Ash + Crude fibre)
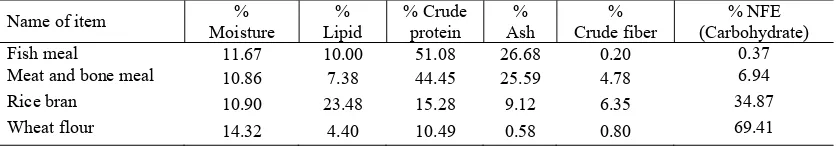
Table 1. Proximate composition of the ingredients.
Table 2. Formulation of experimental diets.
Diets Description of diet Protein content %
(Formulated value) Diet-1
(Control)
Fish meal : Rice bran : Wheat flour = 61.51% : 19.75% :
19.75% 30.909+3.108+2.072=36
Diet-2 Fish meal: Meat and bone meal : Rice bran : Wheat flour = 30.255% : 36.62% : 16.57% : 16.57% 15.45+16.28+2.53+1.74=36
Diet-3 Fish meal: Meat and bone meal : Rice bran : Wheat flour = 15.12% : 54.94% : 14.97% : 14.97% 7.72+24.42+2.29+1.57=36
Diet-4 Meat and bone meal : Rice bran : Wheat flour = 73.23% :
13.39% : 13.39% 32.55+2.05+1.40=36
Table 3. Proximate composition of different artificial diets.
Name of item % Moisture % Lipid % Crude protein % Ash % Crude fiber % Carbohydrate
Diet-1(Control) 12.45 11.96 35.87 14.50 4.40 20.91
Diet-2 10.86 12.45 35.73 12.80 4.25 23.91
Diet-3 12.96 13.48 36.62 14.56 4.08 18.30
Diet-4 12.65 12.50 35.62 13.88 4.35 21.00
Method of feeding:The fry of treatments (diet 1, diet 2, diet 3 and diet 4) were fed five times in every 4 hours interval in a day and feeding is being off at 2 am. Feeds were supplied to fry at the satiation level with 30, 25, 20 and 15% of body weight in the first to fourth week in experimental period.
Economic analysis: An economic analysis was performed to estimate the cost of experimental diet (Tk/kg). The costs per kg diet are presented in the table 4.
Table 4. Cost of experimental diets (Taka/kg).
Ingredients Diet-1 Diet-2 Diet-3 Diet-4
Fish meal 39.98 19.63 9.82 -
Meat and bone meal - 15.37 23.06 30.75
Rice bran 2.76 2.31 2.09 1.87
Wheat flour 5.52 4.62 4.17 3.72
Total cost /kg diet 48.26 41.93 39.14 36.34
Statistical analysis of data: The feeding experiment was designed on the basis of Completely randomized design (CRD).The collected data were statistically analyzed by one way Analysis of variance (ANOVA) with the help of SPSS (Statistical package for social sciences) to see whether the influence of different treatments on these parameters were significant or not. The means of the different parameters were compared by Duncan’s new multiple range test (DMRT) at 5% and 1% probability level. Standard error (±SE) of treatment means was also calculated ...
RESULTS AND DISCUSSION
Growth parameter
Growth of fry in length (cm) and weight (g) was measured every 7 days interval. The following parameters were used to evaluate fry growth:
I. Length gain (cm) = Mean final length – Mean initial length II. Weight gain (g) = Mean final weight - Mean initial weight
III. % of Length gain = Mean final length – Mean initial length x 100 Mean initial length
IV. % of Length gain = Mean final weight – Mean initial weight
467
Table 5. Mean (±SE) weight increment (g) of tilapia (O. niloticus) fry by feeding different experimental diets during the experimental period.
Sampling date Average weight (g)
Diet-1 (control) Diet-2 Diet-3 Diet-4 LSD Level of sig. Initial: 21-04-2012 0.012±0.000 0.012±0.000 0.012±0.000 0.012±0.000 0.000 NS 1st: 28-04-2012 0.077a±0.001 0.054b±0.001 0.057b±0.002 0.046c±0.002 0.011 ** 2nd
: 04-05-2012 0.23a±0.012 0.25a±0.006 0.19b±0.006 0.18b±0.017 0.015 ** 3rd: 11-05-2012 0.41±0.012 0.45±0.029 0.43±0.006 0.45±0.012 0.034 NS Final: 18-05-2012 0.80a±0.058 0.77a±0.012 0.72ab±0.012 0.66b±0.023 0.060 *
* = Significant at 5% level of probability, ** = Significant at 1% level of probability and NS = Not significant. In a row figures with same letter or without letter do not differ significantly whereas figures with dissimilar letter differ significantly (as per DMRT).
Growth in weight
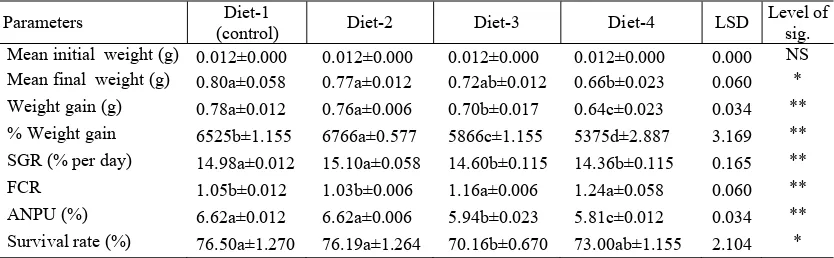
The initial average weight of fry was 0.012g in all different diets. In the study period, the mean final weight of tilapia (O. niloticus) fry obtained were 0.80a±0.058g in diet-1, 0.77a±0.012g in diet-2, 0.72ab±0.012g in diet-3 and 0.66b±0.023g in diet-4 (Table 5) respectively. The maximum and minimum final weights were 0.80a±0.058g and 0.66b±0.023g in the diet-1 and diet-4 respectively. The weights of fry by the effect of different experimental diets were significant (p>0.05).
Table 6. Growth parameters and feed utilization of tilapia (Oreochromis niloticus) fry under different treatments during the experimental period. % Weight gain 6525b±1.155 6766a±0.577 5866c±1.155 5375d±2.887 3.169 ** SGR (% per day) 14.98a±0.012 15.10a±0.058 14.60b±0.115 14.36b±0.115 0.165 ** FCR 1.05b±0.012 1.03b±0.006 1.16a±0.006 1.24a±0.058 0.060 ** ANPU (%) 6.62a±0.012 6.62a±0.006 5.94b±0.023 5.81c±0.012 0.034 ** Survival rate (%) 76.50a±1.270 76.19a±1.264 70.16b±0.670 73.00ab±1.155 2.104 *
* = Significant at 5% level of probability, ** = Significant at 1% level of probability, NS = Not significant and in a row figures with same letter or without letter do not differ significantly whereas figures with dissimilar letter differ significantly (as per DMRT).
Specific growth rate (%/day)
Food conversion ratio
The mean food conversion ratio (FCR) of different experimental treatments ranged from 1.03 to 1.24 (Table 6). The food conversion ratio of different diets differ significantly (p>0.01) and the lowest FCR (1.03) was found in diet-2 while the highest (1.24) was obtained in diet-4.
Apparent net protein utilization (ANPU %)
The apparent net protein utilization (ANPU%) values in different diets ranged from 5.81% to 6.62% (Table 6).The ANPU value of diet-1 and ditet-4 (6.62%) was significantly (p>0.01) highest than other two diets and ANPU value in diet-4 was the lowest. Value of (ANPU %) for diet-1 (6.62%) and diet-3 (5.81%) differ significantly (p>0.01).
Survival rate (%)
After rearing a period of 28 days, the average survival rate of tilapia (Oreochromis niloticus) fry in the diets- (1, 2, 3 and 4) were 76.50%, 76.19% 70.16% and 73.00% respectively (Table 6). The survival rate of tilapia (O. niloticus) fry under diet-1 was significantly (p>0.05) higher when compared diet-2 and diet-3. However, the lower survival rate (%) was obtained in diet-3 (70.16%).
Proximate carcass composition of experimental fish
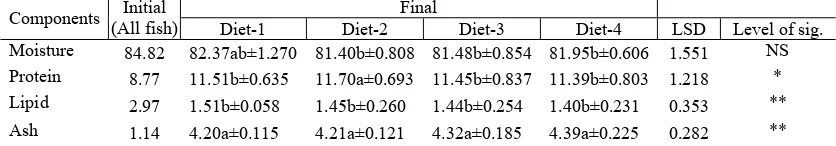
The proximate carcass composition (% fresh matter basis) of fish at the start and end of experiment varied with the effect of different diets was presented in table 7. The final carcass composition for moisture, protein, lipid and ash content of fry do not differ significantly.
Table 7. The initial and final carcass composition of the fish sample at the start and end of the experiment (% fresh matter basis).
Components (All fish)Initial Diet-1 Diet-2 Final Diet-3 Diet-4 LSD Level of sig. Moisture 84.82 82.37ab±1.270 81.40b±0.808 81.48b±0.854 81.95b±0.606 1.551 NS Protein 8.77 11.51b±0.635 11.70a±0.693 11.45b±0.837 11.39b±0.803 1.218 * Lipid 2.97 1.51b±0.058 1.45b±0.260 1.44b±0.254 1.40b±0.231 0.353 ** Ash 1.14 4.20a±0.115 4.21a±0.121 4.32a±0.185 4.39a±0.225 0.282 **
* = Significant at 5% level of probability, ** = Significant at 1% level of probability, NS = Not significant and in a row figures with same letter or without letter do not differ significantly whereas figures with dissimilar letter differ significantly (as per DMRT).
Economic analyses
The cost of experimental diets was based on price of ingredients in the Mymensingh market in 2012. The cost (Tk./kg) of experimental diets were calculated Tk. 48.26, 41.93, 39.14 and 36.34 for diet-1 (Fish meal: Rice bran: Wheat flour = 61.51% : 19.75% : 19.75%), diet-2 (Fish meal: Meat and bone meal: Rice bran: Wheat flour = 30.255% : 36.62% : 16.57% : 16.57%), diet-3 (Fish meal: Meat and bone meal: Rice bran: Wheat flour = 15.12% : 54.94% : 14.97% : 14.97%) and diet-4 (Meat and bone meal: Rice bran: Wheat flour = 73.23% : 13.39% : 13.39%) respectively.Per kg cost of four experimental diets is shown in (Table 4). In term of cost of the feed the control diet-1 was found to be the most expensive (Tk. 48.26) and diet-4 (Tk. 36.34) is the cheapest one among the diets. Meat and bone meal based diets were found to be cheaper than diet-1 (control) and also others those composed of fish meal.
469 REFERENCES
El-Sayed, A. M. 1999. Alternative protein sources for farmed tilapia, Oreochromis spp. Aquacult, 179: 149-168 Fitzsimmons, K. 2000. Tilapia: the most important aquaculture species of the 21st century. In: K. Fitzsimmons and
J.C. Filho (Editors), Proceedings of the fifth International Symposium on Tilapia in Aquaculture, Panorama de aquaculture, Rio de Janerio. pp. 3-8.
Gupta, M. V., M. Akteruzzaman, A. H. M. Kohinoor and M. S. Shah. 1994. Nile Tilapia (Oreochromis niloticus) culture under different feeding and fertilization regimes. In: R. S. V. Pullin, J. Lazar, M. Legendre and J. B. Amon Kothias (eds.). The third International Symposium on Tilapia in Aquaculture, ICLARM Conf. Proc. 41.pp. 417-428.
Habib, M. A. B., M. S. Ullah, M. R. Hasan and A. M. Akand. 2001. Use of silkworm pupae as partial replacement of fish meal in the diets with rotifer as feed additive of Asian catfish, Clarias batrachus fry. Bangladesh J. Fish., 24(1-2): 133-141.
Hossain, M. A. and L. Paul. 2007. Low cost diet for Monoculture of Giant Freshwater prawn (Macrobrachium rosenbergii de Man) in Bangaldesh. Aquacult Res., 38: 232-238.
Hussain, M. G., M. A. Rahman, M. Akhteruzzaman and A. H. M. Kohinoor. 1989. Study on the production of Oreochromis niloticus under semi intensive system in Bangladesh. Bangladesh J. Fish., 12(1): 59-65.
Maclean, J. L. 1984. The aquatic chicken. ICLARM Newsletter, 7(1): 19-18.