_______________________________
DESIGNING AND MODELLING COAST MANAGEMENT GIS FOR BOSPHORUS
M. U. Gumusay a, *, O. Ozdemir b, T. Bakirman a
a YTU, Civil Engineering Faculty, 34220 Esenler Istanbul, Turkey - (gumusay, bakirman)@yildiz.edu.tr b Olcum Muhendislik, 48700, Marmaris, Muğla, Turkey - [email protected]
Commission IV, WG IV/5
KEY WORDS: Web Based GIS, Bosphorus, Georeferencing, DTM, Digitizing
ABSTRACT:
Web based geographic information systems (GIS) has great potential based on developments in internet and web technology. Web based GIS is a network based tool that takes advantage of internet with visualizing, analysing and accessing of distributed data and analysis functions. With the length of 30 kilometres, the Bosphorus provides an essential zone that offers great maritime traffic services. This shipping way which connects The Black Sea and The Mediterranean Sea through The Marmara Sea, has no alternative and it is substantial for economies of Black Sea countries. The Bosphorus is one of most important natural straits in the world handling 150 transit ships, 23 freighters with dangerous cargo and 2500 local transport ships with 2 million passengers on daily basis. In this study, it is aimed to create a web based GIS application for an effective coast management which includes berthing factors (anchorage areas, currents, submerged, etc.), maritime traffic factors (traffic separation schemes, traffic flow directions), closed areas and other factors (lighthouses, buoys, beacons, etc.) by digitizing printed navigation charts produced by Turkish Naval Forces, Office of Navigation, Hydrography and Oceanography.
1. INTRODUCTION
Management of the coastal zone is an essential issue due to the growing social, demographic and touristic activities and pressures that threaten its long-term sustainability (Moore et al., 1999). Any developmental activity in the coastal zone requires a clear understanding of the processes controlling coastal stability and persistence (Noujas et al., 2016). In order to practice effective coastal management system, scientists need to understand the way the natural environment and human activities are interconnected to form a system. Key aspects of the system includes four main subjects which are biological (ecosystem, species diversity, etc.), physical (topography, geology, sea levels, etc.), socio-economic (human activities, land use, etc.) and legal (resource use right, law and regulations) (Bartlett and Smith, 2004). The system consists of various topics so it needs a multi-disciplinary approach. Coastal planning and management relied mainly on field observations and historical data. With the rapid development of computers, information and surveying technologies, geographic information systems (GIS) have revolutionized our ability to understand complex data series, interaction of coastal processes and to manage the resources of the coastal zone more effectively (Mayerle et al., 2016). The need for integration and management of all the factors and aspects related to the coastal zone requires GIS to deal with the current tasks (Rodríguez et al., 2009).
The Bosphorus is one of the busiest and narrowest water channels of the world that provides an essential zone offering great maritime traffic services. It is one of the substantial shipping way that connects the countries in the north of Black Sea and the countries of the Mediterranean for centuries, which situated in the middle of an important commerce, industry, transportation and tourism centre around where 15 million people live (Tasligil, 2004).The Bosphorus is one of most
important natural straits in the world handling 150 transit ships, 23 freighters with dangerous cargo and 2500 local transport ships with 2 million passenger on daily basis.
In this study, it aimed to create a Web Based Istanbul Bosphorus GIS with physical and biological components of coast management system to aid military and civil sailors underway, which consists of information about berthing factors (anchorage grounds, depth, sedimentation, currents and submerged etc.), maritime traffic items (traffic separation schemes, traffic flow directions), closed areas, points of interest in sea surface for both sailing and berthing (lighthouse, buoy, beacon) and points of interests in land (radars, elevation points) which were derived by digitizing navigation charts produced by Turkish Naval Forces Office of Navigation, Hydrography and Oceanography.
2. METHODOLOGY
The Bosphorus provides marine traffic service area with the length of 31 kilometres. The width considered as the distance between Anatolia and Rumeli Lighthouse in the north entrance of the strait is 3600 meters. Generally the strait is wider in the northern are and it gets narrower as heading to the south. The narrowest distance in the strait is 698 meters in between Emirgan and Kanlica towns (Tasligil, 2004).
The strait has no alternative for sailing from Black Sea to Mediterranean through Marmara Sea and it is also substantial for economies of Black Sea countries. Additionally and most importantly, the residents may face great danger that may be caused by dense maritime traffic in any second. Thus, it is certain that it must be benefited from web based GIS technologies for Bosphorus which has such a significant location and maritime traffic.
The internet changes the way to access, share and distribute information. In this way, it also changes GIS analysis and visualization methods. Web based GIS tools rapidly develop as internet and web technologies improve. Web based GIS, is a GIS tool that uses the internet to access and execute distributed data, analyses and visualizing functions (Sahin and Gumusay, 2007).
Web based GIS uses client server architecture for GIS analysis. Necessary processes are distributed between client and server. The client requests data and analysis functions from the server. The server completes the request and transmits the response or provides data and analysis functions to the client (Peng, 1999). Web based GIS is an interactive system that provides connection with Internet. Web based GIS is a distributed system that it can access data and applications in other computers in a network using internet connection. This system does not require client to have data or application as they are provided by the server once a request is made. Web based GIS is a dynamic system since data and applications are provided by the server, clients are always dynamically kept up to date with the latest information (Fu and Sun, 2010).
In this study, ArcGIS for Server and ArcGIS Online software have been used to create web services and web based GIS applications. ArcGIS for Server software creates web services that can be accessed by various ArcGIS platforms and third-party clients (Figure 1). ArcGIS Online is an online platform that provides mapping service where end user can create web maps and web applications (Figure 2). Thus, mentioned integrated systems approach creates a user-friendly environment (Law, 2013).
Figure 1. Desktop to web workflow
Figure 2. Creating web map
3. SYSTEM DESIGN AND MODELLING
Base data source used in this study are navigation charts in different scales such as 1:60000, 1:50000, 1:30000 and 1:12500 produced by Turkish Naval Forces Office of Navigation, Hydrography and Oceanography. Maritime traffic separation schemes, flow directions and flow regulations, sea floor sedimentation, lighthouses, buoys, beacons, sea floor depths, rocks and other symbols for navigation are to be found in navigation charts.
3.1 Lighthouses
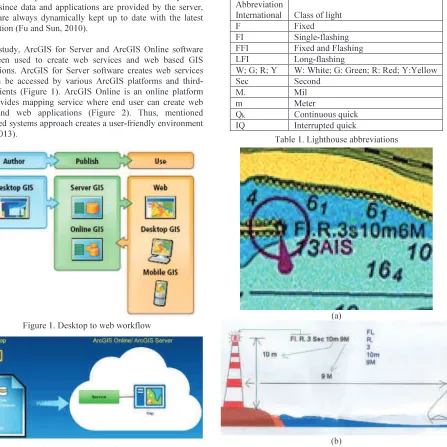
Lighthouses aid sea vehicles to locate position and direction and they can be in different shapes and forms. The abbreviation used for different lighthouses in navigation charts are listed in Table 1 and the symbology of a lighthouse can be viewed in Figure 3.
Abbreviation
International Class of light
F Fixed
FI Single-flashing
FFI Fixed and Flashing
LFI Long-flashing
W; G; R; Y W: White; G: Green; R: Red; Y:Yellow
Sec Second
M. Mil
m Meter
Qk Continuous quick
IQ Interrupted quick
Table 1. Lighthouse abbreviations
(a)
(b)
Figure 3. (a) Lighthouse symbology, (b) Abbreviation (FL = Flashing, R = Red (colour), 3 seconds (interval), 10 meters
(height), 9 meters (range))
3.2 Buoys and Beacons
Buoys and beacons equipment are used to mark a zone (submerged area), aid berthing and sailing. Buoys are usually placed at the entrance of ports and since they are connected to sea floor, their position is fixed. Buoys can be found in different shapes such as minor light floats, mooring buoys and special purpose buoys. Symbology of buoys and beacons can be seen in Figure 4.
Figure 4. Symbology of buoys and beacons
3.3 Rocks, Wrecks, Obstructions
Rocks, wrecks and obstructions which are dangerous for sailors are shown in navigation charts. 4 types of presentation is available for this class (Table 2). There are rocks, wrecks and obstructions in 104 points in Bosphorus.
GIS Symbol Map Symbol Information
Wreck showing any portion of hull or super-structure at level of chart datum Wreck, least depth known by sounding only
The wrecks thus represented are than potentially dangerous to vessels with a draught greater than 20 m
Wreck, least depth unknown, considered to be potentially dangerous to some surface vessels Table 2. Rocks, wrecks and obstructions symbols
3.4 Seabed Sedimentation
Seabed sedimentation information which is essential during anchoring is provided in the maps. Anchoring technique and anchor type depend on the sea floor properties as it would not be safe to anchor in rushes or it would damage biodiversity to anchor in coral area. Table 3 shows types of seabed sedimentation and symbology.
Abb. Abb.
S Sand P Pebbles
M Mud Cb Cobbles
Cy Clay R Rock, Rocky
Si Silt Bo Boulders
St Stones Co Coral
G Gravel M,
Sh
Mud and Shells
Sh Shells Wd Rushes, moss
S/M Ex: Mud, Sand
Table 3. Seabed sedimentation abbreviations and symbology
3.5 Tides and Currents
Tides and currents are shown in restricted areas. 14 tides and current features are collected from Bosphorus navigation charts (Table 4).
GIS Symbol Map Symbol Information
Current in restricted waters
Table 4. Tides and currents symbology
3.6 Tracks and Routes
Maritime traffic separation scheme, traffic flow directions, port entrances and channels are presented in maps where density of maritime traffic is high, using International Maritime Organization’s (IMO) standards (Table 5).
Symbol (GIS System) Map Symbol
Table 5. Tracks and routes symbology. Established (mandatory) direction of traffic flow. Separation line (large-scale, smaller
scale).
3.7 Zones
Anchoring and prohibited military zones, anchoring and training areas are presented in navigation charts.
3.8 Energy Transmission Lines
Power transmission lines, radio station lines, submarine lines and line protection areas are marked on navigation charts.
3.9 Sea Depth
Sea depth points presented in navigation charts can be seen in Table 6. These points are shown as values without any points or markings.
GIS Value Map Symbol Information
-31
-30 Sea Depth Point
Table 6. Sea depth points
3.10Points of Interests in Land
Various of structures in land such as settlements, spot height, chapels, sirens, radar points, radio and TV towers, bridges, transportation lines, hospitals, stadiums etc. are shown in navigation charts.
3.11 Layer and Attribute Design
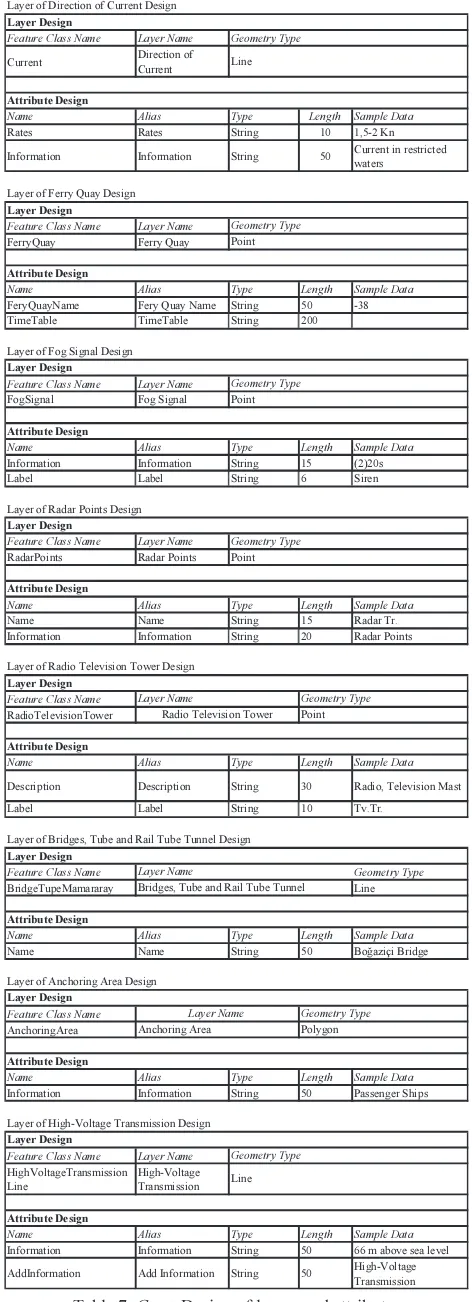
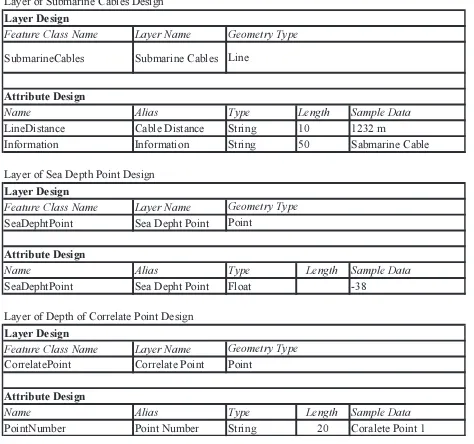
The design of each layers and attributes that are used in the system is given in Table 7.
Feature Class Name Layer Name
Lights Lights
Name Alias Type Length Sample Data
NameOfLight Name of Light String 50 Rumeli Light (Türkeli)
Properties Properties String 25 FI(2)12s58m18M
Label Label String 10 Pilon
Information Information String 50 Horn 20s (Fog light)
Feature Class Name BuoysAndBeacons
Name Alias Type Length Sample Data
BuoyBeacon Buoy/Beacon String 20 Beacons
Information Information String 25 Q(6)+LFI15s,YB,AIS
Feature Class Name RocksWrecksObsruction
Name Alias Type Length Sample Data
Type Type Short Integer 2
Depth Depth Float 38
Information Information Text 115
Feature Class Name Layer Name
NatureOfSeabed Nature of the Seabed
Name Alias Type Length Sample Data
Label Label String 10 Si.S
NatureSeabed Nature of the
Seabed String 35 Silt, Sand
Geometry Type
Layer of Buoys and Beacons Design
Layer of Rocks, Wrecks Obstruction Design
Layer Design
Layer of Nature of the SeabedDesign
Table 7. Design of layers and attributes
Feature Class Name Layer Name
Current Direction of
Current
Name Alias Type Length Sample Data
Rates Rates String 10 1,5-2 Kn
Information Information String 50 Current in restricted waters
Feature Class Name Layer Name
FerryQuay Ferry Quay
Name Alias Type Length Sample Data
FeryQuayName Fery Quay Name String 50 -38
TimeTable TimeTable String 200
Feature Class Name Layer Name
FogSignal Fog Signal
Name Alias Type Length Sample Data
Information Information String 15 (2)20s
Label Label String 6 Siren
Feature Class Name Layer Name RadarPoints Radar Points
Name Alias Type Length Sample Data
Name Name String 15 Radar Tr.
Information Information String 20 Radar Points
Feature Class Name RadioTelevisionTower
Name Alias Type Length Sample Data
Description Description String 30 Radio, Television Mast
Label Label String 10 Tv.Tr.
Feature Class Name Geometry Type
BridgeTupeMamararay Line
Name Alias Type Length Sample Data
Name Name String 50 Boğaziçi Bridge
Feature Class Name AnchoringArea
Name Alias Type Length Sample Data
Information Information String 50 Passenger Ships
Feature Class Name Layer Name HighVoltageTransmission Line
High-Voltage Transmission
Name Alias Type Length Sample Data
Information Information String 50 66 m above sea level
AddInformation Add Information String 50 High-Voltage Transmission Geometry Type
Line
AttributeDesign AttributeDesign
Layer ofAnchoring AreaDesign
Layer ofHigh-Voltage TransmissionDesign Layer Design
Layer ofBridges, Tube and Rail Tube TunnelDesign
Layer Design
Layer Name Geometry Type
Anchoring Area Polygon
Layer Design
Layer Name
Bridges, Tube and Rail Tube Tunnel
AttributeDesign
Radio Television Tower Point
AttributeDesign
Layer ofRadio Television TowerDesign AttributeDesign
Layer ofRadar PointsDesign
Layer Design
Layer Name Geometry Type
AttributeDesign Layer ofFog SignalDesign
Layer Design
Geometry Type Point Layer ofFerry QuayDesign
Layer Design
Layer ofDirection of CurrentDesign Layer Design
Table 7. Cont. Design of layers and attributes The International Archives of the Photogrammetry, Remote Sensing and Spatial Information Sciences, Volume XLI-B4, 2016
Feature Class Name Layer Name
SubmarineCables Submarine Cables
Name Alias Type Length Sample Data
LineDistance Cable Distance String 10 1232 m Information Information String 50 Sabmarine Cable
Feature Class Name Layer Name SeaDephtPoint Sea Depht Point
Name Alias Type Length Sample Data
SeaDephtPoint Sea Depht Point Float -38
Feature Class Name Layer Name CorrelatePoint Correlate Point
Name Alias Type Length Sample Data
PointNumber Point Number String 20 Coralete Point 1 AttributeDesign
AttributeDesign
Layer ofDepth of Correlate PointDesign Layer Design
Geometry Type Point Layer of Sea Depth Point Design
Layer Design
Table 7. Cont. Design of layers and attributes
4. WEB BASED GIS APPLICATION
All navigation charts have been imported into GIS environment and georeferencing has been performed for each map. Total of 3032 features have been digitized in accordance with layer
Ferry Quay 48 Settlement
Centres 102
Table 8. Digitized layer feature counts
In order to acquire topography of the seafloor, a digital terrain model has been produced using sea depth points by performing ANUDEM (Hutchinson, 2011). Seafloor topography of Bosphorus can be seen in Figure 5.
Figure 5. Seafloor topography
Web based GIS application have been developed using Web AppBuilder interface. In order to create an application in Web AppBuilder, created geographic database must be shared as service using ArcGIS Server or cloud. Therefore, once integration and analysis are performed, all data have been published as web services.
Search and query widgets have been created using Web AppBuilder to provide end-users ability to find detailed information (Figure 6).
Figure 6. Widget design
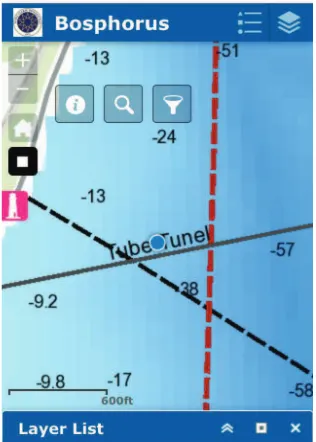
PC and mobile compatible versions of web application have been created separately since orientation and resolution need to be suitable for both devices. Web based GIS application can be accessed using this link: www.gis.yildiz.edu.tr/webservices.html Final look of the web application can be seen in Figure 7.
Figure 7. Web based GIS application
Users can search and query all the features in the system such as piers, lighthouses, currents etc. Lighthouses play a key role for sailing during night. So, created system allows users to query location and information about lighthouses or any other features in the web application. Sample queries can be seen in Figure 8. The International Archives of the Photogrammetry, Remote Sensing and Spatial Information Sciences, Volume XLI-B4, 2016
(a)
(b)
Figure 8. (a) Lighthouse query, (b) Current query Mobile compatibility of the created application has been tested using Apple iPhone 5. The system has the ability to locate the user’s location using mobile device’s GPS (Figure 9).
Figure 9. GPS location of user in the application
5. RESULTS
In this study, a web based coastal management GIS application of Bosphorus with physical and biological components of coast management system have designed and developed using ArcGIS Online. Designed system allows users to obtain detailed information about anchorage grounds, depth, sedimentation, currents, wrecks, traffic separation schemes, traffic flow directions, closed areas, lighthouses, buoys, beacons and points of interests in land along Bosphorus coast and sea. ArcGIS
Online and Web AppBuilder interfaces which were used to create this web application allows users to rapidly create web services and web mapping applications.
Web based geographic information system are being widely used through the developments of mobile, internet and web technologies. Widespread use of web GIS makes daily life easier and practical. Consequently, developing integrated coastal zone management processes for cities along shoreline with the help GIS and web technologies will yield the problems relate to management of resources, sustainability of sea and marine protected areas.
ACKNOWLEDGEMENTS
Georeferencing and digitizing processes of this study has been carried out in the framework of a bachelor thesis.
REFERENCES
Bartlett, D., Smith, J., 2004. GIS for coastal zone management. CRC press.
Fu, P., Sun, J., 2010. Web GIS: principles and applications. Esri Press.
Hutchinson, M.F., 2011. "ANUDEM version 5.3, user guide" Canberra: Fenner School of Environment and Society,
Australian National University,
http://fennerschool.anu.edu.au/files/usedem53_pdf_16552.pdf (13.04.2016).
Law, D., 2013. "ArcGIS for Server 101: Understanding architecture, deployment, and workflows", https://www.esri.com/~/media/Files/Pdfs/news/arcuser/0313/arc gis101.pdf (13.04.2016).
Mayerle, R., Al-Subhi, A., Fernández Jaramillo, J., Salama, A., Bruss, G., Zubier, K., Runte, K., Turki, A., Hesse, K., Jastania, H., Ladwig, N., Mudarris, M., 2016. Development of a coastal information system for the management of Jeddah coastal waters in Saudi Arabia. Computers & Geosciences, 89, pp. 71-78.
Moore, T., Morris, K., Blackwell, G., Gibson, S., Stebbing, A., 1999. An Expert System for Integrated Coastal Zone Management: A Geomorphological Case Study. Marine Pollution Bulletin, 37, pp. 361-370.
Noujas, V., Thomas, K.V., Badarees, K.O., 2016. Shoreline management plan for a mudbank dominated coast. Ocean Engineering, 112, pp. 47-65.
Peng, Z.R., 1999. An Assessment Framework for the Development of Internet GIS. Environment and Planning B: Planning and Design, 26, pp. 117-132.
Rodríguez, I., Montoya, I., Sánchez, M.J., Carreño, F., 2009. Geographic Information Systems applied to Integrated Coastal Zone Management. Geomorphology, 107, pp. 100-105. Sahin, K., Gumusay, M.U., 2007. Internet GIS and Its Usage in Forest Fires. Harita Dergisi, 138, pp. 69 - 83.
Tasligil, N., 2004. The Geographical Importance of the Bosphorus Strait, Marmara Geographical Review, 10.