Volume 6, Number 6, June 2010 (Serial Number 61)
Journal of
Modern Accounting and Auditing
Publication Information:
Journal of Modern Accounting and Auditing (ISSN1548-6583) is published monthly in hard copy and online by
David Publishing Company located at 1840 Industrial Drive, Suite 160, Libertyville, Illinois 60048, USA.
Aims and Scope:
Journal of Modern Accounting and Auditing, a monthly professional academic journal, covers all sorts of researches
on accounting research, financial theory, capital market, audit theory and practice from experts and scholars all over the world.
Contributing Editors:
YU Zeng-biao, male, Ph. D. of accounting, Xiamen University – UIUC, professor and Ph.D. supervisor of Tsinghua University, China.
DU Xing-qiang, male, Ph. D. of economics, professor and Ph. D. supervisor of Accounting Department, Xiamen University, China.
Mohammad Talha, male, Dr., associate professor of King Fahd University of Petroleum & Minerals, Saudi Arabia. João Paulo Torre Vieito, Ph. D., Dean, School of Business Studies, Polytechnic Institute of Viana do Castelo, Portugal.
Editors:
Cecily Z., Lily L., Ken S., Gavin D., Jim Q., Jimmy W., Hiller H., Swallow M., Susan H., Jane C., Betty Z., Gloria G., Stella H., Clio Y., Grace P., Caroline L., Alina Y., Cathy C., Linda Z., Canny H., Yolanda Z., Mary D..
Manuscripts and correspondence are invited for publication. You can submit your papers via Web Submission, or E-mail to [email protected]. Submission guidelines and Web Submission system are available at http://www.davidpublishing.com.
Editorial Office:
1840 Industrial Drive, Suite 160 Libertyville, Illinois 60048 Tel: 1-847-281-9826
Fax: 1-847-281-9855
E-mail: [email protected], [email protected]
Copyright©2010 by David Publishing Company and individual contributors. All rights reserved. David Publishing Company holds the exclusive copyright of all the contents of this journal. In accordance with the international convention, no part of this journal may be reproduced or transmitted by any media or publishing organs (including various websites) without the written permission of the copyright holder. Otherwise, any conduct would be considered as the violation of the copyright. The contents of this journal are available for any citation, however, all the citations should be clearly indicated with the title of this journal, serial number and the name of the author.
Abstracted / Indexed in:
Database of EBSCO, Massachusetts, USA Chinese Database of CEPS, Airiti Inc. & OCLC
Chinese Scientific Journals Database, VIP Corporation, Chongqing, P.R.China Ulrich’s Periodicals Directory
Subscription Information:
Price: Print $360 Online $300; Print and Online $560
David Publishing Company
1840 Industrial Drive, Suite 160, Libertyville, Illinois 60048 Tel: 1-847-281-9826. Fax: 1-847-281-9855
Jour na l of M ode r n
Ac c ount ing a nd Audit ing
Volume 6, Number 6, June 2010 (Serial Number 61)
Contents
Financial Managerment and Practice
Does investor protection affect the choice of earnings management methods through real activity
manipulation and accrual manipulation? Asian comparison 1
Ratna Candra Sari, Sony Warsono, Sri Suryaningsum
How selected primary schools in rural New Zealand manage their financial resources of limited
government funding in order to effectively meet their schools objectives 14
Crabtree Jen, France Adrian
Discussion on Capital Market
The views and control of environmental cost 28
SONG Chuan-lian, HAN Li-rong
The effect of earnings forecast precision on firm value and insider trading under voluntary
disclosure in Taiwan 33
CHANG Wei-shuo
Analysis on the exchange rate of Australian dollar 44
JIA Xian-wei
Accounting Research and Practice
Modus operandi of transnational transfer pricing for window dressing 51
Abdul Noor Basha, Gudimetla Venkata Satyasekhar
Fair value accounting under financial crisis 59
June 2010, Vol.6, No.6 (Serial No.61) Journal of Modern Accounting and Auditing, ISSN 1548-6583, USA
Does investor protection affect the choice of earnings management
methods through real activity manipulation and accrual manipulation?
Asian comparison
Ratna Candra Sari1, Sony Warsono2, Sri Suryaningsum3
(1. Faculty of Sosial and Economics, Yogyakarta State University, Yogyakarta 55281, Indonesia;
2. Economics and Business Faculty, Gadjah Mada University, Yogyakarta 55281, Indonesia;
3. Universitas Pembangunan Veteran Yogyakarta, Yogyakarta 55281, Indonesia)
Abstract: This paper examines systematic differences in earnings management through real activity manipulation and accrual manipulation across 7 Asia countries. The study proposes arguments that in economies with high investor protection, managers prefer to manage earnings through real activity manipulation rather than through accrual manipulation because accrual manipulation is more likely to draw auditors or regulators scrutiny than real decisions about pricing and production. The study findings are consistent with prediction. Despite being in economies with high investor protection, managers still have bigger discretion in managing earnings through real activities rather than accrual manipulation.
Key words: earnings management; real activity manipulation; investor protection
1. Introduction
The protection of investor rights, particularly outside investors, is important in creating economic incentives for the development of financial markets (Hart, 1995). More developed financial markets create greater external financing opportunities for firms because legal systems protect investors by conferring on them rights to discipline insiders (e.g., to replace managers), as well as by enforcing contracts designed to limit insiders’ private control benefits (e.g., La Porta, et al., 1998; Nenova, 2000; Claessens, et al., 2002; Dyck & Zingales, 2002). Thus, legal systems protecting outside investors reduce insiders’ need to conceal their activities.
This paper focuses on investor protection as a significant determinant of earnings management activity. Leuz, et al. (2003) argues that strong and well-enforced outsider rights limit insiders’ acquisition of private control benefits, and consequently, mitigate insiders’ incentives to manage accounting earnings because they have little to conceal from outsiders. This insight suggests that the pervasiveness of earnings management is increasing in private control benefits and decreasing in outside investor protection.
Prior research documents greater financial transparency in countries with stronger investor protection
Ratna Candra Sari, Ph. D candidate and lecturer, Faculty of Sosial and Economics, Yogyakarta State University; research fields: tunnelling, earnings management and corporate governance.
Sony Warsono, lecturer, Economics and Business Faculty, Gadjah Mada University; research fields: information technology and corporate governance.
Does investor protection affect the choice of earnings management methods through real activity manipulation and accrual manipulation? Asian comparison
2
regimes (Bhattacharya, et al., 2003; Bushman, et al., 2004), and there is evidence that earnings are less managed and in these countries (e.g., Ball, et al., 2000; Hung 2000; Leuz, et al., 2003). Leuz, et al. find that earnings management is more pervasive in countries where the legal protection of outside investors is weak, because in these countries insiders enjoy greater private control benefits and hence have stronger incentives to manipulate firm performance.
Roychowdhury (2006) finds evidence that managers in US firms manipulate earnings through real activity. Roychowdhury finds evidence suggesting price discounts to temporarily increase sales, overproduction to report lower cost of goods sold, and reduction of discretionary expenditures are used to improve reported margins. This is contrary to Leuz’s finding that in countries with strong legal protection, managers are less aggressive to manage earnings. We argue that in strong legal enforcement economies, managers prefer to manage earnings through real activity manipulation rather than through accrual manipulation.
The manipulation of real activity potentially reduces firm value. Real activities manipulation can reduce firm value because actions taken in the current period to increase earnings can have a negative effect on cash flows in future periods. For example, aggressive price discounts to increase sales volumes and meet some short-term earnings target can lead customers to expect such discounts in future periods as well. This can imply lower margins on future sales. Overproduction generates excess inventories that have to be sold in subsequent periods and imposes greater inventory holding costs on the company. There is evidence that managers manipulate real activity in strong investor protection country (Roychowdhury, 2006). So the purpose of this study is to examine whether legal systems affect the choice of earnings management methods.
According to surveys conducted by Bruns & Merchant (1990) and Graham et al. (2005), financial executives indicate a greater willingness to manipulate earnings through real activities rather than accruals. There are at least two possible reasons for this. Firstly, accrual manipulation is more likely to draw auditor or regulator scrutiny than real decisions about pricing and production. Secondly, relying on accrual manipulation alone entails a risk. The realized year-end shortfall between un-manipulated earnings and the desired threshold can exceed the amount by which it is possible to manipulate accruals. If that happens, and reported income falls below the threshold, real activities cannot be manipulated at year-end. So, we argued that in countries with high investor protection, managers don’t have discretionary to manage earnings through accrual manipulation because accrual manipulation is easily to detect. Managers will prefer to manage earnings through real activities.
This study focuses on Asia countries to make contributing to the future of the society and Asia by expanding its range of the responsibilities through legal enforcement and investor protection in order to enhance economic development, mutual understanding and cooperation in Asia. The East Asian countries of Hong Kong, Malaysia, Singapore, Indonesia, Japan, Korea and India provide a useful setting for testing the importance of investor protection. These countries have accounting standards that are generally viewed as high-quality, but (with the possible exception of Hong Kong). They have institutional structures that give preparers incentives to issue low-quality financial reports. Reporting quality of earnings ultimately is determined by the underlying economic and political factors influencing managers’ and auditors’ incentives, and not by accounting standards per se. Shareholder litigation is an important mechanism to enforce high quality financial.
Does investor protection affect the choice of earnings management methods through real activity manipulation and accrual manipulation? Asian comparison
While prior research has provided evidence on managers’ incentives for earnings management and earnings management more aggressive in countries with low legal enforcement but there is relatively little evidence on what manager’s methods to manage earnings in different legal environment. In addition, prior research used accrual manipulation to measure earnings management but actually managers have flexibility to manage earnings with accrual manipulation, real activities manipulation or classification shifting. This paper attempts to provide evidence that investor protection determines manager’s choices between real activities manipulation versus accrual manipulation when they have the flexibility to engage both. To measure earnings management through real activity manipulation we use Roychowdhury’s model.
Firstly, this study is useful to identify factors that affect method choice by managers to manage earnings. Secondly, this study gives understanding to evaluate effectiveness of legal enforcement in protect outsider (minority) investor when managers have flexibility to choose earnings management method.
2. Hypothesis
Legal systems protect investors by conferring on them rights to discipline insiders (e.g., to replace managers), as well as by enforcing contracts designed to limit insiders’ private control benefits (e.g., La Porta et al., 1998; Nenova, 2000; Claessens et al., 2002; Dyck & Zingales, 2002). As a result, legal systems that effectively protect outside investors reduce insiders’ need to conceal their activities. Earnings management can be defined as non-neutral financial reporting in which managers intervene intentionally in the financial reporting process to produce some private gain (Schipper, 1989). Managers can intervene by modifying how they interpret financial accounting standards and accounting data, or by timing or structuring transactions (Healy & Wahlen, 1999).
Prior accounting research has documented three main methods of earnings management. The most commonly studied method is accrual management (e.g., Healy, 1985; Jones, 1991; McNichols & Wilson, 1988; Rangan, 1998; Teoh, et al., 1998; Phillips, et al., 2003). A second type of earnings management can occur through the manipulation of real activities, such as providing price discounts to increase sales and cutting discretionary expenditures, to manage earnings (e.g., Baber, et al., 1991; Dechow & Sloan, 1991; Bushee, 1998). Third type of earnings management tools is the misclassification of items within the income statement.
We focus on accrual manipulation and real activities because in study comparison across countries, earnings management through classification shifting can be detected if these countries use the same standard. Real activities manipulation as departures from normal operational practices is motivated by managers’ desire to mislead at least some stakeholders into believing certain financial reporting goals have been met in the normal course of operations. These departures do not necessarily contribute to firm value but the departures enable managers to meet reporting goals. Certain real activities manipulation methods, such as price discounts and reduction of discretionary expenditures, are possibly optimal actions in certain economic circumstances. However, if managers engage in these activities more extensively with the objective of meeting/beating an earnings target, they are engaging in real activities manipulation (Roychowdhury, 2006).
Does investor protection affect the choice of earnings management methods through real activity manipulation and accrual manipulation? Asian comparison
4
threshold can exceed the amount by which it is possible to manipulate accruals. If that happens, and reported income falls below the threshold, real activities cannot be manipulated at year-end.
A number of studies discuss the possibility that managerial intervention in the reporting of financial statement process can occur not only via accounting estimates and methods, but also through operational decisions. Manipulation by management through real activities is less likely to draw auditor or regulator scrutiny. In contrast accrual manipulation is more easily to detect. We therefore propose that earnings management through accrual manipulation is less pervasive in countries where the legal protection of outside investors is strong, because in these countries legal system protect investor by conferring on them right to discipline insider.
H1: There is negative relationship between investor protection and abnormal accruals. Countries with high investor protection exhibit lower abnormal accruals than in countries with weak investor protection.
There is evidence that manager in US firms manipulate earnings through real activity (Roychowdhury, 2006). US firms are characterized by large stock markets, low ownership concentration, extensive outsider rights, high disclosure, and strong legal enforcement. Leuz, et al. (2003) finds that in countries with strong legal protection, managers are less aggressive to manage earnings through accrual manipulation. So we argue that in strong legal enforcement economies, managers prefer to manage earnings through real activity manipulation rather than accrual manipulation. Accrual manipulation is more easily to detect, in other hand, real activities manipulation can be subjective, and auditors might be limited in their ability to verify the appropriate classification. In countries with low legal enforcement, managers have great discretionary to manage earnings with both accrual manipulation and real activity manipulation. In hypothesis 2 we argue that when legal enforcement strong, managers prefer to manage earnings through real activity manipulation, such as sales manipulation, reduce discretionary expenses reduction and production increases rather than accrual manipulation.
H2: There is positive relationship between investor protection and real activity manipulation.
3. Research method
3.1 Measurement of earnings management through real activity manipulation
Real activities manipulation is departures from normal operational practices, motivated by managers’ desire to mislead at least some stakeholders into believing certain financial reporting goals have been met in the normal course of operations (Roychowdhury, 2006).
To detect real activities manipulation we investigate patterns in CFO (Cash Flow from Operations) and production costs following Roychowdhury (2006). Sales manipulation is defined as managers’ attempts to temporarily increase sales during the year by offering price discounts or more lenient credit terms. The cash inflow per sale, net of discounts, from these additional sales is lower as margins decline. The lower margin due to the price discounts causes production costs relative to sales to be abnormally high. These are essentially price discounts and lead to lower cash inflow over the life of the sales, as long as suppliers to the firm do not offer matching discounts on firm inputs. In general, sales management activities to lead to lower current-period CFO and higher production costs than what is normal given the sales level.
Following Roychowdhury (2006), normal cash flow from operations is a linear function of sales and change in sales in the current period. To estimate the model, we run the following cross-sectional equation:
CFOt /At-1 = α0 + α1(1/At-1) + α2(St/At-1) + α3(ΔSt /At-1) + εt (1)
Does investor protection affect the choice of earnings management methods through real activity manipulation and accrual manipulation? Asian comparison
firm-year, abnormal cash flow from operations is the actual CFO minus the ‘‘normal’’ CFO calculated using estimated coefficients from the corresponding industry year model and the firm-year’s sales and lagged assets.
Abnormal level = Actual level-Normal Level. (2) To manage earnings upward, managers of manufacturing firms can produce more goods than necessary to meet expected demand. With higher production levels, fixed overhead costs are spread over a larger number of units, lowering fixed costs per unit. As long as the reduction in fixed costs per unit is not offset by any increase in marginal cost per unit, total cost per unit declines. This implies that reported COGS (Cost of Goods Sold)is lower, and the firm reports better operating margins. Nevertheless, the firm incurs production and holding costs on the over-produced items that are not recovered in the same period through sales. As a result, cash flows from operations are lower than normal given sales levels. Ceteris paribus, the incremental marginal costs incurred in producing the additional inventories result in higher annual production costs relative to sales.
The model for normal COGS is estimated as:
COGSt /At-1 = α0 + α1 (1/At-1) + α2 (St/At-1) + εt (3)
The model for “normal” inventory growth using the following equation:
ΔINVt/At-1 = α0 + α1 (1/At-1) + α2 (ΔSt/At-1) + α3 (ΔSt-1/At-1) + εt (4)
Where, ΔINVt is the change in inventory in period t.
Production costs as:
PRODt = COGSt + ΔINVt (5)
Using (3) and (4), normal production costs from the following industry-year equation:
PRODt/At-1 = α0 + α1 (1/At-1) + α2 (ΔSt/At-1) + α3 (ΔSt/At-1) + α4 (ΔSt-1/At-1) + εt (6)
“Discretionary expenses” is expressed as a linear function of contemporaneous sales, similar to COGS. The relevant equation would then be:
DISEXPt/At-1 = α0 + α1 (1/At-1) + α2 (St-1/At-1) + εt (7)
Where, DISEXPt is discretionary expenses in period t. Discretionary expenses as DisExp = R&D +
Advertising + SG&A expenses.
3.2 Measurement accrual manipulation
Signed abnormal accruals are used rather than absolute (unsigned) abnormal accruals (Hribar & Nichols, 2006). A cross-sectional Jones (1991) model is not practical for the calculation of abnormal accruals with international data because the number of industry observations per country can be quite small, and this may explain, at least in part, why Jones-type abnormal accruals perform unreliably in international settings (Wysocki, 2004; Meuwissen, et al., 2005). We avoid this problem by using a linear expectation model adapted from DeFond and Park (2001) which uses a firm’s own prior year accruals in calculating the expectation benchmark. Specifically, expected accruals are based on a firm’s prior year ratio of current accruals to sales, and the prior year’s ratio of deprecation expense to gross property plant and equipment (hereafter PPE). Another benefit of this approach is that we also implicitly control for cross-country differences in accounting standards by using a firm as its own control to compute abnormal accruals. Therefore abnormal accruals are contextualized relative to the specific accounting standards of a particular country.
Using data from OSIRIS Database, predicted accruals are calculated as:
Predicted accruals = {[Salest (Current accrualst-1/salest-1]
+ Gross PPEt (Depreciationt-1/Gross PPEt-1/Total assetst-1] (8)
Does investor protection affect the choice of earnings management methods through real activity manipulation and accrual manipulation? Asian comparison
6
Total accruals in year t are calculated as follows:
Total accruals = {Earnings before extraordinary items - Operating cash flows}/Total assetst-1 (10)
Current accruals = Change in non-Cash working capital
= Δ [Total current assets - Cash and short term Investments
- Treasury stock shown as current assets]- Δ [Total current liabilities
- Total amount of debt in current liabilities - Proposed dividends] (11)
3.3 Measurement of investor protection
We begin with a descriptive country cluster analysis, which groups countries with similar legal and institutional characteristics. We use multiple investor protection measures as follows:
(1) Outside Investor Right: This is an aggregate measure of minority shareholder rights and ranges from zero to five;
(2) Disclosure requirements.
(3) Important of equity market: This is measured by the mean rank across three variables used in La Porta et al. (1997). Each variable is ranked such that higher scores indicate a greater importance of the stock market.
(4) Legal enforcement: This is measured as the mean score across three legal variables used in La Porta et al. (1998). Three variables range from 0 to 10.
Cluster analysis is based on four measurement of investor protection. Then we compare score earnings management between clusters. We use accrual manipulation and real activities to measure earnings management activities.
To test H1 we compare abnormal accrual between clusters. To examine more explicitly which institutional factors are the determinant of earnings management, we undertake equation analysis based on Model 1 to test H1:
Model 1:
AB_ACCRit= β0 + β1 LAW + β2 OUTSIDE_RIGHT
+ β3 DIS_REQ + β4LEG_ENF + β5 IM +Eit (12)
To test H2a- H2b, we use Model 2a and Model 2b: Model 2a:
AB_CFO = β0 + β1LAW + β2OUTSIDE_RIGHT + β3DIS_REQ + β4LEG_ENF + β5IM + eit (13)
Model 2b:
AB_Prod = β0 + β1LAW + β2OUTSIDE_RIGHT + β3DIS_REQ + β4LEG_ENF + β5IM + eit (14)
Where, AB_ACCRit = Abnormal accruals scaled by lagged total assets for firm i in year t; AB_CFO =
Abnormal cash flow; AB_DiscExp = Abnormal discretionary expenses; AB_Prod = Abnormal production cost.
INVPRO = Proxies of investor protection, measured six ways; Outside_Right = Outside investor right; DIS_REQ = Index of disclosure requirement; LEG_ENF = Legal enforcement; IM = Important of equity market.
Because abnormal cash flow, discretionary expenses and production cost are more aggressive in suspect firm (firm close to zero earnings), we conduct sensitivity analysis to regress Model 1, Model 2a and Model 2b in full sample (suspect & non suspect firm).
4. Results
4.1 Descriptive statistics
Does investor protection affect the choice of earnings management methods through real activity manipulation and accrual manipulation? Asian comparison
traded around the world. Only industrial companies are included in empirical analysis. Each firm must have income statement and balance sheet information for estimation period. The final sample consists of 5,931 firm-year observations, across 7 countries for fiscal years 2003-2007.
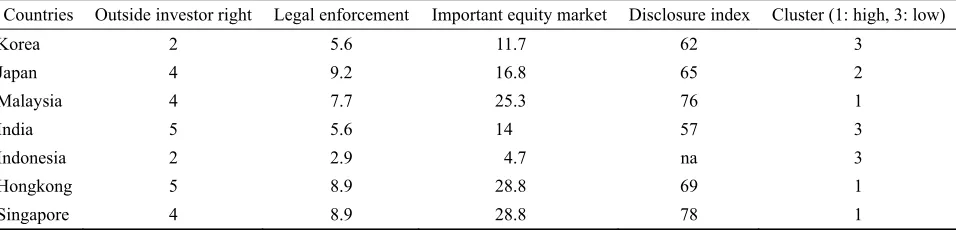
Table 1 panel A presents the number of firm-year observation per country as well as descriptive statistic for three individual earnings management measure. Panel B presents institutional characteristics of each country.
Table 1 Descriptive statistics for earnings management and institutional characteristics
Panel A Country score for earnings management measures
Countries Firm-years Cluster Abnormal CFO Abnormal prod cost Abnormal accrual
Korea 1141 3 0.0012 -0.1281 0.0834
Japan 2785 2 0.0005 -0.0003 0.0631
Malaysia 792 1 0.0315 -0.0002 0.0561
India 566 3 -0.0269 0.0000 0.1201
Indonesia 129 3 0.0000 0.0000 0.0788
Hongkong 101 1 0.0002 0.0000 0.1440
Singapore 398 1 0.0001 0.0055 0.0995
Panel B Institutional characteristics of the sample countries
Countries Outside investor right Legal enforcement Important equity market Disclosure index Cluster (1: high, 3: low)
Korea 2 5.6 11.7 62 3
Japan 4 9.2 16.8 65 2
Malaysia 4 7.7 25.3 76 1
India 5 5.6 14 57 3
Indonesia 2 2.9 4.7 na 3
Hongkong 5 8.9 28.8 69 1
Singapore 4 8.9 28.8 78 1
Panel A of Table 1 provides descriptive statistics for three individual earnings management measures. The three individual earnings management measures exhibit striking differences across countries. The statistics of the mean abnormal CFO and abnormal production cost show that earnings management with real activity manipulation aggressive in economies with high investor protection such as Singapore, Hongkong compared to in economies with low investor protection such as Korea and India. The mean abnormal accrual is high in Singapore compared to Japan.
4.2 Result earnings management with real activities manipulation
Table 2 presents descriptive statistics comparing suspect firm-year to the full sample. Firms that just meet the zero earnings (suspect firm) are probably trying to meet the zero target earnings through real activities manipulation. Suspect firm-years have a lower mean of abnormal low CFO than non suspect firm (-0.0031 versus 0.0023). Mean of abnormal production cost is higher for suspect firm compared to non suspect firms (0.1388 versus -0.0074).
4.3 Estimation model
Does investor protection affect the choice of earnings management methods through real activity manipulation and accrual manipulation? Asian comparison
8
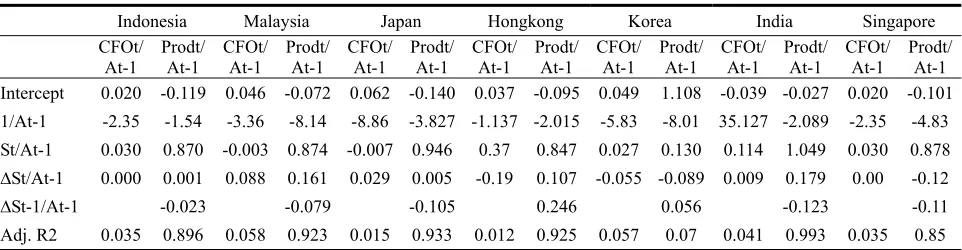
indicating that conditional on contemporaneous sales, a higher change in sales implies higher CFO.
Table 2 Descriptive statistics comparing suspect firm-year to rest of the sample
Suspect firm year Non suspect firm Rest of the sample
Full sample 5,931 firm-years with 273 suspect firm-year
means means means
Net Income/ TA 0.0029 0.0378 0.3620
Abnormal Accruals -0.0884 -0.0675 -0.0685
Abnormal CFO -0.0031 0.0023 0.0021
Abnormal Prod 0.1388 -0.0074 -0.0006
Table 3 Model Parameters
Indonesia Malaysia Japan Hongkong Korea India Singapore
CFOt/ At-1 Prodt/ At-1 CFOt/ At-1 Prodt/ At-1 CFOt/ At-1 Prodt/ At-1 CFOt/ At-1 Prodt/ At-1 CFOt/ At-1 Prodt/ At-1 CFOt/ At-1 Prodt/ At-1 CFOt/ At-1 Prodt/ At-1 Intercept 0.020 -0.119 0.046 -0.072 0.062 -0.140 0.037 -0.095 0.049 1.108 -0.039 -0.027 0.020 -0.101
1/At-1 -2.35 -1.54 -3.36 -8.14 -8.86 -3.827 -1.137 -2.015 -5.83 -8.01 35.127 -2.089 -2.35 -4.83
St/At-1 0.030 0.870 -0.003 0.874 -0.007 0.946 0.37 0.847 0.027 0.130 0.114 1.049 0.030 0.878
∆St/At-1 0.000 0.001 0.088 0.161 0.029 0.005 -0.19 0.107 -0.055 -0.089 0.009 0.179 0.00 -0.12
∆St-1/At-1 -0.023 -0.079 -0.105 0.246 0.056 -0.123 -0.11
Adj. R2 0.035 0.896 0.058 0.923 0.015 0.933 0.012 0.925 0.057 0.07 0.041 0.993 0.035 0.85 Notes: *significant at level 10%; This table reports the estimated parameters in following equation: CFOt /At-1 = α0 + α1 (1/At-1) +
α2 (St/At-1) + α3 (ΔSt/At-1) + εt; PRODt /At-1 = α0 + α1 (1/At-1) + α2 (ΔSt/At-1) + α3 (ΔSt/At-1) + α4 (ΔSt-1 / At-1)+ εt. 4.4 Comparison of suspect firm years with non suspect firm-years and the rest of sample
If firm-year that report profit just above zero undertake activities that adversely affect their CFO, then abnormal CFO for these firm-years, should be negative compared to the rest of sample. To test this, we estimate the following equation:
Y = α + β1 (Net Income) + β2(Suspect_NI) + ε (15)
The dependent variable, Y is abnormal CFO and abnormal production cost in period t. Suspect_NI is an
indicator variable that is set equal to 1 if firm-years belong to the earnings category just right of zero, and zero otherwise.
Table 4 Comparison suspect firm years with non suspect sample
Abnormal CFO Abnormal production costs
Intercept 0.022
(2.614)
-0.002 (-0.200)
Net Income 0.008*
(1.061)
-0.269* (-5.518)
Suspect_NI -0.217*
(-5.552)
0.142* (3.246) Notes: *significant at level 10%.
Does investor protection affect the choice of earnings management methods through real activity manipulation and accrual manipulation? Asian comparison
When Y is abnormal production cost, the coefficient on SUSPECT_NI is positive 0.142. The coefficient
indicates that the mean abnormal production cost of suspects firm-years is larger 14.2% of assets than the mean across the rest of sample.
4.5 Descriptive cluster analysis
To provide descriptive evidence on systematic pattern in earnings management method across group of countries with similar institutional characteristics, we begin with cluster countries based on institutional characteristics (Leuz, et al., 2003). The first cluster is characterized by large stock markets, low ownership concentration, extensive outsider right, high disclosure, and strong legal enforcement. The second and third cluster show markedly smaller stock markets, higher ownership concentration, weaker investor protection, lower disclosure level, and weaker enforcement, with the distinction that countries in the second cluster have significantly better legal enforcement than countries in the third cluster. Based on institutional characteristics, we refer countries in the first cluster as ‘high investor protection economies’. The countries in the second and third cluster
To provide descriptive evidence on the systematic patters of earnings management method across cluster, we use ANOVA analysis to compare aggressiveness of real activity manipulation and accrual manipulation across group of countries.
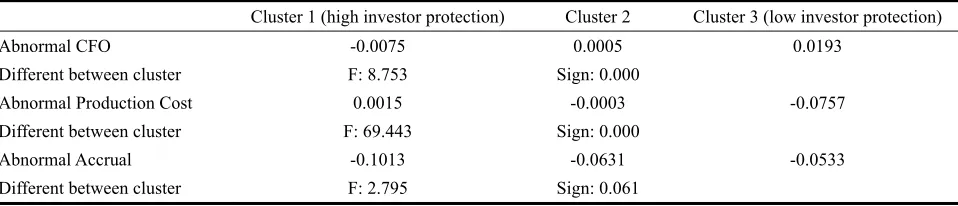
Table 5 shows the difference of aggressiveness earnings management method across cluster.
Table 5 Pervasiveness of earnings management by cluster
Cluster 1 (high investor protection) Cluster 2 Cluster 3 (low investor protection)
Abnormal CFO -0.0075 0.0005 0.0193
Different between cluster F: 8.753 Sign: 0.000
Abnormal Production Cost 0.0015 -0.0003 -0.0757
Different between cluster F: 69.443 Sign: 0.000
Abnormal Accrual -0.1013 -0.0631 -0.0533
Different between cluster F: 2.795 Sign: 0.061
Table 5 shows that the differences between cluster’s average earnings management are statistically significant. High investor countries (Cluster1) exhibit lower level of earnings management with accrual manipulation than low investor protection countries. This finding consistent with leuz et al. (2003) that earnings management is expected to decrease in investor protection because strong protection limits insider’s ability to acquire private control benefit, which reduces incentives to mask firm performance. But earnings management with real activity management is higher in economies with strong investor protection. Real activity manipulation can be detected by investigate the pattern of CFO and production cost. Deviation from normal level of CFO and Production cost are termed abnormal CFO and abnormal production cost. The abnormal CFO is lower in economies with high investor protection rather than in low investor protection. Abnormal production cost is higher in economies with high investor protection than in low investor protection.
Suspect firm year more aggressive in real activity manipulation, we conduct sensitivity analysis to compare differences in earnings management activity between clusters for suspect firm year. Thus, these results are sensitive to sample selection.
Does investor protection affect the choice of earnings management methods through real activity manipulation and accrual manipulation? Asian comparison
10 analysis.
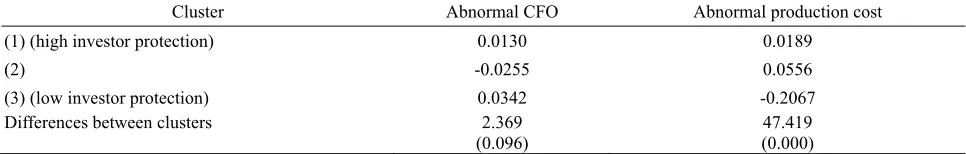
Table 6 Pervasiveness of real activity manipulation suspect year firm by cluster
Cluster Abnormal CFO Abnormal production cost
(1) (high investor protection) 0.0130 0.0189
(2) -0.0255 0.0556
(3) (low investor protection) 0.0342 -0.2067
Differences between clusters 2.369
(0.096)
47.419 (0.000) Notes: *significant at level 10%.
In summary, the evidence earnings management with real activity manipulation is higher in economies with high investor protection rather than in economies with low investor protection. Earnings management with accrual manipulation is more aggressive in economies with low investor protection than in economies with high investor protection.
4.6 The role of investor protection: Multiple regression analysis
The previous analysis shows that pervasiveness of earnings management with real activities manipulation or accrual manipulation is systematically related to a country’s institutional characteristics. A key question is which institutional factors are primary determinant of earnings management’s method choice. We posit that better investor protection result in less earnings management with accrual manipulation because accrual manipulation is easy to detect and hence lower incentives to conceal firm performance with accrual manipulation. Our multiple regression examines the relation between earnings management’s method choice and investor protection.
Table 7 Earnings management’s method choice and investor protection
Abnormal accrual Abnormal CFO Abnormal production cost
Constant 1.974
(4.023)
0.392 (1.511)
-0.725 (-2.259) Outside investor right -0.082*
(-3.627)
-0.006 (-0.874)
0.059* (6.709)
Legal enforcement -0.013
(-1.318)
-0.009* (-2.517)
0.009* (2.191) Important equity market 0.013*
(1.806)
-0.006* (-2.309)
-0.006* (-1.879)
Disclosure index -0.036*
(-4.350)
-0.001* (-0.238)
0.007* (0.044) R2
Notes: *significant at level 10%.
Our multiple regression results presented at Column 1 of Table 7 report regression analysis using abnormal accrual as the dependent variable. Results show that outside investor right, legal enforcement and disclosure index exhibit a significant negative association with abnormal accrual. The higher level of investor protection will reduce aggressiveness earnings management with accrual manipulation. All variables consistent with prediction, with the exception important of equity market variables.
Does investor protection affect the choice of earnings management methods through real activity manipulation and accrual manipulation? Asian comparison
exhibit a significant negative association with abnormal low CFO. The higher outside investor right, legal enforcement and disclosure index, the lower level abnormal CFO. The result also support that investor protection and abnormal high production cost are positively related. Column 3 of Table 6 show that outside investor right, legal enforcement, and disclosure index exhibit a significant positive association with abnormal production cost.
In summary, the multiple regression results are consistent with the hypothesis that investor protection affects earnings management method choice. In economies with high investor protection, it is too costly to manage earnings with accrual manipulation. The cost of detection of accrual manipulation is high because essentially, a manager can borrow earnings from future periods, through the acceleration of revenues or deceleration of expenses, in order to improve current earnings. The cost of detection bears a one-to-one cost of earnings reduction in the future; Future-period earnings will be mechanically lower by the net income that was accelerated to current earnings. The other type of earnings management can occur through the manipulation of real activities, such as providing price discounts to increase sales and cutting discretionary expenditures, such as R&D, to manage earnings. Such actions can increase revenues or net income, but they are also costly. For example, cutting R&D spending to manage earnings may result in the loss of future income related to the forgone R&D opportunities. On the other hand, because the manipulation of real activities is not a GAAP violation, this earnings management tool is expected to have a lower cost of detection than accrual management. So we argue that in economies with high investor protection, manager prefer to use real activity manipulation to mask firm performance. The results of our analysis are consistent with our prediction.
5. Limitation and conclusion
This paper documents systematic differences in the earnings management method across countries with different level of investor protection. The authors perform ANOVA and multiple regression analysis to test differences earnings management’s method across cluster countries based on institutional characteristics. The analysis suggest that in economies with high investor protection earnings management with accrual manipulation is lower than in economies with low investor protection.
Prior research has provided evidence on managers’ incentives for earnings management and earnings management more aggressive in countries with low legal enforcement but there is relatively little evidence on what manager’s method to manage earnings in different legal environment. In addition, prior research used accrual manipulation to measure earnings management but actually management has flexibility to manage earnings with accrual manipulation, real activities manipulation or classification shifting. Earnings management through accrual manipulation is more likely to draw auditor or regulator scrutiny than real decisions about pricing and production. So this paper attempts to provide evidence that investor protection determine manager choice between real activities manipulation and accrual manipulation when they have the flexibility to engage both. We expect that earnings management through accrual manipulation decreases in legal protection because when investor protection is strong, accrual manipulation will decrease because it is easy to detect. But in strong investor protection countries, earnings management through real activities manipulation more aggressive because real activities manipulation can be subjective, auditor might be limited in their ability to verify the appropriate classification. In countries with weak investor protection, manager have great discretionary to manage earnings with both accrual manipulation and real activity manipulation.
Does investor protection affect the choice of earnings management methods through real activity manipulation and accrual manipulation? Asian comparison
12
with quality of outside investor right, legal enforcement, and quality of disclosure. Real activities manipulation is positively association with outside investor right, legal enforcement and quality of disclosure. This finding highlight that level of investor protection determine management’s choices on earnings management’s method.
The limitation of this study: The study does not include abnormal discretionary expenses to measure real activity manipulation because of unavailable data. We only measure the pattern of abnormal CFO and abnormal production cost. We argue that pattern abnormal discretionary expenses have been captured at the pattern of abnormal CFO. Reducing discretionary expenses has a positive effect on abnormal CFO in the current period, possibly at risk of lower cash flow in the future.
References:
Baber, W., Fairfield, P. & Haggard, J.. (1991). The effect of concern about reported income on discretionary spending decisions: The case of research and development. The Accounting Review, 66(4), 818-829.
Ball, R., Robin, A. & Wu, J.. (2003). Incentives versus standards: properties of accounting income in four East Asian countries.
Journal of Accounting and Economics,36, 235-270.
Bhattacharya, U., Daouk, H. & Welker, M.. (2002). The world price of earnings opacity. The Accounting Review, 78, 641-678. Bruns, W. & Merchant, K.. (1990). The dangerous morality of managing earnings. Management Accounting, 72, 22-25.
Bushee, B.. (1998). The influence of institutional investors on myopic R&D investment behavior. TheAccounting Review, 73(3), 305-333.
Bushman, R., Piotroski, J. & Smith, A.. (2004, May). What determines corporate transparency? Journal of Accounting Research, 42, 207-252.
Choi, J. H. & Wong, T. J.. (2002). Auditor choice and legal environments: an international investigation. Working paper, Hong Kong University of Science and Technology.
Claessens, S., Djankov, S., Fan, J., Lang, L.. (2001). Disentangling the incentive and earnings management. Working Paper. Cornell University, 2006.
Dechow, P. M., Huson, M. & Sloan, R.. (1994). The effect of restructuring charges on executives’ cash compensation. The Accounting Review, 69(1), 138-156.
Dechow, P. M. & Sloan, R.. (1991). Executive incentives and the horizon problem: An empirical investigation. Journal of Accounting and Economics, 14(1), 51-89.
Dechow, P. M. & Skinner, D. J.. (2000). Earnings management: Reconciling the views of accounting academics, practitioners and regulators. Accounting Horizons, 14, 235-250.
Dechow, P. M., Sloan, R. & Sweeney, A.. (1996). Causes and consequences of earnings manipulation: An analysis of firms subject to enforcement actions by the SEC. ContemporaryAccounting Research,13, 1-36.
DeFond, M. L. & Park, C.. (2001, July). The reversal of abnormal accruals and the market valuation of earnings surprises. The Accounting Review, 76, 375-404.
Dyck, A. & Zingales, L.. (2002). Private benefits of control: An international comparison. Unpublished NBER working paper (8711).
Graham, J. R., Harvey, C. R. & Rajgopal, S.. (2005). The economic implications of corporate financial reporting. Journal of Accounting and Economics, 40, 3-73.
Hart, O.. (1995). Firms, contracts, and financial structure. London: Oxford University Press.
Healy, P.. (1985). The effect of bonus schemes on accounting decisions. Journal of Accounting and Economics, 7 (1-3), 85-107. Healy, P. M. & Wahlen, J. M.. (1999). A review of the earnings management literature and its implications for standard setting.
Accounting Horizons, 13, 365-383.
Hribar, P. & Collins, D.. (2002). Errors in estimating accruals: Implications for empirical research. Journal of Accounting Review, 40
(1), 105-134.
Hribar, P. & Nichols, D. C.. (2006). The use of unsigned earnings quality measures in tests of earnings management. Working paper. Cornell University.
Does investor protection affect the choice of earnings management methods through real activity manipulation and accrual manipulation? Asian comparison
La Porta, R., Lopez-de-Silanes, F., Shleifer, A. & Vishny, R.. (1998, December). Law and finance. Journal of Political Economy,
106(6), 1113-1155.
La Porta, R., Lopez-de-Silanes, F., Shleifer, A. & Vishny, R.. (2000, January). Investor protection and corporate governance. Journal of Financial Economics, 58, 3-27.
Leuz, C., Nanda, D. & Wysocki., D. P.. (2003). Earnings management and investor protection: An international comparison. Journal of Financial Economics, 69(3), 505-527.
McNichols, M. & Wilson, G.. (1988). Evidence of earnings management from the provision for bad debts. Journal of Accounting Research, 26 (Supplement), 1-31.
Meuwissen, R., Moers, F., Peek, E. & Vanstraelen, A.. (2005). An evaluation of abnormal accruals measurement models in an
international context. Working paper, University of Maastricht and University of Antwerp. Retrieved from
http://papers.ssrn.com/sol3/papers.cfm?abstract_id=442681.
Nenova, T.. (2000). The value of corporate votes and control benefits: A cross-country analysis. Unpublished working paper. Havard University.
Phillips, J., Pincus, M. & Rego, S.. (2003). Earnings management: New evidence based on deferred tax expense. The Accounting Review, 78(2), 491-521.
Rangan, S.. (1998). Earnings management and the performance of seasoned equity offerings. Journal of Financial Economics, 50(1), 101-122.
Roychowdhury, S.. (2006). Earning management through real activities manipulation. Journal of Accounting & Economic, 42, 335-370.
Saudagaran, S. M. & Diga, J. G.. (2000). The institutional environment of financial reporting regulation in ASEAN. The International Journal of Accounting, 35, 1-26.
Shleifer, A. & Vishny, R.. (1997). A survey of corporate governance. Journal of Finance, 52, 737-783.
Teoh, S. H., Welch, I. & Wong T.. (1998a). Earnings management and the long-run underperformance of seasoned equity offerings.
Journal of Financial Economics, 50(1), 63-99.
Teoh, S., Welch, I. & Wong, T.. (1998b). Earnings management and the long-run underperformance of initial public offerings.
Journal of Finance, 53, 1935-1974.
Wysocki, P.. (2004, May). Discussion of ultimate ownership, income management, and legal and extra-legal institutions. Journal of Accounting Research, 42, 463-474.
Zingales, L.. (1994). The value of the voting right: A study of the Milan Stocks exchange experience. Review of Financial Studies,
7(1), 1250-148.
June 2010, Vol.6, No.6 (Serial No.61) Journal of Modern Accounting and Auditing, ISSN 1548-6583, USA
14
How selected primary schools in rural New Zealand manage their
financial resources of limited government funding in order to effectively
meet their schools objectives
Crabtree Jen, France Adrian
(School of Business, Waikato Institute of Technology, Hamilton 3240, New Zealand)
Abstract: This study evaluates the extent to which primary schools in a region of New Zealand are
challenged by limited funds to enable the effective management and performance of their school. The study
involved interviews with school principals and analysis of their schools’ financial statements. The aim of this
project is to gain a current understanding of the issues and challenges facing primary schools in a defined region
(Waikato) to see whether the trends identified in national research studies, confirms the problem that schools are
underfunded. The results of the current study identified the issues experienced by the Waikato schools and in most
cases supported previous research findings. The findings of the current study also suggest that schools share the
dilemmas associated with limited government funding and rely significantly on local funding sources to achieve
their basic objectives. Although schools may be effective in the management of their school objectives, there is
more government funding required to relieve the pressures and challenges.
Key words: schools; budgets; funding; management; finance
1. Introduction
Since the decentralization of school management from the introduction of tomorrow’s schools (1989) there
has been much recent discussion about how schools are underfunded by the government. How do primary schools
deal with the challenges that arise as a result of limited government funding to enable the effective management
and performance of their school?
A number of New Zealand research studies about how schools manage their finances have been undertaken
in recent years. For instance Wylie (2007a, 2007b), on behalf of the NZ Council for Education Research, has
discussed her findings and identified pressure points facing schools in their financial management. The most
underlying aspect of the studies showed that underfunding of schools was a paramount concern facing
stakeholders in school education.
2. Literature review
Crabtree Jen, School of Business, Waikato Institute of Technology New Zealand; research fields: management and organization of public schools.
How selected primary schools in rural New Zealand manage their financial resources of limited government funding in order to effectively meet their schools objectives
Over the last 20 years, the effects of the tomorrows schools reforms have played out their part in how schools
manage the financial constraints imposed and how they have dealt with them (O’Neill, 1998). During 1990 to
1997 studies were conducted on the application of government funding of schools and what was happening with
that funding. There was a decline in government funding that did not cover the additional costs of administrative
workload. A trend emerged of a rise in parental expenditure on children’s education and expenditure differences
between parents in professional occupations and others. There came to be what is known as the “user pays” system that reinforced the institutionalized comparisons between those who were well-off and those who were not.
Schools were split into decile groups of which lower decile schools were limited by their parent’s capacity to
donate and contribute, while higher decile schools had a greater capacity of parents to spend (O’Neill, 1998).
With the introduction of the New Public Financial Management procedures in the 1990s, the reforms’ impact
on the NZ education system meant that education providers had to be more responsive and accountable for the
efficient and effective use of their resources (ERO, 1994; Picot Report, 1988; Tooley & Guthrie, 2003). How
schools were actually behaving in response to those reforms was evaluated in a study by Tooley and Guthrie
(2003) that identified aspects of schools’ budgeting systems and decision-making practices. That study identified
issues of lack of funding, changing roles of principals from leadership to managerial roles, and the notion of
school’s budgeting philosophy of “running an operating deficit to let government know we are not getting enough money” (Tooley & Guthrie, 2003).
In the last five years an issue in education research has been how effective schools were managing their
finances. An important finding of the studies conducted in 2004 found that although schools were effective, this
was dependent on the hard work, dedicated staff and expertise available through boards and financial and property
advisors (Wylie & King, 2004). Schools were becoming dependent on funds, they were able to raise from local
fundraising and this became far more prevalent since decentralization of schools.
Financial pressure points that impacted negatively on a school’s performance included: the affordability of
good support staff, employment and/or retention of good quality teachers, ICT, property maintenance, depreciation costs and allowing for teacher non-contact time (Wylie & King, 2005).
While government funding of schools had increased compared to previous years, the increase was not
enough to keep up with CPI increases. Furthermore, higher decile schools were found to be relying more heavily
on parental funding such as donations, increased school fees more so than before. What was also significant was
that a new trend began to develop–parents were becoming reluctant in paying voluntary donations (Wyle & King,
2005).
The Education Review Office (ERO, 2006) released a report on its investigation into how schools used their
operational funding. Patterns of income and expenditure and the processes used by schools to manage their
operations grant and sources of income were evaluated by the ERO. The study found that the ways schools used their government funding was influenced by a number of factors. These factors included the amount of local
fundraising they generated, the overheads associated with running their school, the community expectations, the
financial and strategic capability to which the schools have access and the amount of TFEA (Targeted Funding for
Educational Achievement) they received as part of their operations grant. Some schools that were medium and
high decile in the evaluation were dependent on locally raised funds for their day-to-day operation, whereas low
decile schools received additional funding through the TFEA system.
How selected primary schools in rural New Zealand manage their financial resources of limited government funding in order to effectively meet their schools objectives
16
financial decisions (ERO, 2007). The report identified examples of good practice that schools implemented and
also identified the challenges and risks that schools faced and ways to manage those risks.
Wylie (2007a) published her findings of surveys conducted with primary and intermediate schools about
funding issues facing schools. Funding was still a major issue for principals in schools (Wylie, 2007b). Primary
schools were largely positive places with an interest in continuously developing their practice to meet children’s
needs. The schools had benefited from recent support from the Ministry of Education in the way of professional development, curriculum and assessment resources. What was also apparent was that self-managing schools need
continual support to sustain their gains and the workload, funding and staffing issues that have been increasingly
evident in the surveys will not go away unless some new approaches are taken in what is being asked of schools
(Wylie, 2007a).
3. The current situation
The current study investigates how selected types of primary schools in the Central Waikato region managed
their financial resources in order to meet their school’s objectives. This study also aims to assess the extent
primary schools are underfunded by government, and what they do to ensure the effective management of their
school. Finally, this current study investigated the issues actually facing selected primary schools in the Waikato
region and compared these to issues identified in previous research studies.
4. Method
For this research project, full primary school principals in the Waikato region were selected as respondents.
Each was invited to participate in a semi-structured interview with the researcher. The schools selection process in this current study was based on three main criteria.
The first criterion was based on the school’s decile rating. The decile rating is an indicator of the
socio-economic status (10 being high, and 1 being low) of the school’s local community. The Ministry of
Education determines each school’s decile rating based on a rating system for school funding purposes. Schools in
decile one have the highest proportion of students from low socio-economic background while schools in decile
ten have the lowest proportion of these students.
The second criterion for selecting schools was based on their school type. School types for primary schools
include contributing primary (Year 1-6) or full primary (i.e., includes intermediate level) (Year 1-8). For the
purpose of this study, only full primary schools were selected.
The third criterion was based on the authority type of the school. This refers to state, state integrated (special
character) and private schools. The authority type of school chosen for this research project was restricted to either
a state or state integrated schools. Both these types of schools teach the New Zealand curriculum, are
co-educational and receive the same government funding. However the distinguishing difference between the two
is that the state integrated schools have a special character (religious or philosophical belief) as part of their school
programme and does not receive government funding to resource capital works/expenditure relating to the
school’s land and buildings. These assets are privately owned (i.e., by the Catholic Bishop of each diocese who is
the proprietor of the land and buildings). Furthermore, these schools charge attendance dues (a legal requirement
How selected primary schools in rural New Zealand manage their financial resources of limited government funding in order to effectively meet their schools objectives
that school.
The source for selecting the sample schools was obtained from the Ministry of Education website, “Decile
2008 list of all schools in NZ”. This list was then refined to include only full primary, state or state integrated
schools in the Waikato Region. Six participant schools were to participate in the study, with at least two schools
representing in each of the three main decile groupings (low, medium, high). These three ranges are considered
typical ERO/Ministry ranking descriptors for all schools whereby low includes deciles 1-3, medium includes deciles 4-7 and high includes deciles 8-10. In addition, it was decided to select all sample schools based on a
similar roll size so that the results could be compared accurately. Roll size is also determined by ERO/Ministry
guidelines and refers to the numbers of students in the school during a given year. Small rolls are 0-150 students,
medium are 151-300 students, and large referring to 301+ students for primary schools. For this research study, a
medium roll size school from the sample of candidates was chosen to represent typical schools. The method
chosen for selecting the final respondents was based on “non-probability convenience sampling”–schools were
chosen from the sample based on their location within Hamilton city and close surrounding.
Of the eight schools invited, four accepted the invitation, two declined and two failed to respond because of a
tight timeframe for completing the research fieldwork. The acceptance rate of 50% was considered reasonable.
To maintain confidentiality of the participant schools, the identities of the schools have been disguised using pseudonyms. Their general descriptions are outlined in Table 1.
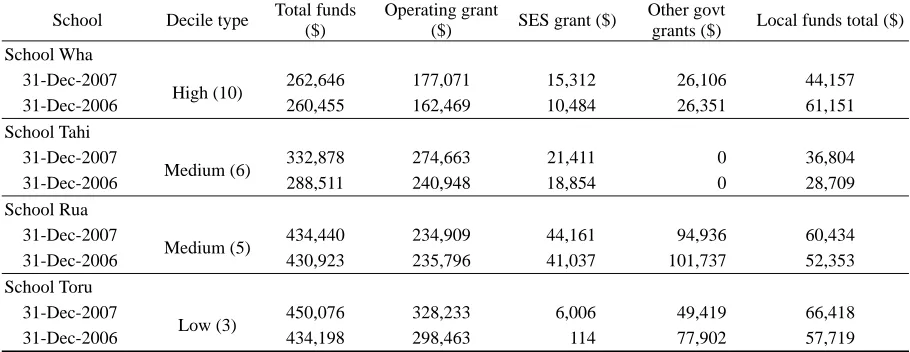
Table 1 School participant characteristics
School Decile grouping Decile rating Roll size Authority and school type Location
Tahi Medium 6 289 State, full primary Rural
Rua Medium 5 265 State integrated, full primary Urban
Toru Low 3 247 State, full primary Urban
Wha High 10 206 State, full primary Rural
In addition to the interview data, the annual reports and financial statements relating to the two preceding
years (December 31, 2006 and 2007) were obtained from each school. Selected financial data from those reports
were analysed to report on any similarities or differences between the schools’ funding sources and to provide
quantitative data to support the principals verbal comments made during the interviews.
5. Results
The following results are presented in four main themes, school objectives, budget process and
decision-making, local funding sources, and pressures, constraints and challenges.
5.1 School objectives
Most schools had “raising the levels of academic achievement of their students” as their primary objective,
with many identifying a focus on literacy, numeracy and ICT. However, the low decile school in this study described its objectives a differently as “to nurture and grow quality learning for the whole family (not just the
students)”.
Challenges to achieving their objectives were very similar for three schools, with most describing the lack of
financial resources or funding as the main challenge. However, the low decile school did not see the lack of
How selected primary schools in rural New Zealand manage their financial resources of limited government funding in order to effectively meet their schools objectives
18
In addition, three schools had similar methods of measuring and reporting on their objectives to the relevant
community through regular reviews and monitoring of their student assessment data and reporting these to the
board on a monthly basis. The low decile school described how their objectives were being met from a different
perspective however, by using feedback received from ‘external parties’ as an indicator of the school doing an
effective job in meeting its objectives.
5.2 Budgets and decision-making
Three of the schools used similar processes in developing their budgets each year. This involved using an
“historical approach” to setting budgets. Working from base-line data of the previous year’s actual figures
reported in that budget. The principal and finance person (usually on the school board) were involved in the
setting of the draft budgets before the end of December each year. These drafts were then presented for Board
approval in the first meeting usually held in February the following year. All had consulted with various teachers
and/or curriculum leaders and/or PTA committees in setting their estimated revenues and costs, and the final
decisions were then made by the Principal prior to recommending to the Board.
The low decile school had a slightly different approach in that it did not use an “historical approach”, but
instead described theirs as a “needs analysis” approach in formulating its budgets. Consultation was made with
several groups prior to setting the draft budget, and this commenced as early as October that year. Their approach was a “whole school approach” seeking input from teachers, support staff, board, parents, their accounting
services provider and auditor when drafting the budgets.
When setting revenue sources for the budgets, the Operations Grant was mostly predictable, other sources
such as PTA fundraising, community grants or fundraising activities and parent donations were also reasonably
determinable based on actual intended activities planned for the following year. These activities were usually in
line with the school’s priorities or targets for expenditure planned for that year. Some of the schools would
underestimate their “base line funding” from the Operations Grant, by lowering the student rate to allow for a
contingency buffer for other unplanned events or planned activities – this approach was taken by the high and low decile schools.
When setting costs for the year, fixed costs were relatively determinable based on previous years actual
(current year) or budgeted figures, with some schools adding 2-3% to allow for unexpected increases in those
costs. However the low decile school looked at this further by taking a “stock-take” of actual costs last year,
physical resources (impairment) and professional development needs required for the following year. Again, costs
were taken on a “needs analysis” basis and looked at what was needed, or what outgoings could be saved on
without compromising quality.
When determining priorities in the budget, most schools had particular areas in the curriculum they planned
to fund in the following year, with a notable trend of professional development being a focus for achieving the curriculum objectives.
5.2.1 Planned deficit or surplus
When setting the budgets for the previous years, schools were asked whether they had planned for a deficit or
surplus for that year. A review of the school’s financial statements for the past two years showed all three schools
under estimated the surplus and the low decile school over estimated the surplus.
5.2.2 Working capital surplus or reserves
How selected primary schools in rural New Zealand manage their financial resources of limited government funding in order to effectively meet their schools objectives
recommends schools allow for 10% of their funds for this purpose. Many of the schools tended to budget for a
higher percentage. Some of the schools used the reserve as a contingency fund or “cushion” for unexpected events,
emergencies or to see them through “stretched cashflow periods” during the year. Some schools would also use
these reserves for future planned projects involving significant capital expenditure–e.g. building plans, new
furniture or equipment. The low decile school also used this reserve for “start up capital” when investing in future
“sustainable projects” for their local fundraising.
5.3 Local funding sources
The third theme of this study focused on what local funding sources each school received to determine how
much reliance or support was needed from this funding source to assist the school to meet its objectives. Data
obtained from the interviews and financial data obtained from the schools annual financial statements were
analysed to provide these results.
Table 2 Summary of total funding sources received
School Decile type Total funds ($)
Operating grant
($) SES grant ($)
Other govt
grants ($) Local funds total ($) School Wha
31-Dec-2007
High (10) 262,646 177,071 15,312 26,106 44,157
31-Dec-2006 260,455 162,469 10,484 26,351 61,151
School Tahi 31-Dec-2007
Medium (6) 332,878 274,663 21,411 0 36,804
31-Dec-2006 288,511 240,948 18,854 0 28,709
School Rua 31-Dec-2007
Medium (5) 434,440 234,909 44,161 94,936 60,434
31-Dec-2006 430,923 235,796 41,037 101,737 52,353
School Toru 31-Dec-2007
Low (3) 450,076 328,233 6,006 49,419 66,418
31-Dec-2006 434,198 298,463 114 77,902 57,719
Table 3 Summary of local funding sources
School Local funds net surplus ($)
Percent of local funds to total funds
(%)
Parent donations ($)
Percent of parent donations to total funds
(%)
Total percent of local funds to total funds (%)
School Wha
31-Dec-2007 30,290 16.7 13,867 5.2 21.9
31-Dec-2006 43,918 16.8 17,232 6.6 23.4
School Tahi
31-Dec-2007 30,777 9.2 6,027 1.8 11.0
31-Dec-2006 26,440 9.1 2,269 0.7 9.9
School Rua
31-Dec-2007 60,434 13.9 0 0 13.9
31-Dec-2006 52,353 12.1 0 0 12.1
School Toru #
31-Dec-2007 66,418 # 14.7 0 0 14.7
31-Dec-2006 57,719 # 13.2 0 0 13.2
Note: # Local Funds income includes net income received from International Students-2007 $31,316 (47%); 2006 $19,343 (33%).
How selected primary schools in rural New Zealand manage their financial resources of limited government funding in order to effectively meet their schools objectives
20
government grants and local funds. The grants represent government operating funds but exclude grants for
teacher salaries, which are reported as a separate figure in the financial statements. The local funds represent the
combined total of parent donations, community grants, and net surplus from fundraising or trading activities. A
further breakdown of the local funds is provided in Table 3.
5.3.1 Parent donations
Only two of the schools set a parent donation in their school–the high (School Wha) and one medium (School Tahi) decile school. School Rua stated they had not set a parent donation in previous years, but were
looking at introducing it for the following 2009 year. School Toru does not charge its parents donations rather they
rely on parents to provide contributions by way of manual labor (e.g., painting fences–or their other fundraising
activities).
School Wha had an 80% collection rate of parent donations, though this rate has declined recently. The
principal commented that although their donation “fee per student” has increased over the years and also there has
been an increase in the school roll numbers, he has noticed a reluctance in some parents paying the
donations–“parents are more reluctant to pay a donation when they know they are not legally required to–it is
widely publicised that it is a donation”. “There’s a little bit of resistance in that parents see they are paying taxes
for education (supposedly free education) so why should they pay any more”.
Principal of school Wha stated that he considers the school has a successful collection rate with parent
donations compared with other schools in the area (low-high deciles). He suggests this is most likely due to their
donation rates ($125 per child) being much lower than what decile 10 schools in Auckland charge ($300 per child).
But he does recognize across the board (Decile 1-10) that their school donation rate is quite high compared to
other schools in their location.
School Tahi was not aware of any trends with its collection rate for donations–he “did not consider it a
priority”.
From Table 3, parent donations for the high decile school represent 5% of the Total Operating Revenue, while for the medium decile school it only represents under 2% of total revenue.
5.3.2 Community grants
It was noted that these funds were not identified separately in the financial statements for all of the schools,
suggesting these funds have been included under fundraising sources. All the schools did receive some form of
community or charitable trust grant in previous years. It was interesting in that the School Tahi (medium) and
School Wha (high) received only one grant for a targeted resource–pool cover or books. These two schools found
that applications for grants were not always successful, and although each school had a person dealing with the
applications (school secretary or PTA person) they were looking at refocusing their expertise in this area by
harnessing support from parents who had some expertise in the applications process as well as tightening up on their “financial reporting data” t