sensors
ISSN 1424-8220 www.mdpi.com/journal/sensors ArticleApplication of V
2O
5/WO
3/TiO
2for Resistive-Type SO
2Sensors
Noriya Izu 1,2, Gunter Hagen 1, Daniela Schönauer 1, Ulla Röder-Roith 1 and Ralf Moos 1,* 1
Functional Materials Laboratory, University of Bayreuth, Universitätsstraße 30, 95440 Bayreuth, Germany; E-Mails: [email protected] (N.I.); [email protected] (G.H.); [email protected] (D.S.); [email protected] (U.R.-R.)
2
National Institute of Advanced Industrial Science and Technology (AIST), Advanced Manufacturing Research Institute, 2266-98 Anagahora, Shimo-Shidami, Moriyama-ku, Nagoya 463-8560, Japan * Author to whom correspondence should be addressed; E-Mails: [email protected];
[email protected]; Tel.: +49-921-55-7401; Fax: +49-921-55-7405. Received: 11 February 2011; in revised form: 1 March 2011 / Accepted: 3 March 2011 / Published: 7 March 2011
Abstract: A study on the application of V2O5/WO3/TiO2 (VWT) as the sensitive material for resistive-type SO2 sensor was conducted, based on the fact that VWT is a well-known catalyst material for good selective catalytic nitrogen oxide reduction with a proven excellent durability in exhaust gases. The sensors fabricated in this study are planar ones with interdigitated electrodes of Au or Pt. The vanadium content of the utilized VWT is 1.5 or 3.0 wt%. The resistance of VWT decreases with an increasing SO2 concentration in the range from 20 ppm to 5,000 ppm. The best sensor response to SO2 occurs at 400 °C using Au electrodes. The sensor response value is independent on the amount of added vanadium but dependent on the electrode materials at 400 °C. These results are discussed and a sensing mechanism is discussed.
Keywords: sulfur dioxide; selective catalytic reduction (SCR); gas sensor; vanadia tungsten titania
1. Introduction
The cost of coal is about 1/6 that of oil and natural gas. Therefore, it is predicted that coal consumption will increase by 2.5% per year between 2003 to 2030 [1]. Coal, however, faces significant environmental challenges, since exhaust gas from coal combustion contains limited emission substances such as SO2, NOx, etc. [1]. For instance, the exhaust gas from coal-fired kilns includes 300–500 ppm of SO2, and flue gases or stack gas include 500–4,000 ppm and 5–10 % of SO2, respectively [2].
For SO2 monitoring and control, SO2 sensors with a good durability at high SO2 concentrations and at high temperatures are needed. Due to the stability requirements, we focused on sensors based on V2O5/WO3/TiO2 (abbreviated VWT), because VWT is a well-known material for selective NOx catalytic reduction catalysts using ammonia as a reducing agent (NH3-SCR) [3-5]. It is applied, for instance, for NOx removal in coal power plants or for DeNOx processes in diesel exhausts. VWT shows a good stability in sulfur oxide-rich combustion exhausts [5]. It has already been suggested as a sensor material for ammonia sensing purposes in exhausts [6-8].
There are only a few papers reporting on SO2 sensors utilizing V2O5/TiO2 (without WO3) [9,10] and there is no paper that involves VWT as an SO2 sensitive material, although there are many papers about SO2 oxidation of VWT in SCR catalysts [11-16]. Morris and Egdell reported on a resistive bulk-type sensor of small V2O5-TiO2 bars with Pt electrodes [10]. In contrast, in our study, we realized a planar setup for our resistive sensors and VWT with a V2O5 concentration of 1.5 wt% and 3.0 wt% served as the sensitive functional material. We varied the electrode materials between Pt and Au and measured the resistance changes when exposed to SO2 and/or other gases. Unexpectedly, it was found out that for the SO2 response the electrode materials play a more crucial role than the vanadium concentration. Furthermore, we discuss the sensing mechanism in this study. It should be noted here that the major objective of this study is to investigate whether commercially available and proven long-term stable SCR catalyst materials are suitable as materials for resistive SO2 sensors. Material development is not a subject of this study.
2. Experimental
Typical alumina substrates for thick-film technique (96% Al2O3) were prepared. On the front side of the alumina substrate, Pt or Au interdigital electrodes with a line and space definition of 100 m were screen-printed and fired, and a platinum heater was screen-printed on the reverse side and fired. Then, the sensor layers were fabricated. V2O5/WO3/TiO2 (VWT) was used as a sensing material. VWT powders were supplied by Argillon GmbH. The V2O5 concentration was 1.5 or 3.0 wt% and the WO3 concentration was ca. 8–10 wt%. In this study, x%VWT is an abbreviation that stands for the composition x wt% V2O5/8–10 wt% WO3/TiO2, in which x is 1.5 or 3.0. The VWT powders were mixed with an organic binder to prepare pastes suitable for screen-printing. Afterwards, the pastes were screen-printed on the alumina substrates with the electrodes and fired at 700 °C for 20 min. The VWT powder or layer was characterized by scanning electron microscopy (SEM, Leo1450VP), powder X-ray diffraction (PANalytical X’Pert Pro, Cu Kα radiation), and contact probe profilometer (MarSurf). The thickness of VWT layers is in the range of 10–15 µm.
infrared pyrometer. By this method, the sensing element is heated correctly without the influence of gas flow ratio.
To investigate its sensing properties, the sensor devices were placed into a test chamber with an angle of incidence parallel to the gas flow. The resistance between the electrodes (i.e., the sensor output), was measured by a two-wire-method with a digital multimeter (Keithley 2700 series). The total gas flow amounted to either 1 or 5 L/min. We confirmed that the sensor resistance in base gas was independent of the total gas flow rate. Compressed air was used as a base gas to measure the response to SO2, while a gas mixture of 20% O2 and N2 was used in the case of the response measurements towards other gases like CO, CO2, C3H8, H2O, H2, NO, and NH3. The water concentration of the compressed air was checked by FTIR to be below 0.5%. Since the other gases are supplied from gas cylinders, the water concentration of them is less than 0.1%. We defined the response value (S) in accordance to Equation (1):
S = (R0− R) / R0 (1)
where R0 denotes the resistance measured in base gas and R denotes the resistance in presence of the analyte.
3. Results and Discussion
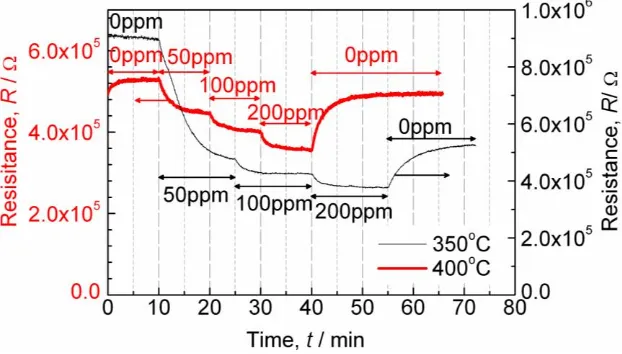
The powder X-ray diffraction revealed that titanium oxide exists in our VWT as an anatase phase, even after annealing at 700 °C. The thick-films have a porous structure. First of all, the sensor resistance response towards SO2 was investigated. As a base gas, compressed air was used, so that a small amount of water vapor was included in the gas. Figure 1 shows a typical sensor response behavior for a sensor of 3.0%VWT and Au electrodes when SO2 is added.
Figure 1. Typical behavior of the sensor resistance when SO2 is added stepwise to the base gas. Sensor: 3.0%VWT; Au electrodes; further details see text; T = 350 °C and T = 400 °C.
considered as almost constant with time at 400 °C or more. In that case, the initial values in the base gas were used as R0. At 350 °C, however, the resistance decreased largely when 50 ppm SO2 was added. After switching back to SO2-free base gas, the resistance did not return to its initial value. That is to say, a base line shift was observed. Therefore, at 350 °C the resistance in the base gas after SO2-exposure was used as R0.
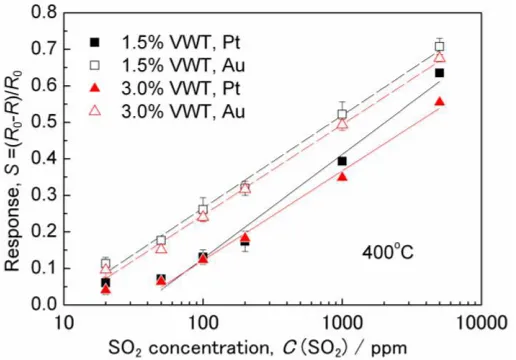
Figure 2 shows the relationship between the sensor response value, S, and the SO2 concentration. The ordinate is plotted in a linear scale, whereas a logarithm scale is used for the SO2 concentration on the abscissa. The response value, S, increases with the SO2 concentration for all samples. The responses values for sensors with Au electrodes are larger than those for sensors with Pt electrodes. The responses are at a first order independent on the amount of added V2O5. For the sensors with Au electrodes, a linear relationship (in a semilogarithmic representation) can be observed in an SO2 concentration range from 20 to 5,000 ppm. At low SO2 concentrations, the response values with Pt electrodes do not depend on the SO2 concentration anymore.
Figure 2. Relationship between the response value, S, of the sensor resistance and the SO2 concentration at T = 400 °C.
Different graphs like log S vs. log c(SO2), log (R/R0) vs. log c(SO2), R0/R vs. log c(SO2), log (R0/R) vs. log c(SO2), and R0/R vs. c(SO2) were plotted using the data of Figure 2. However, none of the graphs yielded a linear relationship. This agrees with findings of Morris and Egdell, who reported a non-linear relationship of S vs. c(SO2) [10]. We re-plotted their data on an S vs. log c(SO2) graph and found also a linear relationship between S and log c(SO2). Hence, the data obtained from our planar sensor setup are consistent with reference [10]. Up to now, we have not been able to clarify the physico-chemical reason for the linear relationship in the S vs. log c(SO2) graph, but the finding of a linear relationship could be useful for practical sensor applications.
V2O5 content, but dependent on the electrode materials at 350 and 400 °C, the temperature range in which the sensors respond strongly, especially with Au electrodes. Therefore, the interface between VWT and the electrodes seems to be important for the response towards SO2.
Figure 3. Relationship between the response value, S, of the sensor resistance to 200 ppm SO2 and the operating temperature.
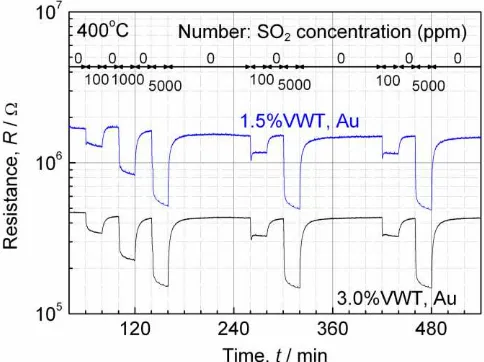
The reproducibility was investigated for the sensors at 400 °C. The error bars in Figure 2 show the standard deviation of the data. In 100 ppm SO2, the coefficient of variation (CV), which is defined as the ratio of the standard deviation to the mean, of ―S‖ was calculated. The CV for the sensor with Au electrodes and 3.0%VWT is 5% and the CVs for the others are 12–15%. Figure 4 shows the sensor resistance, when sensors with Au electrodes are repeatedly exposed to varying SO2 concentrations of 100 ppm and 5,000 ppm. Although the base line decreases 10% at first, it does not change after 200 min in Figure 4 (within the difference of about 5%). This result indicates that aging processes may be effective for stabilizing the base line. However, the responses to repeated SO2 pulses were almost identical (Figure 4). These results confirm the reproducibility. Furthermore, we also confirmed the process reproducibility by checking the response of other sensors prepared with the same parameters.
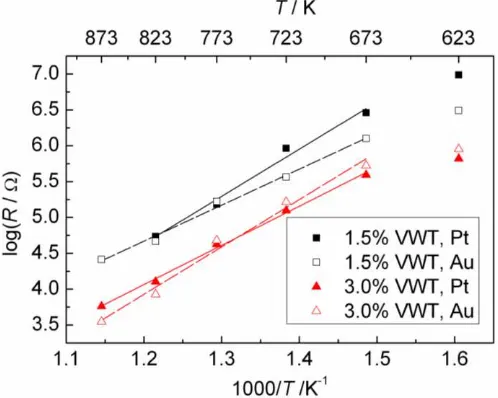
Figure 5 shows the relationship between the sensor resistance and the temperature in an Arrhenius-type representation. In order to determine the resistivity or the conductivity, the film thickness and the porosity of each single thick film should be determined precisely. This is difficult to do with a sufficient accuracy. Therefore, we plotted only the resistance, R, and not the resistivity on the ordinate. The temperature dependency, however, should be the same. In Figure 5, the slope in the log R vs. 1/T —representation changes at around 400 °C, and the slope over 400 °C becomes larger. Reference [17] reported the resistances of 2%VWT in the range of 180 °C to 300 °C. The activation energy calculated from their data is approximately 0.7 eV, which is smaller than the one here-determined (ca. 1 to 1.3 eV) over 400 °C. Therefore, the slope under 400 °C is expected to be less than 1 eV, if the measurement is carried out in the range of 180 °C to 300 °C. The changing slope around 400 °C might indicate that the mechanism of the electrical conductivity varies at this temperature. This may be related to the maximum sensor response at around 400 °C.
Figure 5. Arrhenius-type representation of the sensor resistance in compressed air (without SO2).
Figure 6. Oxygen concentration dependence of the sensor resistance at T = 400 °C.
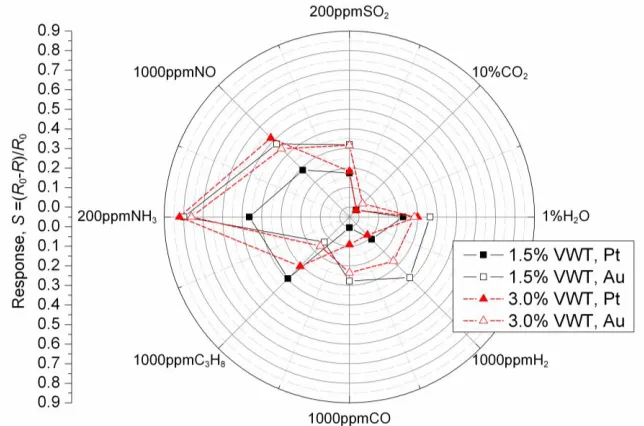
Figure 7 summarizes the sensor response values towards various gases in a radar plot. The base gas used in this experiment was 20% O2 in N2. Again, the gas composition was mixed with mass flow controllers from O2 and N2 supplied from gas cylinders. Therefore, the water vapor concentration in the mixture was much smaller (almost zero) than that in compressed air.
Figure 7. Responses against to the various gases at T = 400 °C.
1,000 ppm CO is larger than that for 1,000 ppm C3H8, while the response value for 1,000 ppm CO is smaller than that for 1,000 ppm C3H8 in the case of Pt electrodes. Although the sensors investigated in this study respond markedly to NH3, the application may be restricted only for some cases. Especially when applied in a coal combustion exhaust, almost no ammonia is present. However, NO might be a more critical component, which need to be compensated or removed by a filter; some zeolites may be a good material for that purpose [19]. With the exception of NO, the selectivity should be high enough for a practical application of the VWT-based sensor for SO2 monitoring or controlling purposes.
In this section, the SO2 sensing mechanism is discussed in the light of the above-presented results and some selected literature from both the sensor and the catalysis community. It should be annotated here that our proposed model is just a suggestion, but is supported by the literature of both scientific communities. Dunn et al. [20] proposed a mechanism for sulfur dioxide oxidation over solid vanadia catalyst. Based on it, we suggest the sensor to behave as the following: SO2 oxidation to SO3 occurs on V2O5. In parallel, the valence of the V5+ ions change to V3+ [20]:
SO2 + V5+ -O- ↔ SO3 + V3+ (2)
In Equation 2, -O- denotes oxide ions in vanadium-oxygen-support bond [20]. In the next step, V3+ ions react either with oxygen molecules (½ O2(g)) or with adsorbed oxygen species on the surface vacancies [21] or interstitial Ti ions, which according to [22], are not completely ionized. However, for the discussion of the sensing mechanism, this question is secondary, since the formation of both defects in TiO2 lead to a simultaneous formation of mobile electrons [17,21,22]. Due to this electron density increase, the resistance decreases.
Oxygen ions (O-ads) adsorb on the surface of WO3 [23]. Then, when O-ads on the surface of WO3 moves to vanadium oxide according to Equation 5, a conduction electron forms:
O-ads↔ Oads+ e’ (5)
Although it is assumed that SO2 is oxidized on vanadium oxide as discussed above, it is possible to assume that the following reactions occur: SO2 reduces TiO2 directly and/or SO2 reacts with adsorbed oxide ions (O-ads) on WO3. Furthermore, at 450 °C and 500 °C, S seems to be only slightly affected by the electrode materials. In this temperature range, different reactions may occur. Unfortunately, the literature considers VWT especially due to its catalytic properties. It has therefore a strong focus on lower temperature, at which the SCR reactions predominate. The high temperature range is often neglected since it is not of high interest for NOx removal applications. Therefore, in future work, the detailed sensing mechanism should be investigated by other experiments and analyses, with a special focus of temperatures of 400 °C or more.
4. Conclusions
Planar resistive SO2 sensors based on VWT as a sensitive functional material that is very stable in exhausts were manufactured and their sensing properties were investigated in this study. The obtained results are as follows: the resistance of VWT decreases with increasing SO2 concentration. The relationship between the response value (S = (R0− R)/R0) and SO2 concentration is linear in a representation of S vs. the logarithm of the SO2 concentration. The best response value occurs at 400 °C in the case of Au electrodes. The response value does hardly depend on the vanadium content but strongly on the electrode materials at 400 °C. From these results, some sensing mechanisms were discussed. From an application point of view, the selectivity needs to be improved in the future, especially with respect to nitrogen oxides. An optimization of the electrode materials or an addition of noble metal particles on the VWT surface may be an appropriate solution, besides the application of filter layers. An optimization of WO3 concentration may be considered as well.
References
1. Powell, C.A.; Morreale, B.D. Materials challenges in advanced coal conversion technologies. MRS Bull. 2008, 33, 309-315.
2. Bhoga, S.S.; Singh, K. Electrochemical solid state gas sensors: An overview. Ionics 2007, 13, 417-427.
3. Busca, G.; Lietti, L.; Ramis, G.; Berti, F. Chemical and mechanistic aspects of the selective catalytic reduction of NOx by ammonia over oxide catalysts: A review. Appl. Catal. B 1998, 18, 1-36.
4. Forzatti, P. Present status and perspectives in de-NOx SCR catalysis. Appl. Catal. A 2001, 222, 221-236.
5. Casanova, M.; Rocchini, E.; Trovarelli, A.; Schermanz, K.; Begsteiger, I. High-temperature stability of V2O5/TiO2-WO3-SiO2 SCR catalysts modified with rare-earths. J. Alloy. Comp. 2006, 408, 1108-1112.
6. Schönauer, D.; Wiesner, K.; Fleischer, M.; Moos, R. Selective mixed potential ammonia exhaust gas sensor. Sens. Actuat. B 2009, 140, 585-590.
8. Moos, R. Catalysts as sensors—A promising novel approach in automotive exhaust gas aftertreatment. Sensors 2010, 10, 6783-6787.
9. Liang, X.S.; Zhong, T.G.; Quan, B.F.; Wang, B.; Guan, H.S. Solid-state potentiometric SO2 sensor combining NASICON with V2O5-doped TiO2 electrode. Sens. Actuat. B 2008, 134, 25-30. 10. Morris, D.; Egdell, R.G. Application of V-doped TiO2 as a sensor for detection of SO2. J. Mater.
Chem. 2001, 11, 3207-3210.
11. Chang, F.Y.; Chen, J.C.; Wey, M.Y.; Tsai, S.A. Effects of particulates, heavy metals and acid gas on the removals of NO and PAHs by V2O5-WO3 catalysts in waste incineration system. J. Hazard. Mater. 2009, 170, 239-246.
12. Forzatti, P.; Nova, I.; Beretta, A. Catalytic properties in deNO(x) and SO2-SO3 reactions. Catal. Today 2000, 56, 431-441.
13. Goo, J.H.; Irfan, M.F.; Kim, S.D.; Hong, S.C. Effects of NO2 and SO2 on selective catalytic reduction of nitrogen oxides by ammonia. Chemosphere 2007, 67, 718-723.
14. Kamata, H.; Ueno, S.; Naito, T.; Yukimura, A. Mercury oxidation over the V2O5(WO3)/TiO2 commercial SCR catalyst. Ind. Eng. Chem. Res. 2008, 47, 8136-8141.
15. Kobayashi, M.; Hagi, M. V2O5-WO3/TiO2-SiO2-SO42- catalysts: Influence of active components and supports on activities in the selective catalytic reduction of NO by NH3 and in the oxidation of SO2. Appl. Catal. B 2006, 63, 104-113.
16. Zheng, Y.J.; Jensen, A.D.; Johnsson, J.E. Deactivation of V2O5-WO3-TiO2SCR catalyst at a biomass-fired combined heat and power plant. Appl. Catal. B 2005, 60, 253-264.
17. Phil, H.H.; Reddy, M.P.; Kumar, P.A.; Ju, L.K.; Hyo, J.S. SO2 resistant antimony promoted V2O5/TiO2 catalyst for NH3-SCR of NOx at low temperatures. Appl. Catal. B 2008, 78, 301-308.
18. Schönauer, D.; Sichert, I.; Moos, R. Vanadia doped tungsten-titania SCR catalysts as functional materials for exhaust gas sensor applications. Sens. Actuat. B 2010, doi: 10.1016/j.snb.2010.11.046. 19. Sahner, K.; Schönauer, D.; Kuchinke, P.; Moos, R. Zeolite cover layer for selectivity
enhancement of p-type semiconducting hydrocarbon sensors. Sens. Actuat. B 2008, 133, 502-508. 20. Dunn, J.P.; Koppula, P.R.; Stenger, H.G.; Wachs, I.E. Oxidation of sulfur dioxide to sulfur
trioxide over supported vanadia catalysts. Appl. Catal. B 1998, 19, 103-117.
21. Mather, G.C.; Marques, F.M.B.; Frade, J.R. Detection mechanism of TiO2-based ceramic H2 sensors. J. Eur. Ceram. Soc. 1999, 19, 887-891.
22. Knauth, P.; Tuller, H.L. Solute segregation, electrical properties and defect thermodynamics of nanocrystalline TiO2 and CeO2. Solid State Ionics 2000, 136, 1215-1224.
23. Marquis, B.T.; Vetelino, J.F. A semiconducting metal oxide sensor array for the detection of NOx
and NH3. Sens. Actuat. B 2001, 77, 100-110.
24. Gerlich, A.; Kornely, S.; Fleischer, A.; Meixner, H.; Kassing, R. Selectivity enhancement of a WO3/TiO2 gas sensor by the use of a four-point electrode structure. Sens. Actuat. B 2003, 93, 503-508.