A THREE-STEP SPATIAL-TEMPORAL-SEMANTIC CLUSTERING METHOD FOR
HUMAN ACTIVITY PATTERN ANALYSIS
W. Huang a, S. Lia, *, S. Xu b, a
a Department of Civil Engineering, Ryerson University, Toronto, Canada - (wei1.huang, shinshuo.xu, snli)@ryerson.ca b School of Environment Science and Spatial Informatics, China University of Mining and Technology, Xuzhou, China
Commission II, ThS 12
KEY WORDS: Human Activity Pattern, Clustering, Twitter, Spatial, Temporal, Semantics
ABSTRACT:
How people move in cities and what they do in various locations at different times form human activity patterns. Human activity pattern plays a key role in in urban planning, traffic forecasting, public health and safety, emergency response, friend recommendation, and so on. Therefore, scholars from different fields, such as social science, geography, transportation, physics and computer science, have made great efforts in modelling and analysing human activity patterns or human mobility patterns. One of the essential tasks in such studies is to find the locations or places where individuals stay to perform some kind of activities before further activity pattern analysis.
In the era of Big Data, the emerging of social media along with wearable devices enables human activity data to be collected more easily and efficiently. Furthermore, the dimension of the accessible human activity data has been extended from two to three (space or space-time) to four dimensions (space, time and semantics). More specifically, not only a location and time that people stay and spend are collected, but also what people “say” for in a location at a time can be obtained. The characteristics of these datasets shed new light on the analysis of human mobility, where some of new methodologies should be accordingly developed to handle them.
Traditional methods such as neural networks, statistics and clustering have been applied to study human activity patterns using geosocial media data. Among them, clustering methods have been widely used to analyse spatiotemporal patterns. However, to our best knowledge, few of clustering algorithms are specifically developed for handling the datasets that contain spatial, temporal and semantic aspects all together. In this work, we propose a three-step human activity clustering method based on space, time and semantics to fill this gap. One-year Twitter data, posted in Toronto, Canada, is used to test the clustering-based method. The results show that the approximate 55% spatiotemporal clusters distributed in different locations can be eventually grouped as the same type of clusters with consideration of semantic aspect.
1. INTRODUCTION
A mechanistic understanding of human activity pattern can aid in contributing to a diversity of urban applications, such as urban planning, traffic forecasting, and epidemic prevention. Therefore, scholars from related fields, such as urban planning, transportation, epidemiological, and geographic information science (GIS), attempt to figure out human activity patterns within urban environment (Hanson, 2005; Alexander et al., 2015; Kang et al., 2012; Song et al., 2010; Huang et al., 2015). Meanwhile, the emerging of big data provides an unprecedented opportunity to be able to quantitatively analyse human activity patterns (Gonzalez et al., 2008; Wang et al., 2009; Wang & Song, 2015).
Extracting meaningful activities from original datasets is crucial for further uncovering human activity patterns. Spatiotemporal clustering is one of the most popular ways to do so, but it can only handle the datasets based on time and space dimensions (e.g., GPS trajectories). Massive, multi-dimensional data are being generated by various smart devices (e.g., smart phones and wearable devices) through APPs installed (e.g., social media and health APPs) (Li et al., 2015). On one hand, it provides rich information that can be beneficial to better understand human activity patterns. On the other hand, it needs some new methods
* Corresponding author
other than spatiotemporal clustering to handle the associated none-spatiotemporal attributes together.
We propose a clustering method which is able to group geo-tagged social media data not only from spatiotemporal perspectives but also considering similar semantics patterns raising from each spatiotemporal clusters. Through analysing this type of clusters, the human activity pattern can be analysed more deeply and reasonably. What people do in a location at a time can be then better depicted, which lays a foundation to uncover the motivation underlying the human mobility pattern.
2. DATA
Twitter dataset is used to represent human activities. The content of tweet is assumed to illustrate “what people do”, while the associate geo-coordinates and time represent where and when people stay.
The whole year of geo-tagged tweets posted in Toronto, ON, Canada (April 2014 to April 2015) were downloaded through Twitter Streaming API, including a total of 4,350,005 tweets from 125,730 users. Among these tweets, the accounts of the users who always tweet at identical locations are considered as robot accounts and were excluded from the analysis. The number of tweets follow a heavy tail distribution (Figure 1a), thus only
The International Archives of the Photogrammetry, Remote Sensing and Spatial Information Sciences, Volume XLI-B2, 2016 XXIII ISPRS Congress, 12–19 July 2016, Prague, Czech Republic
This contribution has been peer-reviewed.
the users who posted tweets over the average (34.5) were included (Jiang et al., 2013). Eventually, 3,684,980 tweets from 18,122 users were selected for exploring (Figure 1b). Each collected tweet was anonymized beforehand so that only UserID (a unique number), Time (yyy-mm-dd, hh:mm:ss), Geo-coordinates (longitude and latitude Geo-coordinates) and Text were included in this study.
(a)
(b)
Figure 1. (a) Distribution of tweet volume posted by each user; and (b) mapped tweets (the lighter the more tweets posted)
3. METHODOLOGY
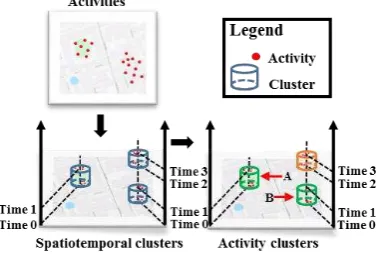
First, all geotagged tweets are spatiotemporally clustered using density-based spatial clustering of applications with noise (DBSCAN) algorithm. Then a machine learning algorithm is implemented to infer the associated semantic pattern raising from each spatiotemporal cluster. Last, the temporal-semantic similarity among the spatiotemporal clusters is computed to further group them.
Figure 2 Clustering workflow. The spatiotemporal clusters having similar semantic patterns are highlighted in the same colour. Therefore, spatiotemporal cluster A and B are similar in
terms of semantics and time period, which can be grouped as the same type of activity cluster.
3.1 Spatiotemporal clustering
A spatiotemporal clustering based on DBSCAN algorithm (Ester et al. 1996) is developed to cluster original activities from a spatiotemporal perspective. The activities close to each other in
terms of both space and time are combined to a specific type of activity.
A threshold of 10-meter and 30-minute is used to find meaningful activities based on a core. The mean of activity density in each 10-meter by 10-meter square is used as the density for the clustering.
Different spatiotemporal clusters indicate different types of activities in terms of spatiotemporal dimension. Actually, by using these activity clusters, human mobility pattern can be inferred but what kind of activities occurred within each cluster is still hard to be uncovered. To do so, topic models are subsequently introduced to infer a semantic pattern within each mobility pattern.
3.2 Topic modelling
Topic modelling, a machine learning method that enables us to understand the topics in large text corpora by means of drawing probabilistic distribution over topics and probabilistic distribution over words in each topic (Blei et al., 2003), is used to infer the semantic pattern associated with each spatiotemporal cluster. By analysing the probability distribution over topics in each spatiotemporal cluster, what people talk about can be revealed, which can be used to depict what individuals “do” (motivation behind a mobility pattern).
P(s) is written to represent the semantic pattern (the probabilistic distribution over topics) in each spatiotemporal cluster. P(w|s), a probabilistic distribution over words for a given topic, is used to describe what a topic is discussed about. Only words (w) are observations in the model. In each semantic pattern, the probability of the ith word in a semantic pattern m is:
� | = ∑ = � | = � = | (1)
where si is a latent variable indicating the topic from which the ith
word was drawn. � | = indicates the probability of the ith
word for topic j; � = | refers to the probability of the ith
topic sampled for the ith word token for the pattern m.
To estimate the parameters of the topic model, Gibbs sampling, a form of Markov chain Monte Carlo (MCMC), is used to directly estimate the two posterior (conditional) distributions over s (the assignment of word token to topics) since it is able to efficiently and easily extract topics from a large size dataset (Steyvers & Griffiths, 2007). Based on that, the semantic pattern (topics distribution) can be easily depicted.
The number of topics to be inferred needs to be estimated for training. Perplexity, a standard metric to measure the generalization performance (Blei et al., 2003), can be used to estimate the number of topics. The perplexity of semantics dataset (Dsem) is defined as:
�� � ��� = exp {−∑�=∑�=� ���| } (2)
where Lm is the number of words of tweets of each spatiotemporal
cluster, wm refers to words of spatiotemporal cluster m ϵ Dst.
p(wm|M) can be computed by Eq. (1). 3.3 Temporal-semantic similarity
We define that a group of spatiotemporal activity clusters are similar in terms of time and semantics when they have close time
The International Archives of the Photogrammetry, Remote Sensing and Spatial Information Sciences, Volume XLI-B2, 2016 XXIII ISPRS Congress, 12–19 July 2016, Prague, Czech Republic
This contribution has been peer-reviewed.
period and similar semantic patterns. A Boolean matrix, A(s)nxn
is used to quantitatively measure the similarity between every two spatiotemporal activity clusters:
representing the similarity between every two spatiotemporal activity clusters among n spatiotemporal clusters, where the entries of the main diagonal are all zero. The entry skj is assigned
as 1 if cluster k and j are similar in terms of semantics and time, otherwise skj is assigned to 0. The same for A(TS)nxn, the time 1991), can be used to compute the similarity:
, = ∑ � � convenience, we compute a symmetric measure using:
′ , = [ , + , ] (5)
KL’ between every two users is computed to further group similar activity clusters in terms of semantic pattern.
Welch's t-test (Welch, 1947) is applied to compute the similarity in terms of time period. By using it, a diversity of time periods can be dynamically generated based on the characteristics of dataset for computing the similarity.
The statistic t of Welch’s t-test is defined as:
=
� − � Based on t, P-value is computed to finally determine if the two datasets are similar or not. Welch’s t-test is applied to compare activity distributions in terms of time for every two clusters, therefore similar clusters have a characteristic where the majority of activities in each cluster of them are all distributed in the same time period.4. RESULTS AND DISCUSSION
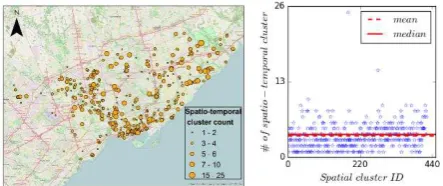
A total of 1,569 spatiotemporal clusters was generated from 423 different activity spots (spatial clusters). After filtering noisy clutters, only 448 spatiotemporal clusters were obtained (Figure 3). The number of spatiotemporal clusters in each spot ranges from 1 to 25 (Figure 3a), while most of spots have less than 5
spatiotemporal clusters. The mean of the number of spatiotemporal clusters in each spot, which is 3.4, is close to the corresponding median of that, which is 4.0. In other words, each location is visited by an average of 3.4time periods probably driven by different types of activities. Moreover, the spatiotemporal clusters that have the same number of time periods (the same size of circles in Figure 3a) are geo-distributed diversely, which is likely caused by the same type of activities at different locations.
Figure 3. (a) Mapped spatiotemporal clusters, the size of circle refers to the number of spatiotemporal clusters associated to a spot. Big circles may contain different types of activity, while the circles with the same size at different locations may be caused by the same type of activities. (b) The density of spatiotemporal clusters in each spatial cluster.
A total of 100 topics were used to train the topic model according to the distribution of Perplexity in Eq. (2). The semantic pattern associated with each spatiotemporal cluster is quantitatively represented by a probabilistic distribution over the 100 inferred topics. Each topic is drawn by the probabilistic distribution over words from the content of tweets.
Connected spatiotemporal clusters are finally used to represent human activity patterns. The connections stand for the similarity in terms of both semantics and time, which is computed by Eq. 3. In other words, the connected spatiotemporal clusters make up a type of activity regardless how far they are away from each other geographically.
A large number of spatiotemporal clusters that have very similar semantic patterns exist, and 55% of them contributes to KL’ (Eq. 5) of which the value is less than 0.5. This provides an evidence that people may participate in similar activities in different locations due to the similar functionality involved in different urban areas. In other words, some different mobility patterns actually are driven by the same motivation.
By analysing the connected clusters, human mobility can be reasonable predicted. More possible places to where individuals are moving could be identified by means of analysing the connected activities. More importantly, activity changes can be predicted in advance through finding those similar connected activities in case where an activity change is detected. As such, these activities can be removed from the prediction model to decrease the negative impact of the predictive results (Huang, et al., 2015; Song et al., 2006). Furthermore, through analysing the structure of associated activity network of a type of mobility pattern from different individuals, the mobility pattern could be further distinguished.
5. CONCLUSION
An innovative clustering method was proposed for handling the datasets that involves not only spatiotemporal dimensions but also textual information (semantics). The method was applied to
The International Archives of the Photogrammetry, Remote Sensing and Spatial Information Sciences, Volume XLI-B2, 2016 XXIII ISPRS Congress, 12–19 July 2016, Prague, Czech Republic
This contribution has been peer-reviewed.
one full-year tweets posted in Toronto, Canada, and the human activity pattern was analysed. We found that around 55% activities in different locations at different time are actually similar in terms of time and semantics, which can be eventually grouped as a type of activity.
ACKNOWLEDGEMENTS
This work has been funded by the Natural Science and Engineering Research Council of Canada (NSERC) [RGPIN/250346-2011].
REFERENCES
Alexander, L., Jiang, S., Murga, M., & González, M. C., 2015. Origin–destination trips by purpose and time of day inferred from mobile phone data. Transportation Research Part C: Emerging Technologies, 58, pp. 240-250.
Blei, D. M., Ng, A. Y., & Jordan, M. I., 2003. Latent dirichlet allocation. The Journal of machine Learning research, 3, pp. 993-1022.
Ester, M., Kriegel, H. P., Sander, J., & Xu, X., 1996. A density-based algorithm for discovering clusters in large spatial databases with noise. In Kdd, 96(34), pp. 226-231.
Gonzalez, M. C., Hidalgo, C. A., & Barabasi, A. L., 2008. Understanding individual human mobility patterns. Nature, 453(7196), pp. 779-782.
Hanson, S., 2005. Perspectives on the geographic stability and mobility of people in cities. Proceedings of the National Academy of Sciences, 102(43), pp. 15301-15306.
Huang, W., Li, S., Liu, X., & Ban, Y., 2015. Predicting human mobility with activity changes. International Journal of Geographical Information Science, 29(9), pp. 1569-1587.
Kang, C., Ma, X., Tong, D., & Liu, Y., 2012. Intra-urban human mobility patterns: An urban morphology perspective. Physica A: Statistical Mechanics and its Applications, 391(4), pp. 1702-1717.
Li, S., et al., 2016. Geospatial big data handling theory and methods: A review and research challenges. ISPRS Journal of Photogrammetry and Remote Sensing, 115, pp. 119-133.
Lin, J., 1991. Divergence measures based on the Shannon entropy. IEEE Transactions on Information Theory, 37(1), pp. 145-151.
Steyvers, M., & Griffiths, T., 2007. Probabilistic topic models. Handbook of latent semantic analysis, 427(7), pp. 424-440.
Song, C., Qu, Z., Blumm, N., & Barabási, A. L., 2010. Limits of predictability in human mobility. Science, 327(5968), pp. 1018-1021.
Wang, P., González, M. C., Hidalgo, C. A., & Barabási, A. L., 2009. Understanding the spreading patterns of mobile phone viruses. Science, 324(5930), pp. 1071-1076.
Wang, D., & Song, C., 2015. Impact of human mobility on social networks, Journal of Communications and Networks, 17(2), pp. 100-109.
The International Archives of the Photogrammetry, Remote Sensing and Spatial Information Sciences, Volume XLI-B2, 2016 XXIII ISPRS Congress, 12–19 July 2016, Prague, Czech Republic
This contribution has been peer-reviewed.