APPLICATION OF FUSION WITH SAR AND OPTICAL IMAGES IN LAND USE
CLASSIFICATION BASED ON SVM
Chunhong Bao a, b,c, , Guoman Huang a,* , Shucheng Yanga
a
Chinese Academy of Surveying and Mapping, Beijing, China
b
College of Resources and Environment
,
Hunan Agricultural University
,
Changsha ,China
cShandong University of Science and Technology, Qingdao, China
Commission I, WG I/2
KEY WORDS: SAR, Multi-spectral images, Image fusion, SVM, Land use classification
ABSTRACT:
As the increment of remote sensing data with multi-space resolution, multi-spectral resolution and multi-source, data fusion technologies have been widely used in geological fields. Synthetic Aperture Radar (SAR) and optical camera are two most common sensors presently. The multi-spectral optical images express spectral features of ground objects, while SAR images express backscatter information. Accuracy of the image classification could be effectively improved fusing the two kinds of images. In this paper, Terra SAR-X images and ALOS multi-spectral images were fused for land use classification. After preprocess such as geometric rectification, radiometric rectification noise suppression and so on, the two kind images were fused, and then SVM model identification method was used for land use classification. Two different fusion methods were used, one is joining SAR image into multi-spectral images as one band, and the other is direct fusing the two kind images. The former one can raise the resolution and reserve the texture information, and the latter can reserve spectral feature information and improve capability of identifying different features.
The experiment results showed that accuracy of classification using fused images is better than only using multi-spectral images. Accuracy of classification about roads, habitation and water bodies was significantly improved. Compared to traditional classification method, the method of this paper for fused images with SVM classifier could achieve better results in identifying complicated land use classes, especially for small pieces ground features.
* Corresponding author.
1. INTRODUCTION
With the development of remote sensing technology, there are more and more multi-source remote sensing data of the same area could be obtained, especially the multi-spectral images and SAR images. As we all known, the optical image can reflect spectral information of surface features, and the SAR image can reflect back scattering intensity information of the different surface features and combined surface features To adequately take advantage of the spectral images and the SAR images, multisensor data fusion technique has been proposed in remote sensing image processing and Information Classification on Remote Sensing Image, which is the gist of this paper.
So far, there are a number of remote sensing image fusion methods, especially for fusing the multi-spectral image and panchromatic image. All the standard image fusion methods such as IHS, PCA, Brovery transformation often result in serious spectral distortion. The emergence of the hybrid image fusion such as Wavelet Transformation solved the problem of the spectral distortion in the image fusion. Now the Wavelet Transformation has been widely used in various image fusion because of its better fusion effect. Based on the achievements summed up by our predecessors, this paper fuses the domestic airborne SAR images and SPOT5 images by all kinds of fusion methods. Furthermore, contrasts the fusion precision and selects the best fusion data to be classified based on SVM.
2. DATA FUSION METHODS
2.1 Principal component analysis
Principal component analysis (PCA), which first PCA transforms multi-band images, and enhances other single-band image by gray stretch which makes the mean and variance of gray to consistent with the first principal component image and replace the first. After PCA inverse transformation back to the original space, generate a multi-band image fusion, generating a multi-band of fusion image . The principal component images was Calculated out by following formula:
n
i ik i
k
d
pc
(1)
Where K is the ordinal number of principal component, pck for No. k principal components, i is the ordinal band, n is the number of SPOT band, di for the SAR image pixel values, for the eigenvector matrix of the i-th row in the k-th column of elements.
2.2 Fusion of high-pass filter (HPF)
HPF uses high-pass filter to suppress low-frequency spectral information and to enhance high-frequency spatial information from resolution image. Then combines the processed high-resolution image with high-resolution image to increase low-resolution image’s spatial low-resolution. This method can be used on fusing any kinds of bands. The formula is:
International Archives of the Photogrammetry, Remote Sensing and Spatial Information Sciences, Volume XXXIX-B1, 2012 XXII ISPRS Congress, 25 August – 01 September 2012, Melbourne, Australia
2
ljk Hjk
HPF
B
FB
B
(2)In the formula, means the fusion of pixel values, Bljkmeans the low-resolution multi-spectral pixel value, FBHjk means high-frequency filtered images for the transportation value.
2.3 Wavelet transform (WT)
Wavelet transform is a global transformation, which has a good positioning capability in the time domain and frequency domain, high-frequency component of a gradual refinement of the time domain and space steps, it can focus on the image to be processed in any detail. At first, it wavelet transform the remote sensing image data which involved the fusion to decompose all the images into high-frequency information and low-frequency information. Second, it makes inverse wavelet transform to generate fusion image by combining high-frequency component of high resolution image with low-freguency component of low resolution image.
3. STYLING STUDY AREA AND DATA PROCESSING
3.1 study area and data source
Study area is located in Songpan County Hengduan Mountains region. the main features in the region include buildings, roads, green space, farmland and so on. The used data were the Airborne SAR-X and SPOT data. The main parameters of the data were in Table 1.
Table 1 The Main Parameters Of Data Sources
3.2 Data Processing
To ensure accurate analysis, the relevant data was processed before data fusion. The data preprocessing includes geometric correction, cropping, noise reduction and so on. First, the SPOT geometric correction of and SAR image orthorectification were made based on the topographic map. Second, the corrected images were cropped. Third, the airborne SAR speckle noise was eliminated by using Gamma adaptive filtering method to ensure the precision error within 0.5 pixel before data fusion.
4. IMAGE FUSION 4.1 Image Fusion
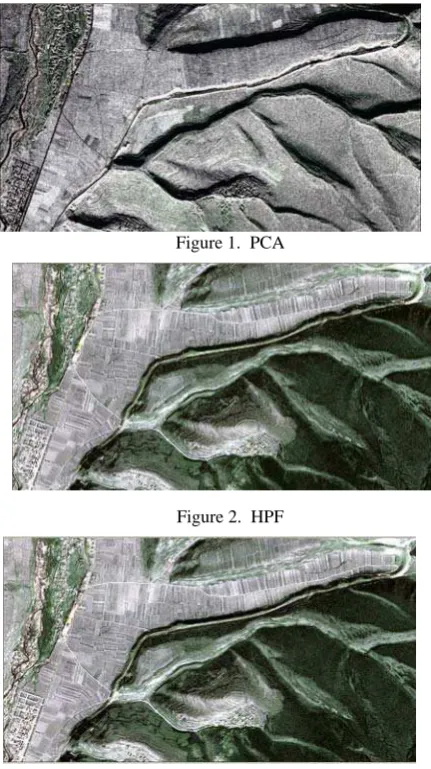
After correlation analysis of the pre-processed data, this paper selects three RGB visible band combinations to fuse with the SAR data. Then data fusion had been maken by the methods such as PCA, HPF and WT transform. The fusion data were shown in Figure 1. All the fusion images have high spatial resolution and rich detail information. However, each fusion data of different methods has its own has its own characteristics: The above-described methods has its own characteristics, based on data fusion PCA transform texture, edges clearer, more appropriate to distinguish the boundary features in the extraction of information, but in true color image retention on the existence of a gap. HPF transform fusion compared to the
original multi-spectral SPOT image, resolution is improved a lot, but compared to the fusion of information maintained in the spectrum than the inferior. And after wavelet transform fusion images in the same well preserved multi-spectral images of the spectral information, but also to keep the details of SAR images, SPOT images and the original color and consistent, compared to the other four transformations integration to obtain a better convergence results.
Figure 1. PCA
Figure 2. HPF
Figure 3. WT
4.2 Evaluation of image fusion
4.2.1 Entropy: Entropy is a measure of image information
richness is an important indicator of the size of the entropy reflects the amount of information contained in the image number, under normal circumstances, the greater the entropy of fusion images, the amount of information it contains, the more the better integration . Image entropy H is defined as.
Where, L is the image of the gray series, the number of pixels for the gray value of the total number of pixels image ratio. Analysis obtained as shown in Table 2, the maximum entropy
Sensor Wave
International Archives of the Photogrammetry, Remote Sensing and Spatial Information Sciences, Volume XXXIX-B1, 2012 XXII ISPRS Congress, 25 August – 01 September 2012, Melbourne, Australia
of wavelet transform, and principal component analysis and high-pass filter is smaller for smaller wavelet transform.
fusion PCA HPF WT
Entropy 7.74 7.72 7.80
Table.2 Entropy of Image
4.2.2 Definition: Clarity to an objective assessment of image texture features information and spectral characteristics of information, the higher the image resolution the better the quality index, blending the best results. In which the different bands of the image analysis showed that the fusion of the wavelet transform highest resolution, more than in 26.84, while the principal component analysis and high-pass filtering methods are less than 20, significantly less than the wavelet transform method.
fusion PCA HPF WT
Band R G B R G B R G B
Definition 19.2 19.8 19.5 18.3 18.2 17.7 27.7 27.4 26.8
Table 3 Definition of Image
5. RESULTS 5.1 Support Vector Machine
Support Vector Machine (Support Vector Machine, referred to as SVM) is in the statistical theory developed on the basis of a new pattern recognition method, to solve the small sample, nonlinear and high dimensional pattern recognition problems show many unique advantages. Based on statistical learning theory, VC dimension and structural risk minimization theory based on the principle, and can be solved in practical applications there is a small sample, nonlinear, high dimension and local minima problems. In pattern recognition, regression estimation, probability density function estimation and other fields has been widely used. The texture recognition can be seen as a different texture and characteristics of the non-linear approximation is good cooked.
The basic idea of SVM is to find a separating hyperplane, so the two classes of training samples in the sample can be separated and far away from the plane as much as possible, as shown in Figure. The figure, H is the optimal classification surface, Ha and Hb m is the distance between the classification space. The problem has a unique extremum, lagrange multiplier method with standard solvers. There will be a part of the solution is not zero, the corresponding sample is support vector. Solving optimization problems and the actual calculation of classification plane, simply calculate the function. Commonly used functions are polynomials, Radius Basis Function, Sigmoid, etc. These core functions have been proved suitable for the vast majority of non-linear classification problems.
Fig.4 Optimum separation plane
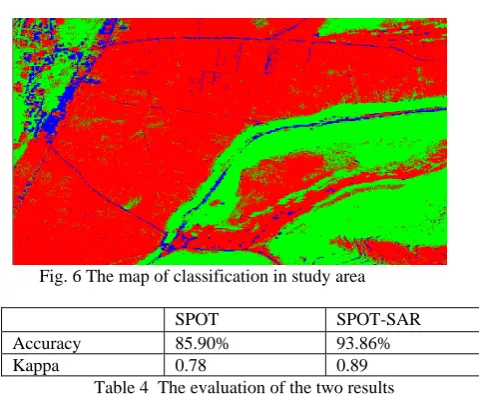
Based on evaluation of data fusion results of analysis, the wavelet analysis of the best fusion of data quality, cut experimental plots of the data fusion using SVM classification, classification of the original image and classification results as shown (5, 6), fused image accuracy of 93.86%, to better distinguish between the cultivated land, forest, settlements and roads, classification accuracy of 93.86%, much higher than before the integration of the classification accuracy of 85.90% of data, to better achieve the western classification of surface features to provide a better classification.
Fig.5 The original image of Classification in study area
Fig. 6 The map of classification in study area
SPOT SPOT-SAR Accuracy 85.90% 93.86% Kappa 0.78 0.89
Table 4 The evaluation of the two results H
Ha
W
2
m W
Hb
1
Tw x
b
0
T
w x
b
1
Tw x
b
International Archives of the Photogrammetry, Remote Sensing and Spatial Information Sciences, Volume XXXIX-B1, 2012 XXII ISPRS Congress, 25 August – 01 September 2012, Melbourne, Australia
REFERENCES
[1] LI huihui, GUO lei, Liu hang. Wavelet transform based on different types of SAR and Optical Image Fusion. Photon Technology,2006 35 8 1263-1266.
[2] CAI huaihang, LEI Hong. SAR and visible image fusion evaluation and objective, Science Technology and Engineering. 2011 15 11 3456-3461.
[3] Zhang Y. A New Merging Method and It s Spectral and Spatial Effects [J] . International Journal of Remote Sensing, 2010,(1) : 2003-2014.
[4] XAVIER B, LAURENT V,PIER RED. Efficiency of crop identification based on optical and SAR image time series. Remote Sensing of Environment 2005,96:352- 365.
[5] Chen H, Liu Y Y, Wang Y J. A novel image fusion method based on wavelet packet transform. IEEE International Symposium on
knowledge Acquisition and modeling workshop,2008: 462—
465.
[6] CHEN Wei li,Classification of Terrain Surfaces Using Fused
Images of Multi Spectral and SAR Image Based on Support Vector Machine. Journal of Anhui Agriculture science.2010, 38(20); 10662-10664.
International Archives of the Photogrammetry, Remote Sensing and Spatial Information Sciences, Volume XXXIX-B1, 2012 XXII ISPRS Congress, 25 August – 01 September 2012, Melbourne, Australia