MAPPING MAJOR CROPPING PATTERNS IN SOUTHEAST ASIA FROM MODIS DATA
USING WAVELET TRANSFORM AND ARTIFICIAL NEURAL NETWORKS
N.T. Son a*, C.F. Chen a, C.R. Cru b a
Center for Space and Remote Sensing Research – (ntson, cfchen)@csrsr.ncu.edu.tw
b
Department of Civil Engineering – [email protected]
National Central University, Jhongli, Taiwan
Commission III, WG III/5
KEY Words: MODIS data, Croplands, Wavelet transform, Artificial neural networks (ANNs), Southeast Asia.
ABSTRACT:
Agriculture is one of the most important sectors in the economy of Southeast Asia countries, especially Thailand and Vietnam. These two countries have been the largest rice suppliers in the world and played a critical role in global food security. Yearly rice crop monitoring to provide policymakers with information on rice growing areas is thus important to timely devise plans to ensure food security. This study aimed to develop an approach for regional mapping of cropping patterns from time-series MODIS data. Data were processed through three steps: (1) noise filtering of time-series MODIS NDVI data with wavelet transform, (2) image classification of cropping patterns using artificial neural networks (ANNs), and (3) classification accuracy assessment using ground reference data. The results by a comparison between classification map and ground reference data indicated the overall accuracy of 80.3% and Kappa coefficient of 0.76.
1. INTRODUCTION
Agriculture has been a key driver of development in Southeast Asia countries (Evenson and Rosegrant., 2003; Timmer, 2009). More than 60% of the labor force in Cambodia, Laos, Myanmar, and Vietnam depends on agriculture. Rice agriculture in these countries is still the most dominant agricultural activity taking up a large part of the harvested area (50-80%) and value of production (FAOSTAT, 2009). Thailand and Vietnam by far are the two leading rice suppliers in the world (FAO, 2010). Rice is the most important staple food for more than 50% of the world's population with more than 20% of their daily calories (Maclean et al., 2002). As the world population continues to grow steadily, while land and water resources are declining. Moreover, climatic change through global warming has also been a key factor causing declined rice production (Furuya and Kobayashi, 2009; Matthews and Wassmann, 2003). Efforts to balance rice production to meet the food demands of a growing population are vitally important. Thus, accurate estimates of rice growing areas are needed to estimate rice production.
Conventional methods of acquiring these data at a regional scale reveal problems due to the costs of field surveys for complex farming systems throughout the year. Low-resolution remote sensing has been proven as an indispensable tool for providing data for this monitoring purpose at regional and global scales because the data has advantages of high temporal resolution and wide coverage. However, low-resolution remotely-sensed data are often obscured by cloud cover. Filtering such noise from the data is usually done prior to the classification. A number of noise reduction algorithms (e.g., Fourier transform, wavelet transform, empirical mode decomposition, and local maximum fitting) have been developed and commonly used for filtering noise from time series of satellite vegetation indices. This study used wavelet transform for noise filtering of time-series NDVI data. As NDVI data are nonlinear and traditional parametric classification algorithms based on spectral bands, such as maximum likelihoods, are insufficient to delineate seasonal farming activities, non-parametric mapping methods (e.g., artificial neural networks
– ANNs, support vector machines – SVMs) have been proven to be sufficient to handle complex classification tasks. In this work, we applied ANNs for mapping cropping patterns in the study area. This method is developed based on statistical learning theory (Foody and Mathur, 2004; Haykin, 1994).
The main objective of this study is to develop an approach for mapping major cropping patterns in Southeast Asia from MODIS time-series NDVI data using wavelet transform and ANNs.
2. STUDY AREA
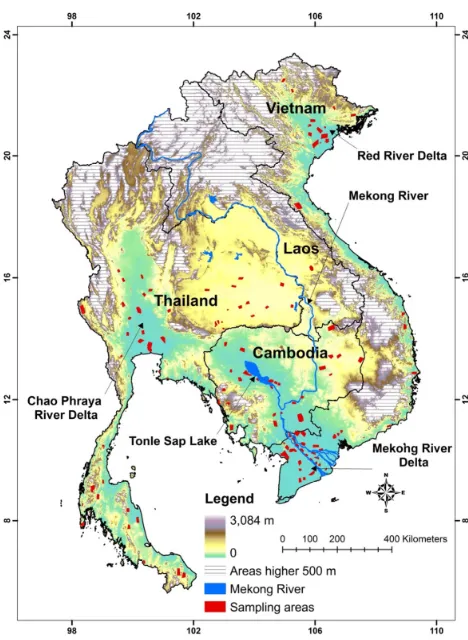
The study area includes four Southeast Asian countries: Vietnam, Thailand, Laos and Cambodia, lying between 5.62-23.45 N and 97.34-109.51 E (Figure 1). The total area is approximately 1,081,130 km2, in which agricultural land occupies approximately 23% (Stibig et al., 2004). Rice was a main crop commonly practiced in plain areas. Field crops such as sugarcane, cassava, and maize occupied the uplands. Monitoring rice growing areas becomes an important activity due to the official initiatives to ensure food supply and security.
Rice crops in the study area are classified according to their periods of cultivation (cultivating seasons). Basically, there are three types of rice cropping systems: single-cropped rice, double-cropped rice, triple-cropped rice. Single cropping system used long-term rice varieties (160-180 days) was often planted under predominantly rain-fed conditions, whilst double and triple rice cropping systems used short-term varieties (90-100 days) are commonly practiced in the Vietnamese Mekong River Delta (MRD), Red River Delta (RRD), and Chao Phraya River Delta (CRD) of Thailand.
As rice area was practiced in the lowlands and our study focused on investigating rice agriculture, mountainous areas where the elevation was higher than 500 m were masked out using the shuttle radar topography mission (SRTM) 90 m digital elevation model.
* Corresponding author.
Figure 1. Map of the study area showing the sampling areas (ground reference data) used for extracting training data used in ANNs and evaluating accuracy classification results.
3. DATA
MODIS/Terra surface reflectance 8-day L3 global 500 m SIN grid v005 (MOD09A1 product) acquired from NASA for 2010 were used in this study. This data product has seven spectral bands. The spatial resolution is 500 m × 500 m. The data include quality control lags for image artifacts. It has also been validated for stage 2 and is ready for use in scientific publications (Vermote et al., 2008). Other data including the Lower Mekong Basin land-use map (MRC, 2010), the 2000 VMD land-use map (Sub-NIAPP, 2002), and the 2000 Thailand land-use map (LDD, 2000) were also collected and used for field investigation and preparation of ground reference data.
4. METHODS
4.1 Time-series NDVI data noise filtering
The time-series NDVI data were created by first calculating every 8-day MODIS scene. They were then stacked into one 8-day composite scene with 46 bands. Time-series MODIS NDVI data are often obscured by noise due to the cloud cover commonly seen in the tropical climate. Thus, it is essential to mitigate such noise before the data can be used for classification. For this reason, we first masked out thick cloud cover using the blue band, where its reflectance value was greater than 0.2 (Xiao et al., 2006). The missing values were replaced with new values from the time-series profile using linear interpolation. The wavelet transform was then applied to filter noise from the time-series NDVI data. The wavelet transform W(s,τ) of a signal
x(t) is defined as follows: Symlet wavelet functions for determining rice crop phenology (Sakamoto et al., 2005).
4.2 Image classification
The ANNs back-propagation algorithm was utilized for classification. This algorithm uses the delta rule of a steepest descent to adjust weights based on the backward propagation of errors in the network (Paola and Schowengerdt, 1995). The ANNs has a learning process where training signatures are randomly selected and fed to adjust the internal weight matrix. This is made by a repetition of back-propagations of the answer into the weight matrix. When the learning process is complete, the weight matrix is ready to process any new signature from the imagery dataset. In this study, we designed ANN architecture: one input layer, one output layer and one hidden layer. The number of 93 neurons were calculated based on the existing literature recommendations: 2n + 1 (Atkinson and Curran, 1995), where n is the number of bands. The commonly-used back-propagation algorithm using tansig function was utilized to train the network.
The training samples used to train ANNs for classification were extracted from the ground reference data prepared after field investigation. A total of samples of 14,602 (single-cropped rice: 2,333, double-cropped rice: 3,638, triple-cropped rice: 1,336, field crops: 1,020, forests/orchards/perennial trees: 5,741, and built-up areas: 534) seems to most of variability of the study was used. Water bodies were excluded from the analysis. We identified water bodies and masked them out by analysis of smooth NDVI and land surface water index (LSWI) profiles (Xiao et al., 2006). The training samples were divided into three parts: training samples (50% of the total samples), validation samples (25% of the total samples), and testing samples (25% of the total samples).
The network’s performance is measured using a mean squared error (MSE) and a confusion matrix. The training process was carried out until the mean squared error (MSE) reached 0.00044 at the epoch 366. The confusion matrix shows the percentages of correct classification of 98.8%. There was significant correlation between testing samples and outputs (R2 = 0.99). The classification results values range from 0 to 1. The winner-take-all algorithm was used to get the class indices as the position of the highest element in each output vector of ANNs.
4.3 Accuracy assessment
The classification results were compared with the field data. A total of 2,000 pixels for each class were randomly extracted from the ground reference data. The classification accuracy assessment was performed such that these ground reference pixels were compared with that of the classified map using the confusion matrix. Kappa coefficient and other parameters (i.e., overall, producer and user accuracies) were used to measure the classification accuracy.
5. RESULTS AND DISCUSSION
5.1 Characteristics of LULC NDVI profiles
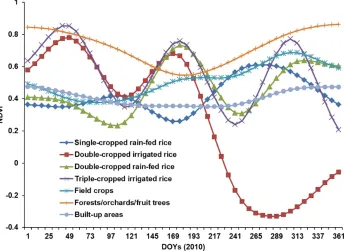
The mean NDVI profile for each land-use class was presented in Figure 2. There were distinctions between cropping patterns throughout the year. The single-cropped rice was practiced once a year. The peak (heading date) exhibited once a year by the end of December. Double-cropped rice has two peaks, indicating two rice crops being practiced per year. However, the peaks were shifted depending on the region attributed to the local climatic conditions. Similarly, three peaks were observed for
triple-cropped rice because three crops were practiced per year. Farmland characterized by field crops (e.g., sugarcane, cassava, and maize) revealed one peak in the NDVI profile by the end of the crop because field crops were usually planted once a year in the rainy season. There was an increase in vegetation activity in the field crop NDVI profile before the cultivating season due to the growth of vegetation. Built-up areas including high albedo surfaces (e.g., concrete, metal proof, parking lots, and roads) had low NDVI values and were stable fluctuation throughout the year.
Figure 2. Mean NDVI profiles of land-use types.
5.2 Classification results
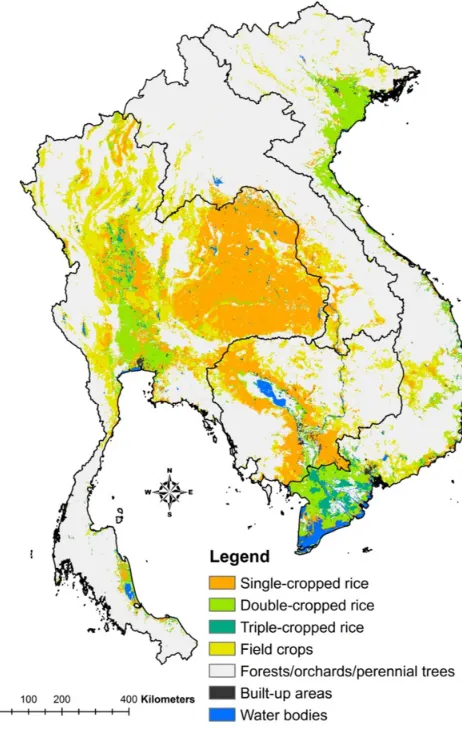
The 2010 classification results were presented in Figure 3. In general, single-crop rice was commonly practiced in the lowlands of Thailand and areas surrounding the Cambodian Tonle Sap Lake. Double-cropped rice was mainly concentrated in three deltas: RRD, MRD, and CRD. Triple rice cropping was especially observed in MRD and CRD that received irrigation water around the year. Field crops occupied the uplands, especially in the upper parts of Thailand. Forests were generally found in slope and mountainous areas where the land was not suitable for rice agriculture due to major soil constraints.
The error matrix of classification accuracy assessment was shown in Table 1. Of 12,000 pixels extracted from the ground
reference image for accuracy assessment of the 2010 classified map, the results indicated that the overall accuracy was 80.3% and the Kappa coefficient was 0.76. Of the total of 2,000 pixels checked to measure the accuracy in each class, the two classes with the highest producer accuracy levels were single-cropped rain-fed rice (88.7%) and double-cropped irrigated rice (91.9%). The lowest producer accuracy was observed for field crops class (67.5%) or 32.5% of pixels incorrectly classified into other classes. This could be explained that it was more difficult to accurately predict this class because the size of upland crop fields was general small and they were scattered. Moreover, the temporal confusion caused difficulties in the discrimination of this class from other classes.
Figure 3. Spatial distribution of cropping patterns.
Ground reference (pixels)
Classification results Single-
cropped rice
Double- cropped rice
Triple-
cropped rice Field crops
Forests/ orchards
Built-up
areas Total
Single-cropped rice 1,774 6 11 195 34 183 2,203
Double-cropped rice 0 1,838 372 76 126 294 2,706
Triple-cropped rice 0 109 1,547 16 19 8 1,699
Field crops 3 14 19 1,350 80 13 1,479
Forests/orchards 211 26 37 363 1,735 100 2,472
Built-up areas 12 7 14 0 6 1,402 1,441
Total 2,000 2,000 2,000 2,000 2,000 2,000 12,000
Producer accuracy (%) 88.7 91.9 77.35 67.5 86.75 70.1
User accuracy (%) 80.5 67.9 91.1 91.3 70.2 97.3
Overall accuracy (%) 80.3
Kappa coefficient 0.76
Table 1. Results of the classification accuracy assessment.
6. CONCLUSIONS
The objective of this study was to develop a classification approach for mapping major cropping patterns in Southeast Asia using time-series MODIS data. The data were processed using wavelet transform and ANNs. The results indicated that filtered NDVI patterns reflected temporal characteristics of different cropping patterns. This information was important for selecting training patterns used in ANNs classification. The ANNs applied to the filtered time-series MODIS NDVI data confirmed its validity for mapping cropping patterns in the study area. The results archived by comparisons between the classified map and the ground reference map indicated the overall accuracy of
80.3% and Kappa coefficient of 0.76. The lowest producer accuracy was observed for the field crops class (67.5%) due to temporal confusion in discriminating between this class and other classes. The methods using wavelet transform and ANNs for mapping major cropping patterns in Southeast Asia from filtered time-series MODIS NDVI data could be transferred to other regions in the world to replace costly field investigations.
REFERENCES
Atkinson, P.M., Curran, P.J., 1995. Defining an optimal size of support for remote sensing investigations. IEEE Transactions on Geoscience and Remote Sensing, 33, pp. 768-776.
Evenson, R.E., Rosegrant., M., 2003. The economic consequences of crop genetic: Improvement programmes. Crop varietal improvement and its effects on productivity: the impact of international agricultural research. CABI Publishing, CAB International, Wallingford, UK.
FAO, 2010. Food outlook: Global market analysis. Food and Agriculture Organization of the United Nations, Rome, Italy.
FAOSTAT, 2009. FAO statistics online. Food and Agriculture Organization of the United Nations, Rome, Italy.
Foody, G.M., Mathur, A., 2004. A relative evaluation of multiclass image classification by support vector machines.
IEEE Transactions on Geoscience and Remote Sensing, 42, pp. 1335-1343.
Furuya, J., Kobayashi, S., 2009. Impact of global warming on agricultural product markets: stochastic world food model analysis. Sustainability Science, 4, pp. 71-79.
Haykin, S., 1994. Neural networks: a comprehensive foundation.
Prentice Hall., Upper Saddle River, NJ.
LDD, 2000. Land-use map of Thailand. Land Development Department, Thailand.
Maclean, J.L., Dawe, D.C., Hardy, B., Hettel, G.P., 2002. Rice Almanac: source book for the most important economic activity on earth. CABI Publishing, Wallingford, UK.
Matthews, R., Wassmann, R., 2003. Modelling the impacts of climate change and methane emission reductions on rice production: a review. European Journal of Agronomy, 19, pp. 573-598.
MRC, 2010. Multi-functionality of paddy fields over the Lower
Mekong Basin.
Paola, J.D., Schowengerdt, R.A., 1995. A review and analysis of backpropagation neural networks for classification of remotely-sensed multi-spectral imagery. International Journal of Remote Sensing, 16, pp. 3033-3058.
Sakamoto, T., Yokozawa, M., Toritani, H., Shibayama, M., Ishitsuka, N., Ohno, H., 2005. A crop phenology detection method using time-series MODIS data. Remote Sensing of Environment, 96, pp. 366-374
Stibig, H.J., Achard, F., Fritz, S., 2004. A new forest cover map of continental southeast Asia derived from SPOT-VEGETATION satellite imagery. Applied Vegetation Science, 7, pp. 153-162.
Sub-NIAPP, 2002. Land-use map of the Mekong Delta, Vietnam.
Timmer, C.P., 2009. A world without agriculture: the structural transformation in historical perspective. American Enterprise Institute, Washington DC, USA.
Torrence, C., Compo, G.P., 1998. A practical guide to wavelet analysis. Bulletin of the American Meteorological Society, 79, pp. 61−78.
Vermote, E.F., Kotchenova, S.Y., Ray, J.P., 2008. MODIS surface reflectance user’s guide.
Xiao, X., Boles, S., Frolking, S., Li, C., Babu, J.Y., Salas, W., Moore Iii, B., 2006. Mapping paddy rice agriculture in South and Southeast Asia using multi-temporal MODIS images. Remote Sensing of Environment, 100, pp. 95-113.