Warm-glow versus cold-prickle: a further
experimental study of framing effects on free-riding
Eun-Soo Park
Department of Economics, University of Missouri-Rolla, Rolla, MO 65409-1250, USA
Received 24 June 1998; accepted 21 March 2000
Abstract
This paper examines the effects of positive and negative framing on cooperation in voluntary public goods provision experiments in which subjects have different value orientations. The major finding of this experiment is that while there is a significant difference between the two framing conditions in terms of overall contribution rates, there is no significant difference for some subjects. In particular, the data strongly suggest that the negative framing has a most salient effect on the subjects who have individualistic value orientation, whereas the negative framing has a rather insignificant effect on the subjects who have cooperative value orientation. This suggests that at least for some group, the behavioral asymmetry between the warm-glow of doing something good and cold-prickle of doing something bad may not be as significant as in the previous study of Andreoni (1995). © 2000 Elsevier Science B.V. All rights reserved.
Keywords:Public goods experiment; Free riding; Framing effects; Value orientations JEL classification:C92; H41
1. Introduction
Despite the fact that free riding is a dominant-strategy in a standard one-shot voluntary public goods provision problem, virtually all public goods provision experiments in the laboratory find the lack of free riding.1 Even though some environmental parameters for experiments such as repetition, experience, and low marginal returns from the public goods are found to be potentially important determinants of free riding, the convergence to the equilibrium prediction seems to be too slow to support the theory fully.2
E-mail address:[email protected] (E.-S. Park).
1See Davis and Holt (1992) and Ledyard (1995) for survey on public goods experiments. 2See Issac and Walker (1988) and Issac et al. (1985).
In his recent paper, Andreoni (1995) has suggested that much of the cooperation observed in public good provision experiments may be due to framing. In order to examine the effects of positive and negative framing on the level of cooperation in public goods experiments, Andreoni considered two different framing conditions: (1) thepositive-framecondition, in which subject’s choice is framed as contributing to a public good that makes other subjects better off and; (2) thenegative-framecondition, in which subject’s choice is framed as buying a private good that makes other subjects worse off. By conducting public goods experiments under these two conditions, Andreoni finds that contribution rates are considerably lower under the negative-frame condition than under the positive-frame condition. His arguments that much of the cooperation observed in public good provision experiments may be due to framing seem to be very convincing as the contribution rate to the public good converges to the Nash equilibrium by the end of iterations under the negative frame.3
The main objective of this paper is to examine the robustness of Andreoni’s findings regarding the existence of a positive–negative asymmetry. Given that previous voluntary public good provision experiments by many authors reported a high variance in contribution rates among subjects, it may be that some people are more sensitive to framing than others. In particular, this paper concerns whether such a behavioral asymmetry exists uniformly across the subjects who have differentvalue orientations(Liebrand, 1984; Offerman et al., 1996), i.e. different preferences regarding one’s own welfare relative to the welfare of oth-ers. In order to study the framing effects on the subjects with different value orientations, data on individual value orientation were first obtained using theDecomposed Game exper-imental design (Liebrand, 1984; Offerman et al., 1996). Then Andreoni’s experiment was replicated.
The major finding of this experiment is that while there is a significant difference between the two framing conditions in terms of overall contribution rates, there is no significant difference for some subjects. In particular, the data strongly suggest that the negative framing has a most salient effect on the subjects who have individualistic value orientation, whereas the negative framing has a rather insignificant effect on the subjects who have cooperative value orientation.
In Section 2, differences between experiments with positive and negative externalities are first discussed. A brief account on value orientations developed by social psychologists is then followed. In Sections 3 and 4, the experimental design and results are presented, respectively. Section 5 contains concluding discussion of the experimental results.
2. Framing effects and value orientations
In this section, I describe essential features of the framing-effects experiment and the value orientation experiment.
2.1. Positive and negative framing
This subsection closely follows Andreoni (1995) and readers are referred to his original paper for detailed description.
Subjects play in groups of five. Each subject is given 60 tokens. Every token placed in the private goodxiearns one cent for subjecti, while every token given to the public good gi earns one half cent for all five group members. Thus, subjecti’s problem is to maximize
πi =xi+12gi+
subject to the budget constraintxi+gi=60. Thus, in thispositive frame, an action of
con-tributing to the public good will generate a positive externality for other subjects. The positive frame instructions to subjects include “Every token you invest in the Individual Exchange will yield you a return of one. Every token invested in the Group Exchange will yield a return of one half forevery member of the group, not just the person who invested it. It does not matter who invest tokens in the Group Exchange. Everyone will get a return from every token invested — whether they invest in the group exchange or not’.
In order to convert this positive frame into a negative frame, Andreoni first reminds us that saying that an investment in the public good will make others better off is equivalent to stating that an investment in the private good will make others worse off. That is, the above positive frame can be converted into the negative frame by substituting the budget constraint of the other players,xj+gj=60, into the objective function (1):
πi =xi+12gi+
This negative frame is expressed in the negative frame instructions to the subjects in the following way: “Every token you invest in the Individual Exchange will yield you a return of one. However, each token you invest in the Individual Exchange will reduce the earnings of the other players by one half cent each. . . It will also be true that when the other members of your group invest in the Individual Exchange then your earnings will be reduced by 1/2 times their investment in the Individual Exchange. . . Every token you invest in the Group Exchange yields a return of 1/2 for you”. Also, in order to provide the same incentive for the subjects under the two different frames, each subject gets automatic earnings of 120 each round.
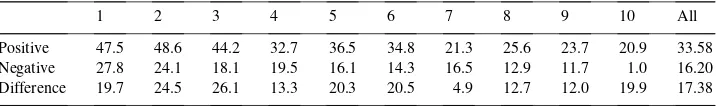
Table 1
Mean percent of tokens contributed to the public good (Andreoni, 1995)
1 2 3 4 5 6 7 8 9 10 All
Positive 47.5 48.6 44.2 32.7 36.5 34.8 21.3 25.6 23.7 20.9 33.58 Negative 27.8 24.1 18.1 19.5 16.1 14.3 16.5 12.9 11.7 1.0 16.20 Difference 19.7 24.5 26.1 13.3 20.3 20.5 4.9 12.7 12.0 19.9 17.38
The framing effect can also be seen by looking at the propensity of subjects to free ride under the two conditions. Table 2 lists the percent of subjects choosing the strategy of free-riding (i.e. no tokens to the public good). On average, 63.5% of negative-frame subjects free ride in any round, which is almost twice the rate of positive-frame subjects.
2.2. Value orientations
This subsection is based on Offerman et al. (1996). According to many social psy-chologists people have different goals when they make decisions that affect others. Social psychologists have developed the concept ofvalue orientationthat represents the weight an individual attaches to one’s own welfare to the welfare of other individuals (Offerman et al., 1996, p. 817). Five value orientations are often discussed: competitive, individualistic, cooperative, altruistic, and aggressive. Competitors want to be better off than others; indi-vidualists want to do best for themselves; cooperators try the best for both themselves and the others; altruists want to do best for others, regardless of the outcome for themselves and aggressors try to do worst for others, regardless of the outcome for themselves (Offerman et al., 1996, pp. 818–819). Most people are classified either as individualistic or cooperative (Liebrand, 1984; Offerman et al., 1996). For example, in Offerman et al.’s experiment, 65% of the subjects were labelled individualistic, 27% of them were labelled cooperative, 4% of them were labelled competitive, 1% of them were labelled aggressive.
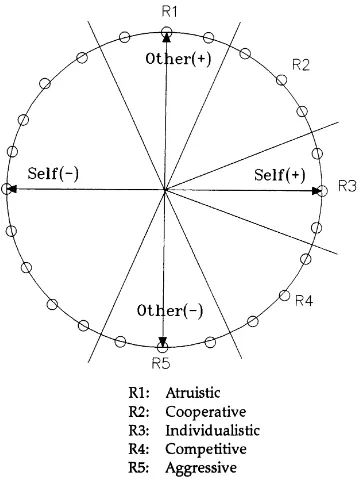
The Decomposed Game experiment (Liebrand, 1984; Offerman et al., 1996) is often used to assess individual value orientations. In this experiment each subject’s task is to make a series of 24 choices between two options. Each option specifies an amount of money to the decision-maker and an amount to another subject with whom the individual is anonymously paired during the experiment. These two options are two adjacent vectors of 24 equally spaced vectors on the circle,x2+y2=152(see Fig. 1). For example, the subjects
are asked to choose between Option A=(3.90, 14.50) and Option B=(7.50, 13.00), where Option A allocates 3.90 points for self and 14.50 points for the other and Option B allocates
Table 2
Mean percent of subjects free-riding (Andreoni, 1995)
1 2 3 4 5 6 7 8 9 10 All
Fig. 1. The value orientation circle.
7.50 points for self and 13.00 points for the other. The 24 decision problems are listed in Appendix A.
Social psychologists use theobserved motivational vector, the sum of the individual’s 24 chosen vectors, to classify individual’s value orientations. Subjects with an observed motivational vector lying between degree −112.5 and −67.5 are classified aggressive, subjects with vectors between−67.5 and−22.5 are classified competitive, subjects with
−22.5 and 22.5 are classified as individualistic, subjects with vectors between 22.5 and 67.5 are classified as cooperative, and subjects with vectors between 67.5 and 112.5 are classified as altruistic (see Fig. 1).
3. Experimental design
two experimenters. Each session lasted about one-and-a-half hours. Average earnings per subject were $11.27.
In Experiment I, the Decomposed Game experiment was conducted to assess individual value orientations. Subjects were given instructions and a numbered envelope. A copy of instruction for Experiment I can be found in Appendix B. Subjects were told that their task is to choose between Option A and Option B: each Option lists the points he/she will receive or pay him/herself and the points that the other will receive or pay. At no point did the subjects know what the other subjects were choosing. For each of the 24 decision problems an experimenter provided each subject with a decision form. (The 24 decision problems were presented in a random order from the list in Appendix A.) Subjects made their decisions by circling an option in a statement like “Choose between Option A=(14.5, 3.9) and Option B=(13,−7.5)”. Subjects were told that each point is worth $0.10 in payoff (for example, 14.5 points would earn $1.45.) In each round of decision problem they were instructed to put their decision form in the numbered envelope provided after they have chosen their options. Subjects were told that after all of the 24 decision problems, the second experimenter will collect, shuffle the envelopes, and randomly pair one subject’s form with that of another subject in this experiment. They were told that the second experimenter calculates total earnings for each subject and they will be paid after the completion of Experiment II.
In Experiment II, Andreoni’s framing experiment was replicated. Instructions that are nearly identical to the one used in Andreoni’s experiment (Andreoni, 1995, pp. 14–19) were used. The subjects were given instructions and a packet of 10 ‘Investment Decision Form’, which subjects use to record their decisions to allocate 60 tokens between Individual Exchange Account and Group Exchange Account. The subjects played the game for 10 rounds, and are randomly and anonymously assigned to new groups each round. In each round of the experiment, one experimenter collects an investment decision form from each subject. The experimenter, using a computer, randomly assigns subjects to groups of five, calculates payoffs, and prepares an ‘earnings report’ for each subject. The earnings report tells subjects their investment decision, the group’s investment decision in the public good, and their monetary payoffs. After the second experiment has ended subjects were paid privately their earnings, in cash, from the two experiments.4
4. Experimental results
Of the 200 subjects 131 were classified as individualistic (65.5%): 63 in the positive frame experiment and 68 in the negative frame. Sixty-four subjects were classified as cooperative (32%): 34 in the positive frame and 30 in the negative frame. One subject (in the negative frame) was classified as competitive. Four subjects (3 in the positive frame and 1 in the
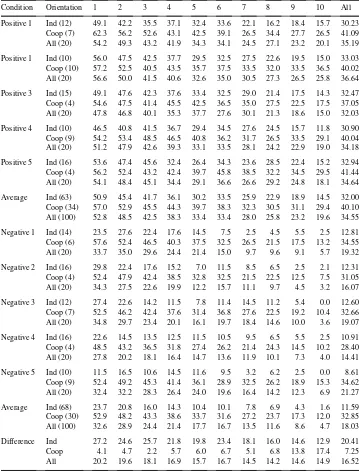
Table 3
Mean percent of tokens contributed to the public good
Condition Orientation 1 2 3 4 5 6 7 8 9 10 All
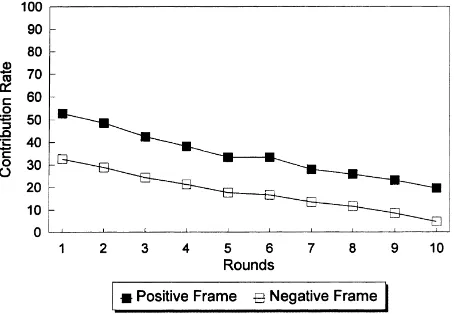
Fig. 2. Mean contribution percentage per condition.
negative frame) appeared to choose randomly in Experiment I.5 This distribution is similar to Offerman et al. (1996).6
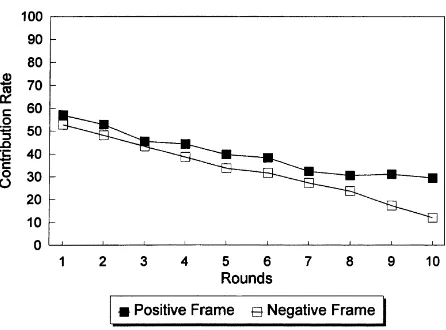
Table 3 lists the percent of the endowment subjects contribute to the public good each round (see also Fig. 2). The first thing to note is that the results from thepositive-frame
condition are very similar to the results of Andreoni’s positive frame experiment. Contri-bution rate starts at 52.8% and decays to 19.6% by round 10. Overall cooperation is about 35%. Comparing this with the negative-frame, there is a considerable difference between the two conditions. Under negative frame, contribution rate starts at 32.6%, which is about 35% below of the positive frame counterpart. Contribution rate declines to only 4.7% by round 10. On average, the subjects in the negative frame condition contribute about only half as much as the positive frame subjects. The current experiment with a bigger number of subjects and more experimental sessions confirms Andreoni’s framing effect.
The statistical significance of the difference is tested using Mann–Whiteny rank-sum nonparametric test. This test is conducted using the mean contribution levels per round as observations. The test statistic isz=3.189. That is, there is a significant difference in contribution rates under the two frame conditions.7
We now look at contribution rates of the subjects with different value orientations in each of the two treatments (positive and negative frames). Under positive frame, the contribution rates of cooperators are consistently higher than those of individualists throughout the
5Following (Offerman et al., 1996, p. 827), random players are those subjects whose consistency measures are below 33%. A choice is consistent if the alternative closest to the observed motivational vector is selected. For example, if the observed motivational vector is (15, 0) and a subject chooses between Option A=(−10.60,−10.60) and B=(−7.50,−13,00), then B would constitute the consistent vector. (p. 823) The overall consistency level for the experiment is about 90%.
6In Offerman et al. (1996) 65% of the subjects were individualistic, 27% were cooperative, 4% were competitive, 1% were aggressive, and 3% were random players.
Fig. 3. Contribution percentage per orientation under positive frame.
Fig. 4. Contribution percentage per orientation under negative frame.
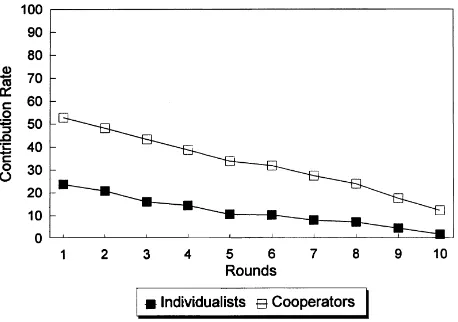
10 rounds, even though, on average, the difference between the two contribution rates of cooperators and individualists is only 7.9% (see Fig. 3). The difference is statistically significant (z=2.771).8Under negative frame, on average, there is a considerable difference (21%) in contribution rates between individualists and cooperators (see Fig. 4). Again, Mann–Whitney test confirms the difference is significant (z=3.598).9
We now turn to the framing effects on subjects with different value orientations. First, for those subjects classified as individualists under the positive frame, contribution rate begins at 50.9% and declines to 14.5% by the end of the experiment. Overall contribution rate is 32%. Comparing this with individualistic subjects in the negative frame, there is a
Fig. 5. Individualists contribution percentage per condition.
Fig. 6. Cooperators contribution percentage per condition.
considerable difference between the two conditions. Under the negative frame, contribution rate of individualists starts at 23.7%, which is not even 50% of the positive frame counterpart (see Fig. 5). On average, the individualists in the negative frame condition contribute only about 36% as much as the positive frame individualists. Again, Mann–Whitney test confirms the difference is significant (z=3.589).10 On the other hand, for those subjects classified
as cooperators under the positive frame, contribution rate begins at 57% and decays to 29.4% by round 10. Overall contribution rate is 40.1%. Comparing this with cooperative subjects in the negative frame, the difference between the two conditions is not as striking as individualists. Under the negative frame, contribution rate of cooperators starts at 52.9% and decays to 12%. Even though there is a considerable difference by round 10 (29.6 versus 12%), on average, the cooperators in the negative frame condition contribute about 82%
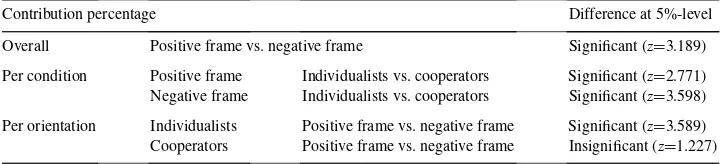
Table 4
Summary of contribution percentage analyses
Contribution percentage Difference at 5%-level
Overall Positive frame vs. negative frame Significant (z=3.189) Per condition Positive frame Individualists vs. cooperators Significant (z=2.771) Negative frame Individualists vs. cooperators Significant (z=3.598) Per orientation Individualists Positive frame vs. negative frame Significant (z=3.589) Cooperators Positive frame vs. negative frame Insignificant (z=1.227)
as much as the positive frame cooperators (see Fig. 6). Mann–Whitney test confirms the insignificant difference (z=1.227).11 Table 4 summarizes the analyses thus far.
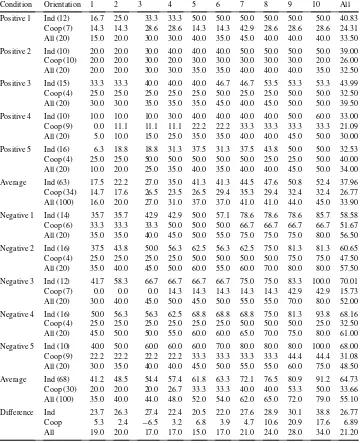
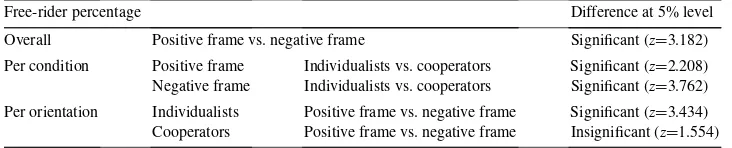
We now look at the effect of framing on the propensity of subjects to free ride. Table 5 lists the percent of subjects choosing the strategy of free riding (contributing zero token to the public good) for each round.12 For all subjects the positive frame starts with 16% of subjects free riding, rising to 45% by round 10, with a 10-round average of 33.9%. On the other hand, the negative frame starts with 35% of the subjects free riding, rising to 79% by round 10, with a 10-round average of 55.1%. Even though, percent of subjects free riding under the negative frame is considerably less than the counterpart of Andreoni’s experiment, on average, percent of negative frame subjects free ride is higher than that of positive frame. The difference between conditions is about 21%, while the difference in Andreoni’s experiments is nearly 30%. The Mann–Whitney test statistic isz=3.182, which is highly significant: the negative frame of the public goods problem significantly increases the percent of subjects contributing zero.
Analyses per condition and per value orientation using the data on percentage of free-riders confirm qualitatively the same effects as those using the data on contribution rates. They are summarized in Table 6.
In summary, when the incentives of the experiments are identical under the two framing conditions, this experiment confirms Andreoni’s significant effect of framing on overall contribution rates. Its effect is most eminent on the subjects with individualistic value orientation, but not on the subjects with cooperative value orientation.
5. Discussion
In order to test the robustness of Andreoni’s (Andreoni, 1995) framing effect in voluntary public good provision experiments, Andreoni’s experiments are replicated with a bigger number of subjects and observations per condition. Given that previous voluntary public good provision experiments by many authors reported a high variance in contribution rates among subjects, it is suspected that some people are more sensitive to framing than others. Following Offerman et al. (1996), I obtained an independent measure of the weight an individual attaches to one’s own welfare to the welfare of other individuals.
11Based on the first round data only,z=1.532.
Table 5
Mean percent of subjects free-riding
Condition Orientation 1 2 3 4 5 6 7 8 9 10 All
Positive 1 Ind (12) 16.7 25.0 33.3 33.3 50.0 50.0 50.0 50.0 50.0 50.0 40.83 Coop (7) 14.3 14.3 28.6 28.6 14.3 14.3 42.9 28.6 28.6 28.6 24.31 All (20) 15.0 20.0 30.0 30.0 40.0 35.0 45.0 40.0 40.0 40.0 33.50 Positive 2 Ind (10) 20.0 20.0 30.0 40.0 40.0 40.0 50.0 50.0 50.0 50.0 39.00 Coop (10) 20.0 20.0 30.0 20.0 30.0 30.0 30.0 30.0 30.0 20.0 26.00 All (20) 20.0 20.0 30.0 30.0 35.0 35.0 40.0 40.0 40.0 35.0 32.50 Positive 3 Ind (15) 33.3 33.3 40.0 40.0 40.0 46.7 46.7 53.5 53.3 53.3 43.99 Coop (4) 25.0 25.0 25.0 25.0 25.0 50.0 25.0 25.0 50.0 50.0 32.50 All (20) 30.0 30.0 35.0 35.0 35.0 45.0 40.0 45.0 50.0 50.0 39.50 Positive 4 Ind (10) 10.0 10.0 10.0 30.0 40.0 40.0 40.0 40.0 50.0 60.0 33.00 Coop (9) 0.0 11.1 11.1 11.1 22.2 22.2 33.3 33.3 33.3 33.3 21.09 All (20) 5.0 10.0 15.0 25.0 35.0 35.0 40.0 40.0 45.0 50.0 30.00 Positive 5 Ind (16) 6.3 18.8 18.8 31.3 37.5 31.3 37.5 43.8 50.0 50.0 32.53 Coop (4) 25.0 25.0 50.0 50.0 50.0 50.0 50.0 25.0 25.0 50.0 40.00 All (20) 10.0 20.0 25.0 35.0 40.0 35.0 40.0 40.0 45.0 50.0 34.00 Average Ind (63) 17.5 22.2 27.0 35.0 41.3 41.3 44.5 47.6 50.8 52.4 37.96 Coop (34) 14.7 17.6 26.5 23.5 26.5 29.4 35.3 29.4 32.4 32.4 26.77 All (100) 16.0 20.0 27.0 31.0 37.0 37.0 41.0 41.0 44.0 45.0 33.90 Negative 1 Ind (14) 35.7 35.7 42.9 42.9 50.0 57.1 78.6 78.6 78.6 85.7 58.58 Coop (6) 33.3 33.3 33.3 50.0 50.0 50.0 66.7 66.7 66.7 66.7 51.67 All (20) 35.0 35.0 40.0 45.0 50.0 55.0 75.0 75.0 75.0 80.0 56.50 Negative 2 Ind (16) 37.5 43.8 50.0 56.3 62.5 56.3 62.5 75.0 81.3 81.3 60.65 Coop (4) 25.0 25.0 25.0 25.0 50.0 50.0 50.0 50.0 75.0 75.0 47.50 All (20) 35.0 40.0 45.0 50.0 60.0 55.0 60.0 70.0 80.0 80.0 57.50 Negative 3 Ind (12) 41.7 58.3 66.7 66.7 66.7 66.7 75.0 75.0 83.3 100.0 70.01 Coop (7) 0.0 0.0 0.0 14.3 14.3 14.3 14.3 14.3 42.9 42.9 15.73 All (20) 30.0 40.0 45.0 50.0 45.0 50.0 55.0 55.0 70.0 80.0 52.00 Negative 4 Ind (16) 50.0 56.3 56.3 62.5 68.8 68.8 68.8 75.0 81.3 93.8 68.16 Coop (4) 25.0 25.0 25.0 25.0 25.0 25.0 50.0 50.0 50.0 25.0 32.50 All (20) 45.0 50.0 50.0 55.0 60.0 60.0 65.0 70.0 75.0 80.0 61.00 Negative 5 Ind (10) 40.0 50.0 60.0 60.0 60.0 70.0 80.0 80.0 80.0 100.0 68.00 Coop (9) 22.2 22.2 22.2 22.2 33.3 33.3 33.3 33.3 44.4 44.4 31.08 All (20) 30.0 35.0 40.0 40.0 45.0 50.0 55.0 55.0 60.0 75.0 48.50 Average Ind (68) 41.2 48.5 54.4 57.4 61.8 63.3 72.1 76.5 80.9 91.2 64.73 Coop (30) 20.0 20.0 20.0 26.7 33.3 33.3 40.0 40.0 53.3 50.0 33.66 All (100) 35.0 40.0 44.0 48.0 52.0 54.0 62.0 65.0 72.0 79.0 55.10 Difference Ind 23.7 26.3 27.4 22.4 20.5 22.0 27.6 28.9 30.1 38.8 26.77 Coop 5.3 2.4 −6.5 3.2 6.8 3.9 4.7 10.6 20.9 17.6 6.89 All 19.0 20.0 17.0 17.0 15.0 17.0 21.0 24.0 28.0 34.0 21.20
Table 6
Summary of free-rider percentage analyses
Free-rider percentage Difference at 5% level
Overall Positive frame vs. negative frame Significant (z=3.182) Per condition Positive frame Individualists vs. cooperators Significant (z=2.208) Negative frame Individualists vs. cooperators Significant (z=3.762) Per orientation Individualists Positive frame vs. negative frame Significant (z=3.434) Cooperators Positive frame vs. negative frame Insignificant (z=1.554)
the warm-glow of doing something good and cold-prickle of doing something bad may not be as significant as in the Andreoni’s previous experiments. Furthermore, the degree of framing effect may be very dependent on the initial distribution of subjects with different value orientation. This might be a reason that the results of other works on framing effects are inconclusive.
A somewhat related work to the current paper is Sonnemans et al. (1998), who found significant framing effects. In their study of framing effects in a public goods versus public bads environment, Sonnemans et al. (1998) also conducted a decomposed game experiment before the public goods/bads game. Even though the average cooperation levels per value orientation and framing condition in their study (Table 2 in their paper) is similar to my experiment, it is rather hard to compare the two findings: first, their public goods/bads ex-periments are conducted in the context of a step-level public good. Second, subjects in their experiments were not regrouped for the entire 20-round game. Thus, in their ‘partners’ en-vironment (Andreoni, 1988), strategic effects may have been compounded in their findings. Furthermore,beforethe public goods/bads experiments, subjects were asked, for example, how much influence they think their choices have on their own and other members.13 This
might have encouraged subjects behave even further strategically.
Even though the current paper focuses on whether some subjects are less sensitive to framing effects than others, it would be useful to discuss a possible explanation for such a difference. Recall that according to the social psychologists’ classification, individualists want to do best for themselves, while cooperators want to try the best for both themselves and the others. Also, note that under the negative frame one’s investment in the private good has direct and negative effects on other members’ payoffs. Since individualists care about only their payoffs, they may have myopically looked at the rate of return from the investment in the private good. That is, individualists in the negative frame may have invested more in the private good (thus, less in the public good) than those in the positive frame, because they wanted to protect themselves from the negative effect of the other members’ investments in the private good. On the other hand, since investments in the private good negatively affect the others in the negative frame, but cooperators care about both themselves and the others, cooperators in the negative frame may not have invested in the private good as much as individualists in the negative frame did.
Before closing, I mention implications of anecdotal evidence offered by Andreoni re-garding the behavioral asymmetry between positive and negative externalities. (Andreoni,
1995, p. 13) states “it seems much more common to hear appeals to the virtue that one’s contribution will do rather than to the tragedies that will occur if a contribution is not made”. He also notes that some advertisements of charitable organization even appeal directly to the good feeling to be had by contributing. Even though Andreoni’s arguments based on his experimental findings seem to be appealing, in light of the current experimental results, such appeals to the virtue that one’s contribution will do may be intended towards those who would not be willing to contribute anything at all otherwise.
Acknowledgements
I am grateful to three anonymous referees for valuable comments and suggestions. I am also grateful to Jim Andreoni for helpful discussions on an earlier version of the paper and to the Conflict Resolution Research Center for funding this project.
Appendix A. 24 Decision problems in decomposed game experiment
1. Choose between Option A=(0, 15) and Option B=(3.9, 14.5) 2. Choose between Option A=(3.9, 14.5) and Option B=(7.5, 13) 3. Choose between Option A=(7.5, 13) and Option B=(10.6, 10.6) 4. Choose between Option A=(10.6, 10.6) and Option B=(13, 7.5) 5. Choose between Option A=(13, 7.5) and Option B=(14.5, 3.9) 6. Choose between Option A=(14.5, 3.9) and Option B=(15, 0) 7. Choose between Option A=(15, 0) and Option B=(14.5,−3.9) 8. Choose between Option A=(14.5,−3.9) and Option B=(13,−7.5) 9. Choose between Option A=(13,−7.5) and Option B=(10.6,−10.6) 10. Choose between Option A=(10.6,−10.6) and Option B=(7.5,−13) 11. Choose between Option A=(7.5,−13) and Option B=(3.9,−14.5) 12. Choose between Option A=(3.9,−14.5) and Option B=(0,−15) 13. Choose between Option A=(0,−15) and Option B=(−3.9,−14.5) 14. Choose between Option A=(−3.9,−14.5) and Option B=(−7.5,−13) 15. Choose between Option A=(−7.5,−13) and Option B=(−10.6,−10.6) 16. Choose between Option A=(−10.6,−10.6) and Option B=(−13,−7.5) 17. Choose between Option A=(−13,−7.5) and Option B=(−14.5,−3.9) 18. Choose between Option A=(−14.5,−3.9) and Option B=(−15, 0) 19. Choose between Option A=(−15, 0) and Option B=(−14.5, 3.9) 20. Choose between Option A=(−14.5, 3.9) and Option B=(−13, 7.5) 21. Choose between Option A=(−13, 7.5) and Option B=(−10.6, 10.6) 22. Choose between Option A=(−10.6, 10.6) and Option B=(−7.5, 13) 23. Choose between Option A=(−7.5, 13) and Option B=(−3.9, 14.5) 24. Choose between Option A=(−3.9, 14.5) and Option B=(0, 15)
Appendix B. Instructions for experiment I
B in a statement like:
“Choose between Option A=(3.9, 14.5) and Option B=(7.5, 13)’’.
Each option specifies points you will receive or pay yourself and points that the ‘other’ will receive or pay. The ‘other’ is another participant with whom you are randomly paired in the experiment. You will not be told each other’s identity or choices during the experiment.
As you make choices, you and the other subject will each earn points. In each decision problem you receive or pay the sum of the points that you assign to yourself and the points that ‘the other’ or ‘our ‘partner’ assigns to you. Every point that subjects earn will be worth 10 cents. For example, if you earn 54 points you will make $5.40 in the experiment. This is illustrated in a couple of examples.
Example: Suppose you and your partner are given the following decision problem: “Choose between Option A=(3.9, 14.5) and Option B=(7.5, 13)’’.
If you choose Option A, you will receive 3.9 points and your partner will receive 14.5 points. On the other hand, if you choose Option B, you will receive 7.5 points and your partner will receive 13 points. Since your payoff and your partner’s payoff depend on both your choice and your partner’s choice, there are four possible scenarios.
Scenario 1. Both you and your partner have chosen Option A.
Under this scenario, you have assigned 3.9 points to yourself and your partner has assigned 14.5 points to you. Thus, you would receive 3.9+14.5=18.4 points, or 18.4×$0.10=$1.84. Similarly, your partner has assigned 3.9 points to him/herself and you have assigned 14.5 points to him/her. Thus, He/She would receive 3.9+14.5=18.4 points, or 18.4×$0.10=$1.84.
Scenario 2. You have chosen Option A and your partner has chosen Option B.
Under this scenario, you have assigned 3.9 points to yourself and your partner has assigned 13 points to you. Thus, you would receive 3.9+13=16.9 points, or 16.9×$0.10=$1.69. Sim-ilarly, your partner has assigned 7.5 points to him/herself and you have assigned 14.5 points to him/her. Thus, He/She would receive 7.5+14.5=22.0 points, or 22.0×$0.10=$2.20.
Scenario 3. You have chosen Option B and your partner has chosen Option A.
Under this scenario, you have assigned 7.5 points to yourself and your partner has assigned 14.5 points to you. Thus, you would receive 7.5+14.5=22.0 points, or 22.0×$0.10=$2.20. Similarly, your partner has assigned 3.9 points to him/herself and you have assigned 13 points to him/her. Thus, He/She would receive 3.9+13=16.9 points, or 16.9×$0.10=$1.69.
Scenario 4. Both you and your partner have chosen Option B.
Under this scenario, you have assigned 7.5 points to yourself and your partner has assigned 13 points to you. Thus, you would receive 7.5+13=20.5 points, or 20.5×$0.10=$2.05. Similarly, your partner has assigned 7.5 points to him/herself and you have assigned 13 points to him/her. Thus, He/She would receive 7.5+13=20.5 points, or 20.5×$0.10=$2.05.
Here is another example.
Example: Suppose you and your partner are given the following decision problem: “Choose between Option A=(14.5, −3.9) and Option B=(13,−7.5)’’.
pay 7.5 points. Since your payoff and your partner’s payoff depend on your choice and your partner’s choice, there are four possible scenarios.
Scenario 1. Both you and your partner have chosen Option A.
Under this scenario, you have assigned 14.5 points to yourself and your partner has as-signed−3.9 points to you. Thus, you would receive 14.5−3.9=10.6 points, or 10.6×$0.10=
$1.06. Similarly, your partner has assigned 14.5 points to him/herself and you have as-signed −3.9 points to him/her. Thus, he/she would receive 14.5−3.9=10.6 points, or 10.6×$0.10=$1.06.
Scenario 2. You have chosen Option A and your partner has chosen Option B.
Under this scenario, you have assigned 14.5 points to yourself and your partner has assigned−7.5 points to you. Thus, you would receive 14.5−7.5=7.0 points, or 7.0×$0.10=
$0.70. Similarly, your partner has assigned 13 points to him/herself and you have assigned
−3.9 points to him/her. Thus, He/She would receive 13−3.9=9.1 points, or 9.1×$0.10=
$0.91.
Scenario 3. You have chosen Option B and your partner has chosen Option A.
Under this scenario, you have assigned 13 points to yourself and your partner has assigned
−3.9 points to you. Thus, you would receive 13−3.9=9.1 points, or 9.1×$0.10=$0.91. Similarly, your partner has assigned 14.5 points to him/herself and you have assigned−7.5 points to him/her. Thus, he/she would receive 14.5−7.5=7.0 points, or 7.0×$0.10=$0.70.
Scenario 4. Both you and your partner have chosen Option B.
Under this scenario, you have assigned 13 points to yourself and your partner has assigned
−7.5 points to you. Thus, you would receive 13−7.5=5.5 points, or 5.5×$0.10=$.55. Similarly, your partner has assigned 13 points to him/herself and you have assigned−7.5 points to him/her. Thus, he/she would receive 13−7.5=5.5 points, or 5.5×$0.10=$.55.
You are encouraged to use your calculator, or one provided by the experimenter. You will be asked to make 24 choices like the examples we just discussed. In each round, you will be given a decision form. After you make your decision, put your decision form in the yellow envelope provided. When all participants finish making their decisions, a new decision form will be given to you for the next decision.
After all 24 decision rounds have been finished, we will collect the yellow envelopes. We will shuffle them and randomly pair your envelope with that of another subject in this experiment.
We will then add the points that you assign to yourself and the points that your partner assigns to you in the 24 decisions. We will determine your monetary earnings, where every point that you earn will be worth 10 cents. These monetary earnings will be placed in your yellow envelope, which will be sealed and returned to you after the second experiment has ended.
You are not allowed to speak with other participants. If you have a question, please raise your hand.
Thank you very much. Good Luck!
References
Andreoni, J., 1995. Warm-glow versus cold-prickle: the effects of positive and negative framing on cooperation in experiments. Quarterly Journal of Economics, 1–21.
Brewer, M.B., Kramer, R.M., 1986. Choice behavior in social dilemmas: effects of social identity, group size, and decision framing. Journal of Personality and Social Psychology, 543–549.
Davis, D., Holt, C., 1992. Experimental Economics, Princeton University Press, Princeton, NJ.
Fleishman, J., 1988. The Effects of decision framing and other’s behavior on cooperation in a social dilemma. Journal of Conflict Resolution, pp. 162–180.
Issac, M., Walker, J., Thomas, S., 1985. Divergent evidence on free riding: an experimental examination of some possible explanations. Public Choice, 113–149.
Issac, M., Walker, J., 1988. Group size effects in public goods provision: the voluntary contributions mechanism. Quarterly Journal of Economics, 179–199.
Ledyard, J., 1995. Public goods: a survey of experimental research. In: Kagel, J., Roth, A. (Eds.), Handbook of Experimental Economics. Princeton University Press, Princeton, NJ.
Liebrand, W.B.G., 1984. The effect of social motives, communication and group size on behaviour in an n-person multi stage mixed motive game. European Journal of Social Psychology, 239–264.
Messick, D., Allison, S., Samuelson, C., 1993. Framing and communication effects on group members’ responses to environmental and social uncertainty. In: Maital, S., Maital, S.L. (Eds.), Economics and Psychology, E. Elgar, 1993.
Offerman, T., Sonnemans, J., Schram, A., 1996. Value orientations, expectations and voluntary contributions in public goods, it Economic Journal, 817–845.
Rutte, C., Wilke, H., Messick, D., 1987. The effects of framing dilemmas as give-some or take-some games. British Journal of Social Psychology, 103–108.