11 (2000) 413 – 431
International specialisation and growth
Bruno Amable
Uni6ersity of Lille II and CEPREMAP,142Rue du Che6aleret,75013Paris,France Received 3 March 2000; received in revised form 12 July 2000; accepted 30 August 2000
Abstract
Does inter-industry specialisation promote growth, for instance through the exploitation
of economies of scale and/or comparative advantage? Is a certain type of specialisation a
positive factor for growth? This paper seeks to answer such questions on the relationship between foreign trade and growth. Three indicators of foreign trade are considered, inter-industry specialisation, an index of trade dissimilarity and a comparative advantage in electronics, and are introduced as explanatory variables in growth regressions for 39 countries over 1965 – 1990. The results show that inter-industry specialisation and compara-tive advantage in electronics are a posicompara-tive influence on productivity growth. Furthermore, education seems to act in complementarity with trade specialisation, reinforcing the positive effects of electronics, and interacting with trade dissimilarity for a detrimental effect on growth. © 2000 Elsevier Science B.V. All rights reserved.
Keywords:Growth; Inter-indusry specialisation; Foreign trade
1. Introduction
Foreign trade and growth are interrelated through different channels. For Kaldor (1981) Thirlwall (1979) or Fagerberg (1988), international specialisation and growth are related through endogenous technical change. A certain pattern of international specialisation, which manifests itself through particular values for the income and price elasticities of foreign trade, leads to a certain pace of demand growth, which itself induces a certain rate of productivity improvement, which in turn fosters growth through a mechanism of cumulative causation. A direct consequence is that some patterns of international specialisation, associated to high income elasticities for exports for instance, are more favourable for growth than others.1
1See also Amable (1993).
The relation between trade and growth has also been studied by new growth theory. As argued in Grossman and Helpman (1991), many of the interactions in the global economy generate forces that may accelerate growth: the exchange of technical information and more generally the diffusion of knowledge between technologically advanced countries/sectors/firms and the followers. Trade in com-modities may have implications for technical progress and growth, indirectly by facilitating the exchange and generation of ideas, as well as directly, by facilitating access to a wider set of goods which will favour productivity growth. In the context of an innovation-based endogenous growth model and apart from any scale effect, trade may prevent, duplication in research and promote the differentiation of innovations (Rivera-Batiz and Romer, 1991), enhancing productivity and/or con-sumers’ utility.
The above theoretical considerations have had some influence on growth empir-ics. Some cross-country growth regressions have included trade variables as ex-planatory factors, in order to account for the effect of openness to trade on per capita growth. One generally finds a moderate positive relationship between growth and the ‘openness ratio’ (defined as the ratio of exports, imports or the sum of the two over GDP).2After controlling for other effects, one finds that open economies
have benefited from faster growth rates than countries where foreign trade plays a less important, role. However, some doubts have been expressed regarding the robustness of the results and the validity of the conclusions.3 Other papers have
focussed on trade policy variables and the potentially detrimental effects of trade restrictions on growth. Distortions to trade are usually negatively correlated with growth.4The correlations do not imply that causality runs from openness to growth
since high growth countries may be led to trade more or adopt trade facilitating policies, so that the actual impact of trade or trade policies on growth is difficult to assess. Frankel and Romer (1996) use an instrumental variable approach to correct for the endogeneity of trade5and find a substantial positive effect of the trade share
on GDP growth, lending some support to the view that openness to trade implies a higher growth rate. However, Rodriguez and Rodrik (1999) are more sceptical on the negative relationship between trade barriers and growth and concludes that the positive effects of trade openness on growth have been overstated.
From a theoretical point of view, not every effect of international trade is necessarily beneficial to growth. Openness plays also a role in the allocation of resources such as R&D and skilled labour at a world level. If international specialisation diverts a country from research and/or technology intensive indus-tries, a country’s output may grow more slowly in an open economy context than
2Levine and Renelt (1992). 3Edwards (1993).
4DeLong and Summers (1991), Ben-David (1993).
in autarchy;6
a dynamic loss may, in the long run, offset a static gain from specialisation. Causality between comparative advantage and growth runs both ways, in a cumulati6e causation between the rate of growth and the pattern of
specialisation, as in the Kaldorian approach mentioned above. The evolution of international specialisation is constrained by growth, comparative advantage is endogenously determined. A typical example is that international trade leads some countries to specialise in activities with a slow growth potential. Hence, the negative link between specialisation in agriculture and economic development emphasised in the model of Matsuyama (1992).
In this context, the composition of foreign trade matters, at least, as much as openness to trade. Busson and Villa (1997) have introduced variables describing the pattern of international trade into cross-country growth regressions. The positive effect of trade on growth must then be qualified. Trade is beneficial to growth when a country is specialised in industries where world demand is strong. Specialisation in itself is not necessarily associated to a higher growth rate.
This paper proposes an empirical investigation of specialisation on growth and differs from the approach of Busson and Villa by the following aspects. As Durlauf and Johnson (1995) have shown, the hypothesis of a common growth model for a very large sample of country is strongly rejected in favour of the hypothesis of different convergence clubs. In particular, African countries follow a very different pattern from industrialised countries. As a consequence, it is dubious that one should draw any policy conclusions from results based on too large a sample of countries, the growth problems facing Europe are fundamentally different from those facing Africa. This calls for the use of a more restricted sample of countries than what is usually found in most convergence studies. In what follows, only a reduced sample of 39 countries will be considered, including OECD as well as some developing Asian and Latin American countries. Thus, the sample includes devel-oped industrialised countries along with fast growing Asian countries and other NICs.
A panel data set will be used for the estimations, taking into account six 5-year period from 1960 – 1965 to 1985 – 1990, instead of resorting to a cross country data set as in the majority of papers on convergence. This approach exploits the time-series, as well as the cross-section dimension of the data. This allows for a dynamic specification of the growth equations, which are estimated with a gener-alised method of moments (GMM) which takes into account the endogeneity of some of the explanatory variables.
Finally, the competition between industrial countries is more pronounced in industries with a high technology intensity. In the recent years, international competition in electronics (for instance computers and telecommunications) has been at the centre of many economic and policy debates, particularly in Europe.7
If electronics is a ‘strategic’ sector, does the relative weakness of Europe in this area
imply a slower long-term growth? An indicator of comparative advantage in electronics is introduced in a growth regression in order to check whether a specialisation in this industry boosts growth. Another topic is whether international specialisation interacts with other determinants of growth. In particular, the effects of education on growth are assessed both separately and in interaction with the foreign trade variables. A less fundamental difference with Busson and Villa is that the endogenous; variable considered in this paper is real GDP per worker instead of real GDP per capita.
The paper is organised as follows. We first describe the variables reflecting the pattern of trade specialisation that will be introduced in the growth regressions. The estimated model is then presented in Section 3 and the results of the estimations are discussed in the following section. A brief conclusion is presented in Section 5.
2. Some indicators of trade specialisation
More precisely than the effects of international trade on growth, this paper seeks to assess the consequences of international specialisation. This calls for the imple-mentation of specific variables. Among the three specialisation indicators consid-ered by Busson and Villa (1997), two will be considconsid-ered in this paper: the variables accounting for inter-industry specialisation and trade dissimilarity. A third indica-tor, not considered by Busson and Villa, reflecting comparative advantage in electronics, will be added. The first two variables reflect the structure of exports and imports of a country, using detailed industry level data.8The third variable is based
on the relative trade surplus of a particular activity, electronics, compared to the aggregate trade surplus.
2.1.Inter-industry specialisation
Interindustry specialisation may be said to be very high, if a country’s trade structure can be characterised by the coexistence of clearly defined ‘export’ and ‘import’ industries, irrespective of the aggregate trade surplus. A simple indicator of interindustry specialisation is the Michaely index, defined as:
Ij=
1 215%i5N
)
XijX.j
−Mij M.j
)
(1)05Ij51.Xijis the exports of countryjin industry i,i [1,N],X.j=l5i5NXijis
total exports of country j. Imports M are defined accordingly. The higher Ij, the
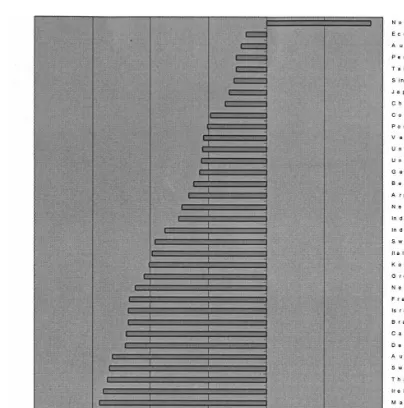
more trade balances are dissimilar between industries, which means that interindus-try specialisation is more acute. The values of this index for most of the OECD countries are around 0.4, with the exception of Japan, New Zealand or Australia which exhibit a somewhat higher value (0.7 – 0.8), and France, Belgium or the UK
8Use is made of the CHELEM database, available at the Observations des Sciences et des Techniques,
Fig.
1.
Evolution
of
the
inter-industry
trade
indicator;
1965
–
which are characterised by a lower value (around 0.2 – 0.3). The case of Japan is well known in the literature on international specialisation.9 Latin American
countries generally exhibit a strong inter-industry specialisation, as generally do less developed countries. Asian countries in general seem to be strongly spe-cialised.
Over 1965 – 1990, interindustry specialisation as measured by this index de-creased for every country in the sample except Norway (Fig. 1). This general pattern of decrease in interindustry specialisation is in line with what most ‘modern’ international trade theories insist on, i.e. the rising importance of in-traindustry specialisation as a consequence of increasing product differentiation. The decrease is modest for Japan, Australia, Singapore or Taiwan, but more sizeable for most continental European countries or Korea. Situation of Ger-many, UK and US is intermediate (Fig. 1).
2.2.Trade dissimilarity indicator
If trade specialisation allows to benefit from economies of scale or exploit a comparative advantage, one may expect that an increased specialisation should by itself lead to a higher growth rate. However, the pattern of specialisation may prove to be detrimental to growth, if specialisation is oriented toward slow growth industries, or more generally when the trade pattern of a country is at odds with that of international demand. Thus, the pattern of international de-mand matters in order to appreciate the specialisation of a country and its potential consequences on growth. An indicator reflecting the adequacy of a country’s trade pattern with international demand is the index of trade dissimi-larity, defined as:
Aj=
1 215%i5N
)
XijX.j
−Xi. X..
)
(2)05Aj51. The trade dissimilarity indicator is higher when a country exports
commodities in an industry, where international demand is relatively low. Aj is
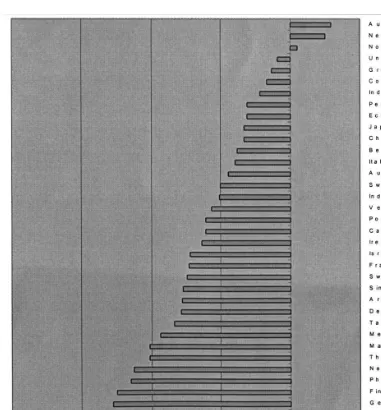
null when the export structure of a country matches exactly international de-mand. Large and medium-sized OECD countries have a lower dissimilarity index than less developed and smaller countries. No European country has an index of trade dissimilarity over 0.6, and nine countries of the Union are under 0.4. Latin American country show a trade pattern which is markedly dissimilar to the bulk of international trade, and Asian countries are in the mid-range values for this indicator.
This indicator decreased over the period considered for every country except the Netherlands, which has a relatively low value for this indicator, Norway and Australia (Fig. 2). Some countries have experienced large modifications of their trade structure towards the average pattern of world trade Denmark, Taiwan,
Fig.
2.
Evolution
of
the
trade
dissimilarity
index;
1965
–
Mexico, Thailand, New Zealand, the Philippines, Finland, Germany, Korea, Turkey, the UK, Spain and Brazil. One should then expect a positive effect of these transformations in their trade pattern on growth.
2.3.Comparati6e ad6antage in electronics
Electronics is the near-perfect example of a high-growth, ‘pervasive’, technol-ogy intensive activity. There are many reasons that may lead to believe that electronics in general, and information technology based industries in particular, are ‘strategic’ activities.10 Following its fast growth in the past decades,
electron-ics now employs more people than the automobile industry in the US or Japan. Information and Communication Technology (ICT) goods were the fastest grow-ing categories in international trade over the 1980 decade (Freeman, 1995). These activities have enjoyed fast rates of technological progress which, considering the ‘pervasive’ aspect of ICT, has diffused to virtually every industry and service. Since this pervasive aspect is important, rather than consider the electronics industry per se, it seems more interesting to include upstream and downstream activities in the broadly defined electronics activity considered here. This is why we resort to using the electronics ‘filie`re’ defined by CEPII. This electronicsfilie`re includes, besides computers and telecommunication equipments, consumer elec-tronics, electronic components, watches, measurement instruments and optical instruments. Therefore, goods that include electronics are also present in the CEPII definition Fig. 2.
Competitiveness in electronics will be appreciated with the help of the compar-ative advantage indicator defined by CEPII:
Lij=
trade. Lij is higher when the trade surplus in industry i, taken relative to theGDP of country j, is higher than the relative trade surplus for all commodities, considering the weight of industry j in country j’s foreign trade. This effect is corrected for the weight that industry j has in international trade relative to a benchmark year.
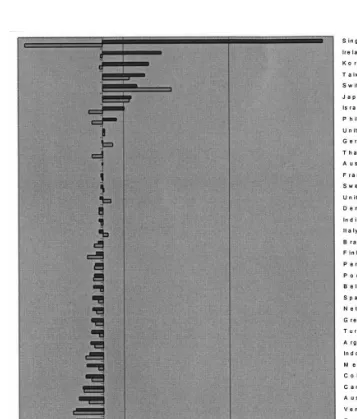
Comparative advantage in electronics varies widely between the countries of our sample, with Switzerland,11 Japan and East-Asian countries having a high
comparative advantage, whereas smaller less industrialised OECD (Australia or New Zealand) and Latin American countries exhibit a comparative disadvantage in that industry. Taking apart the special case of Ireland, the European Union countries show at best a limited comparative advantage, and more often a disad-vantage.
10See Archibugi and Michie (1998), Fagerberg, et al. (1997).
11The good position of Switzerland is based on its competitiveness in watches and measurement
Comparative advantage in electronics has varied sensibly over the period consid-ered for some countries (Fig. 3). Singapore, Ireland and Korea, as well as, to a lesser extent, Israel and the Philippines, have seen their initial comparative disad-vantage turn into a comparative addisad-vantage. Most European countries have seen their limited initial comparative disadvantage slightly augment. East Asian coun-tries’ trade pattern’s evolution is clearly different from other councoun-tries’ with respect to this indicator.
3. The model
The model tested in this paper is inspired from the equations derived from the ‘augmented-Solow’ growth model which has been the workhorse of most of the papers on growth empirics.12
The typical cross-country catch-up equation can be written under the following form:
ln (Yit)−ln (Yit−r)=b·ln (Yit−r)+g·Wit+hi+it (4)
where Yit is per-capita GDP or, more accurately, productivity for country i in
periodt,Witis a row vector of determinants of economic growth and itis an error
term. b is the convergence coefficient, expected to be negative according to the neo-classical growth model. The variables inWitandhiare proxies for the long-run
level of productivity Fig. 3. Eq. (4) can be rewritten as:
yit=b0 ·yit−r+g·Wit+it (5)
whereb0 =1+b and yit=ln (Yit).
Eq. (5) is a dynamic equation, with a lagged dependant variable on the right-hand side. An estimator for such dynamic models applied to panel data has been proposed by Arellano and Bond (1988, 1991), based on the generalised method of moments (GMM). Their GMM estimator exploits all the linear moment restrictions that follow from the assumption of no serial correlation in the errors, in an equation with individual effects, lagged dependant variables and no strictly exoge-nous variables. This estimator has been applied to growth regressions on a panel of countries by Caselli et al. (1995) who found that their estimation of a growth regression gave a higher value for the convergence coefficientbthan usually found in the empirical literature on growth.
The use of the GMM estimator also allows to deal with the issue of endogeneity of the regressors. From a theoretical point of view,13 most of the variables usually
included in Wit, such as investment, and education, are endogenous. Empirical
studies seem to partly confirm the endogeneity of such variables.14
Likewise, foreign
12See Barro and Sala-i-Martin (1995) for an exposition of convergence equations. 13Reference is made here to endogenous growth models.
trade indicators can be considered as endogenous in a framework where the state of technology is not considered as given. Comparative advantage is not so much the product of endowments than the result of particular research policies, productivity differentials, etc., and therefore, evolves with growth.
Differencing Eq. (5) gives:
yit−yit−r=b0 ·(yit−r−yit−2r)+g· (Wit−Wit−r)+(it−it−r) (6)
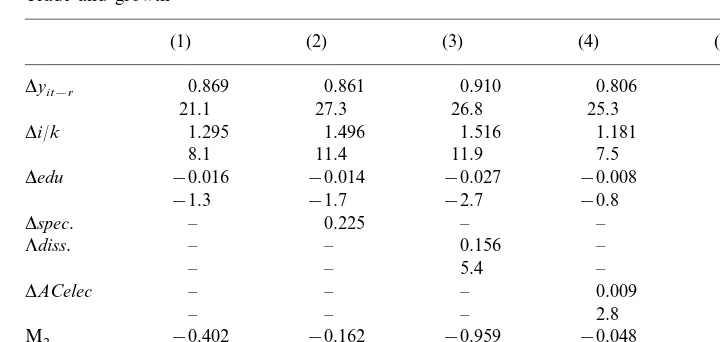
Table 1
Trade and growtha
(1) (2) (3) (4) (5)
0.869 0.861 0.910 0.806 0.855
Dyit−r
21.1 27.3 26.8 25.3 33.3
Di/k 1.295 1.496 1.516 1.181 1.592
8.1 11.4 11.9 7.5 17.9
Dedu −0.016 −0.014 −0.027 −0.008 −0.015
−1.3 −1.7 −2.7 −0.8 −2.4
– 0.225
Dspec. – – 0.122
– – 0.156
Ldiss. – 0.067
– – 5.4 – 1.4
DACelec – – – 0.009 0.029
– – – 2.8 5.9
−0.402 −0.162
M2 −0.959 −0.048 0.036
Sargan test 20.7 (18) 27.8 (23) 25.3 (23) 28.3 (23) 29.1 (27)
No. of obs. 117 117 117 117 117
aDependant variable,y
it−yit−r. T-statistics are given under the value of the estimated coefficients. Differencing allows to drop the individual effects. The above equation will be estimated in what follows, with different specifications for the explanatory variables Wit. Data sources are described in Appendix A.
4. The results
The dependant variable isyit−yit−r, the first difference of the logarithm of real
GDP per worker,r=5. Following the ‘augmented Solow’ model, the most immedi-ate variables considered for inclusion as explanatory variables in a growth regres-sion are education and investment. The first education variable to be considered in this paper is the average number of years of secondary schooling of the total population. The investment variable is the ratio of investment to capital stock, i.e. the renewal rate of the capital stock. The inclusion of this term in the regressions can be justified on several grounds. First, it comes as a near-direct consequence of a specification of a production function with capital included as a production factor. Second, it could be interpreted as a consequence of a technical progress function in the spirit of Kaldor (1957) or Kaldor and Mirlees (1962). When technological progress is embodied in equipment, the renewal rate of capital influences positively the rate of productivity growth. More generally, the investment rate (or its variation) can be interpreted as a proxy for various factors influencing technical progress, either learning by doing15
or innovation. It would have been interesting to include more specific variables representing innovation or research and development, but data availability prevented a more precise investigation of the effects of technical progress.
The first results are presented in Table 1. Regression (1) shows that the coefficients on the lagged productivity and investment variables turn up with the expected sign. Since b0 is positive and inferior to 1, b is negative, so that a (conditional) convergence effect is present. The coefficient for the education vari-able is neither significant nor has the expected sign. One notices that the impact of the investment variable is quite strong. A difference of one percentage point in the investment to capital stock ratio gives a difference of over one percentage point in the annual productivity growth rate.
Regression (2) adds the international specialisation variable. The coefficient for that variable is positive and significant. This implies that the mere fact of being specialised in foreign trade is good for productivity growth, irrespective of the precise specialisation that the country has adopted. This contrasts with the results found by Busson and Villa (1997) with cross-country regressions for 98 countries, where the specialisation variable had a significantly negative effect on growth. Regression (3) includes the dissimilarity variable, which surprisingly appears with a significant, positive coefficient. This is again at odds with the results of Busson and Villa, who found a significantly negative impact of trade dissimilarity in their estimations. One notices that the education variable now significantly contributes negatively to productivity growth. This counter-intuitive result sometimes appear when one uses panel data instead of a cross-section of countries.16 Basically,
education levels have increased in all countries over the period considered, but relatively more in some developed countries than in most developing countries. Therefore, this variable does not exhibit a convergence favouring pattern, which explains its lack of significance or its negative contribution.
Regression (4) shows that a comparative advantage in electronics seems to have a positive effect on productivity growth. This complements the findings of regres-sion (3). If specialisation matters, it does not imply that any specialisation is equivalent for growth. Regression (5) tests the inclusion of all three foreign trade variables. The effects of the extra variables on the coefficients for lagged productiv-ity differentials, investment and education variables are minor. Both the specialisa-tion and the comparative advantage in electronics variables turn up with positive and significant coefficients. Once the effect of specialisation is controlled for, a comparative advantage in electronics appears as a positive influence on productivity growth. The trade dissimilarity variable fails to appear with a significant coefficient. The seemingly negative impact of education on productivity growth is somewhat unsatisfactory. It runs against most growth theories as well as common sense. One must nevertheless not forget that the sample of countries excludes most third world countries where one should expect the marginal impact of an increase in the education level to be the largest. Among the restricted sample of countries chosen here, a rather crude indicator of education such as the one used so far may not be enough to reflect the efficiency of the different national education and training systems. It is possible to exhibit a positive effect of education on productivity
growth when one takes an alternative indicator. Regressions in Table 2 include the percentage of the population that has completed secondary schooling as the education variable. This time, the contribution of education is significantly positive in most cases, but has a somewhat limited impact on the growth of productivity. The dissimilarity variable turns up with a significant positive sign. The positive influence of a specialisation in electronics is confirmed.
In order to assess more clearly whether the effect of education on productivity growth can be positive, the alternative variable ( the percentage of the population that has completed secondary schooling) is kept in the following regressions. Regression (1) in Table 2 shows that, when included alone, the effect of this variable is positive but not significant. Attempts to include other education vari-ables (higher education for instance) were not met with more success. As in the previous regressions, specialisation and a comparative advantage in electronics exert a positive influence on productivity growth.
It may be so that education has not only a direct effect on productivity growth, but an indirect effect as well. This indirect effect may travel through many channels, but one is of particular interest here, the channel of international specialisation. A high level of schooling may exert positive or negative effects in interaction with a certain pattern of international specialisation. For instance, a specialisation ori-ented towards electronics may be more or less beneficial to growth according to the level of education of the labour force. This latter indicator would in fact partly reflect the ‘quality’ of the specialisation. in electronics, for instance, whether a high comparative advantage simply reflects the domestic presence of many assembly lines of electronics goods. The nature of the electronics activities present in one
Table 2
M2 0.665 0.322 0.509 0.857
29.7 (26) 29.7 (29)
Sargan test 28.3 (28) 26.9 (28) 29.4 (27)
117 117
Number of observations 117 117 117
aDependant variable,y
i−yit−,r.T-statistics are given under the value of the estimated coefficients. *
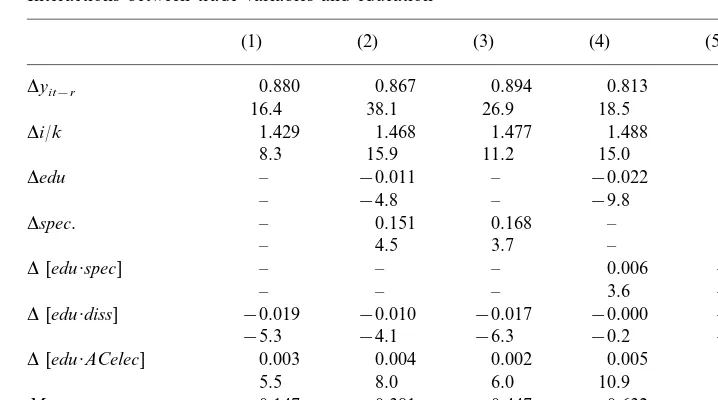
Table 3
Interactions between trade variables and educationa
(1) (2) (3) (4) (5)
Dyit−r 0.880 0.867 0.894 0.813 0.907
16.4 38.1 26.9 18.5 28.5
Di/k 1.429 1.468 1.477 1.488 1.447
8.3 15.9 11.2 15.0 13.0
Dedu – −0.011 – −0.022 –
– −4.8 – −9.8 –
Dspec. – 0.151 0.168 – –
– 4.5 3.7 – –
D[edu·spec] – – – 0.006 −0.004
– – – 3.6 −1.8
D[edu·diss] −0.019 −0.010 −0.017 −0.000 −0.007
−5.3 −4.1 −6.3 −0.2 −2.0
D[edu·ACelec] 0.003 0.004 0.002 0.005 0.002
5.5 8.0 6.0 10.9 5.4
M2 −0.147 0.381 0.447 0.632 −0.454
Sargan test 22.9 (22) 23.6 (27) 27.5 (25) 24.9 (27) 28.7 (27)
Number of observations 117 117 117 117 117
aDependent variable,y
i−yit−r.
country is expected to have influences on the type of positive spillovers associated with these activities. Low skill-intensive activities may reasonably be expected to give less positive growth spillovers than high skill-intensive ones. Likewise, one may expect spillovers associated with electronics or another type of specialisation to be all the more influential for productivity growth that the population or the labour force has a high level of schooling.17 Therefore, it seems interesting to take into
account explicitly the interactions between the level of education of the labour force and international specialisation indicators.
Regressions in Table 3 show the effects of interaction between education and trade variables on productivity growth. A trade structure dissimilar to World trade structure is a negative factor for growth when associated with a high level of schooling of the population. In fact, it is only in complementarity with a high level of schooling that trade dissimilarity appears to have negative effects on productivity growth. Likewise, a higher level of education reinforces the positive effects of a trade specialisation oriented towards electronics. The specialisation variable (the Michaely index) has a positive effect except in regression (5), when the education variable is taken out of the regression. It seems, therefore, difficult to assess the precise effect of trade specialisation on productivity growth without specifying more precisely the pattern of specialisation.
17This is related to the discussion concerning ‘institutional complementarity’ and the notion of
5. Conclusion
This paper has tested the impact of the pattern of foreign trade on growth using three different variables reflecting the pattern of international specialisation of a country. The results are that international specialisation matters for growth. Countries whose foreign trade structure is more specialised at the inter-industry level have enjoyed a faster productivity growth than less specialised countries. This would tend to give support to the traditional argument, concerning the gains from trade and the consequences on resources reallocation. This result differs from the findings of Busson and Villa (1997), who found a negative influence of inter-indus-try specialisation on growth. Their study concerns a large and heterogeneous sample of 98 countries and they perform cross-country OLS regressions, whereas this paper considers a smaller sample of 39 countries using the time series dimension with a dynamic panel data estimator, accounting for endogeneity of the regressors. Controlling for other effects, trade specialisation has a positive influence on growth.
The positive influence of inter-industry specialisation does not mean that one pattern of specialisation is as good as any. The issue of the growth impact of a specialisation in electronics has haunted many debates on technology and trade policies in Europe over the past decade. Since Europe in general appears to lack a clear comparative advantage in electronics and ICT, the risk is to be stuck in a specialisation in activities which have a low growth prospect and to experience delay in implementing the new production techniques which includes these new technologies. This debate may be simply summed up in the non equivalence between ‘make’ and ‘buy’ as far as new technologies are concerned. One notices for instance that the diffusion of new technologies is very often faster in countries which produce these technologies.
The empirical results presented in this paper make a modest contribution to this debate by showing that countries which are more specialised in electronics, or more accurately, which have a comparative advantage in electronics, have benefited from a productivity growth advantage over countries with a comparative disadvantage in that group of industries. The estimations reported in this paper imply that the advantage enjoyed by countries with a comparative advantage in electronics could be as high as 0.5 percentage points for the annual rate of productivity growth. This lends some support to the view that electronics is a ‘strategic’ branch of activity. In this respect, European countries are at a disadvantage when compared with Japan and East-Asian countries.
effects in interaction with a trade structure dissimilar to that of world trade. Without stretching the argument too far, this result would call for caution in the implementation of industrial policy in favour of electronics. The presence of other influencing factors, in this case a sufficiently high level of education of the workforce, may be a prerequisite for the possible success of such policies.
Acknowledgements
The author would like to thank Bart Verspagen, the participants of the Confer-ence on ‘Economic Growth, Trade and Technology’ in Eindhoven, and Lilas Demmou for useful comments on a previous draft of the paper. The usual caveats apply.
Appendix A
Data sources. List of countries. The sample consists of:
22 OECD countries: US, Japan, Austria, Belgium, Denmark, Finland, France, Germany, Greece, Ireland, Italy, The Netherlands, Norway, Portugal, Spain, Switzerland, Sweden, Mirkey, United Kingdom, Australia, New Zealand and Canada. (14 of them belong to the European Union).
Eight Latin American countries: Mexico18, Argentina, Brazil, Chile, Columbia, Ecuador, Peru and Venezuela.
Eight Asian countries: Korea19, Singapore, Taiwan, India, Indonesia, Philip-pines, Malaysia and Thailand.
Israel.
Dummy variables distinguish the countries in three groups: OECD countries and Israel, Latin American countries, Asian countries.
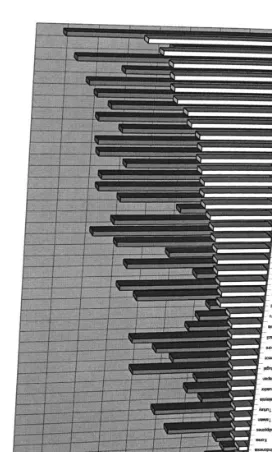
The evolution of real GDP per worker is shown in the above Figure, where countries are ranked according to their level in 1960. The catch-up of European countries can be seen mostly on the right hand side of the figure, where it appears that gaps between countries and the USA have been partially bridged. The left hand side of the figure shows more diversity in the evolution of countries, some having experienced fast growth while others have lagged behind. The change in (economic) hierarchy is clearly noticeable.
List of variables.
18One may note that Mexico belongs to the OECD, so that a total of 23 countries from the OECD
are in the sample. However, it seemed more accurate to classify it as a Latin American country.
Fig.
4.
Real
GDP
per
capita
at
11985
prices
in
1980
and
y, real GDP per worker (1985 international prices), from the Penn World Tables version 5.6.
i/k, Investment to capital stock (constant 1987 local prices), from the data base of Nehru and Dhareshwar (1993).
edu, Either the average years of secondary schooling of the total population or the percentage of ‘secondary schooling complete’ in the total population, from the data base of Barro and Lee (1993).
noedu, log of 1+the percentage of ‘no schooling’ in the total population, from the data base of Barro and Lee (1993).
spec, diss and ACelec are defined in the text, computed from the CHELEM international trade database (CEPII). Data start in 1967. For the 1960 – 1965 period, the value of the indicator in 1967 was used as a proxy. The average value over 1967 – 1970 was used as a proxy for the 1965 – 1970 period.
Estimation.
The equation estimated in this paper is the following:
yit−yit−r=b0 ·(yit−r−yit−2r)+g·(Wit−Wit−r)+(it−it−r) (7)
There is no country-specific effect anymore with differentiation. The two-step method of Arellano and Bond (1988) constructs an instrumental variable matrix using all the linear moments restrictions. Lagged values of the dependant variable and the explanatory variables are be used as instruments. yi0 and Wi0 are valid
instruments for the equation where y2r−yir, is estimated. Then, yi0, Wi0, yir, and
Wir, can be used in the equation where y3r−y2r, is estimated, etc.
Them2 statistic is based on the residuals from the first-difference equation and
tests for second order serial correlation. First differencing induces first-order serial correlation even when the error terms in level is a white noise disturbance. The validity of the instruments is checked with the help of a Sargan test of overidentify-ing restrictions.
The instrument set used for the estimations includes all available linear moment restrictions involving lagged values of the dependant variable in addition to time dummies and dummies distinguishing OECD countries, Latin American countries, Asian ‘Tigers’ (Korea, Singapore and Taiwan), other Asian countries and non-OECD European countries. In addition, a subset of valid moment restrictions involving lagged explanatory variables (investment ratio, education variable or trade specialisation variables) is added. None of the explanatory variables are treated as exogenous. Estimations are performed with time and the other aforemen-tioned dummies added. Explanatory variables are lagged one period (Fig. 4).
References
Amable, B., 1993. National effects of learning, international specialisation and growth paths. In: Foray, D., Freeman, C. (Eds.), Technology and the Wealth of Nations. Frances Pinter, London. Amable, B., 2000. Institutional complementarity and diversity of social systems of innovation and
Amable, B., Boyer, R., 1995. Europe in the world technological competition. Struct. Change Econ. Dynam. 6 (2), 167 – 182.
Archibugi, D., Michie, J. (Eds.), 1998. Trade, Growth and Technical Change. Cambridge University Press, Cambridge.
Arellano, M., Bond, S., 1988. Dynamic panel data estimation using dpd — a guide for users. IFS Working Paper No. 88 – 15. Institute for Fiscal Studies.
Arelano, M., Bond, S., 1991. Some tests of specification for panel data: Monte Carlo evidence and an application to employment equations. Rev. Econ. Studies 58, 277 – 297.
Arrow, K., 1962. The economic implications of learning by doing. Rev. Econ. Studies XXIX (2), 155 – 173.
Barro, R., Lee, J.W., 1993. International comparisons of educational attainment. NBER Working Paper No. 4349.
Barro, R., Sala-i-Martin, X., 1995. Economic Growth. McGraw Hill, New York.
Ben-David, D., 1993. Equalizing exchange: trade liberalisation and income convergence. Q. J. Econ. 125 (3), 653 – 679.
Berthe´lemy, J.C., Dessus, S., Varoudakis, A., 1996. Human capital and growth: the role of the trade regime. Unpublished paper OECD Development Center, in press.
Busson, F., Villa, P., 1997. Croissance et spe´cialisation. Revue Economique 48 (6), 1457 – 1483. Caselli, F., Esquivel, G., Lefort, F., 1995. Reopening the convergence debate: a new look at
cross-coun-try growth empirics. Harvard University, in press. CEPII, 1998. Compe´titivite´ des Nations. Economica, Paris.
DeLong, B., Summers, L., 1991. Equipment investment and ecoonomic growth. Q. J. Econ. CVI (2), 445 – 502.
Durlauf, S., Johnson, P., 1995. Local versus global convergence across national economies. J. Appl. Econ.
Edwards, S., 1993. Opennness, trade liberalization and growth in developing countries. J. Econ. Lit. XXXI (3), 1358 – 1393.
Fagerberg, J., 1988. International competitiveness. Econ. J. 98, 355 – 374.
Fagerberg, J., Hanson, P., Lundberg, L., Melchior, A. (Eds.), 1997. Technology and International Trade. Edward Elgar, Cheltenham.
Frankel, J., Romer, D., 1996. Trade and growth: an empirical investigation. NBER Working Paper No. 5476.
Freeman, C., 1995. The disruptive effects of technological revolutions on world economy.
Grossman, G., Helpman, E., 1991. Innovation and Growth in the Global Economy. MIT Press, Cambridge.
Kaldor, N., 1957. A model of economic growth. Econ. J. LXVII, 591 – 624.
Kaldor, N., 1981. The role of increasing returns, technical progress and cumulative causation in the theory of international trade and economic growth. Economie Applique´e 34 (6), 633 – 648. Kaldor, N., Mirlees, J., 1962. A new model of economic growth. Rev. Econ. Studies 29 (3), 174 – 192. Lucas, R., 1988. On the mechanics of economic development. J. Mon. Econ. 22, 3 – 42.
Matsuyama, K., 1992. Agricultural productivity, comparative advantage, and economic growth. J. Econ. Theory 58, 317 – 334.
Nehru, V., Dhareshwar, A., 1993. A new database on physical capital stock: sources, methodology and results. Rivista de Analisis Economico 8 (1), 37 – 59.
Rivera-Batiz, L., Romer, P., 1991. Economic integration and endogenous growth. Q. J. Econ. 106 (2), 531 – 555.
Rodriguez, F., Rodrik, D., 1999. Trade policy and economic growth: a skeptic’s guide to the cross-national evidence. NBER Working Paper No. 7081.
Thirlwall, A.P., 1979. The balance of payments constraint as an explanation of international growth rate differences. Banca Nazionale del Lavoro Q. Rev. 32, 45 – 53.
Verner, D., 1995. Can the variables in an extended solow model be treated as exogenous? Learning from international comparisons across decades. EUI Working Paper ECO No. 95/20.
Young, A., 1991. Learning by doing and the dynamic effects of international trade. Q. J. Econ. 106 (2),