CORROSION RATES MEASUREMENTS BY LINEAR POLARISATION AND AC IMPEDANCE TECHNIQUES USING DIFFERENT STEEL BARS AND ACIDIC SOLUTION
Gidion Turu’allo *
Abstrak
Laju korosi batang tulangan dalam beton dipengaruhi oleh tingkat keasaman atau tingkat pH dari lingkungan beton yang menyelimuti batang tulangan. Penelitian ini dilakukan dengan menggunakan larutan asam dengan derajat keasaman (pH) dan jenis asam yang berbeda serta jenis besi tulangan yang berbeda. Hasil penelitian ini menunjukkan bahwa laju korosi yang diperoleh dengan menggunakan kedua metode baik Linear Polarisation Resistance (LPR)
maupun AC Impedance hampir sama. Hal ini disebabkan lingkungan asam mendukung proses korosi. Hasil penelitian ini juga menunjukkan bahwa jenis dan diameter batang tulangan serta konsentrasi larutan asam adalah faktor yang mempengaruhi laju korosi dari batang tulangan. Bahkan lama pengetesan juga mempengaruhi laju korosi karena tahanan polarisasi berkurang menurut waktu.
Keywords: laju korosi, konsentasi, larutan asam, tahanan polarisasi
Abstract
The corrosion rate of steel bars in concrete was affected by concentration of acid or pH level of concrete environment which covered the steel bars. This research was conducted by using different acid and concentration with different diameter and kind of steel bars. The results obtained from the test using both the polarisation resistance (LPR) and the AC impedance techniques are similar. This is because the acidic environment supports the corrosion process. It is also found that the type and diameter of bars immersed in acid solution and the concentration of acid are the determining parameters of the corrosion rates of the bars. Even the length of test period also affects the corrosion rates as the polarisation resistance decreases by time.
Kata kunci: Corrosion Rate, Concentration, Acid Solution and Polarization Resistance
* Staf Pengajar Jurusan Teknik Sipil Fakultas Teknik Universitas Tadulako, Palu 1. Introduction
Corrosion is the deterioration of materials by chemical interaction with their environment. The term corrosion is
sometimes also applied to the
degradation of plastics, concrete and wood, but generally refers to metals. The most widely used metal is iron (usually as steel) and the following discussion is mainly related to its corrosion.
When steel reinforcement is
encased in sound dense concrete, the entire surface of the steel is covered by a stable protective oxide film that forms in the alkaline environment created by
the hydration of the cement in the concrete. Under these circumstances no corrosion of the reinforcement can occur.
However, if the protective oxide film is locally destroyed, for example by the ingress of chloride ions, areas of different potential can be set up on the surface. The presence of acid affects the corrosion rates of steel bars in concrete. The steel bar is passive in a
high pH environment (between 12 – 14)
environment) to the low level (acidic environment). Therefore, it is necessary to understand the behavior of the steel in acidic environment with different acids and various concentrations.
2. Literature Review placing, compaction, curing conditions, design and detailing, and interaction with service environment. The process of degradation, such as corrosion of steel reinforcement, is therefore dependent on concrete quality as well as exposure
conditions. The initiation and
propagation of corrosion in concrete structures can be influenced by both internal and external factors. These sources of deterioration depend on
concrete properties and exposure
conditions and, to a large extent, govern structural performance and remediation practices.
2.1 Overview of Concrete Deterioration Processes
While concrete has evolved to become the most widely used structural material in the world, the fact that its capacity for plastic deformation is essentially nil imposes major practical design limitations; this shortcoming is
most commonly overcome by
incorporation of steel reinforcement into those locations in the concrete where
tensile stresses are anticipated.
Consequently, concerns regarding
performance must not only focus upon properties of the concrete per se but also of the embedded steel and, in addition, the manner in which these two components interact.
In this regard, steel and concrete
are in most aspects mutually
compatible, as exemplified by the fact that the coefficient of thermal expansion for each is approximately the same. Also, while boldly exposed steel corrodes actively in most natural environments at a rate that requires use of extrinsic
corrosion control measures (for example, protective coatings for atmospheric exposures and cathodic protection in submerged and buried situations), the relatively high pH of concrete pore
water (pH > 13.0-13.8) promotes
formation of a protective passive film such that corrosion rate is negligible and decades of relatively low maintenance result.
positively charged ions (anodic
oxidation) and the excess of electrons flow through the metal to cathodic sites
where an electron acceptor like
dissolved oxygen is available to
consume them (cathodic reduction). This represents the electrochemical theory of metal corrosion; describing the
metal corrosion process, as a
combination of an anodic oxidation, such as metal dissolution, and a cathodic reduction, such as oxygen reduction or hydrogen evolution.
The electrons created in the anodic reaction must be consumed
elsewhere on the steel surface
establishing the corrosion reaction. The process is completed by the transport of ions through the aqueous phase, leading to the formation of corrosion products at the anodic sites either soluble (e.g. ferrous chloride) or insoluble (e.g. rust, hydrated ferric oxide).
If the current caused by the electron flow could be measured at all,
the measured quantity, Inet would
represent a net effect of the partial currents resulting from oxidation and
reduction. Inet is generally zero, i.e. for
on the same metal (Broomfield, 1997).
ox rednet
I
I
The corrosion rate p is then proportional to the sum of the partial
anodic currents (corrosion current)
causing metal dissolution. p is defined as
the loss of the corroding metal in micrometers per year [µm/y] and can be calculated by (Andrade, 1996):
F
Icorr = corrosion current
A = measurement area
t = time
= density of iron (= 7.86 g/cm3)
z = number of electrons
transferred per atom
)
corrosion current that is inversely related to the polarization resistance can be calculated by the equation (Broomfield, 1993):cathodic Tafel constant respectively, which is known as the Stern-Geary corroding respectively, with the error factor is 2.
Furthermore, guidance relating
polarization resistance (Rp), corrosion
current density (icorr) and corrosion
penetration (p) to rates of corrosion is given in Table 1
A corrosion current density of 1 mA/m2 iron surface is therefore equal to a corrosion rate of 1.16 µm/year. If a rebar with a diameter of 16 mm is corroding with 100 mA/m2 surface for 20 years - which can locally be the case - the cross section would have reduced to 11.4 mm. This can cause already static problems for the structure. In fact, the collapse of the Berlin Congress Hall and of a parking garage in Minnesota is two
examples of spectacular failures
because the static load capacity was reduced excessively due to corrosion (Borgard, B., 1990).
The electrochemical system "steel
corroding in concrete" can be
described by applying the mixed metal theory. The current density-potential curve can be achieved theoretically by solving the Butler Volmer equations in combination for the reactions that happened in anodic and cathodic.
In alkaline and oxygen rich electrolytes such as atmospherically exposed reinforced concrete structures,
the second and or the third
Table 1. Typical corrosion rates for steel in concrete
Unhydrated dense ferric oxide
(Fe2O3) has a volume of about twice
that of steel replaced. When it becomes hydrated it swells even more and becomes porous, increasing the volume at the steel/concrete interface two to ten times. This leads to the already mentioned cracking and spalling of the
concrete observed as a usual
consequence of steel corrosion in concrete. The electrochemical behavior of steel in aqueous solution has to be
considered as the base for
understanding the complex corrosion process in the very inhomogeneous concrete with local gradients of pH and concentration of aggressive ions.
2.3. The effect of pH
The corrosion rate of active metals is strongly determined by the pH value and in neutral media by the oxygen content. Alkaline concrete has a pH value of about 12.5. In this environment carbon steel is passive and suffers therefore no noticeable corrosion in absence of chlorides. In neutral water the relatively slow diffusion of the oxygen to the metal surface is the limiting step in the corrosion process. The rate of depends mainly on the difference of the
corrosion potentials, the electrical
resistance between anode and
cathode, the ratio of the anodic and cathodic areas and the polarisation
behavior of the two metals. In practice typical corrosion rates are in the range
between 0.5 and 2 mm/year
[Bindschedler, D., 2001].
Also in the case of localised corrosion of passive materials the corrosion rates are usually very high. For pitting and crevice corrosion material losses up to 3 mm/year are not unusual. In the literature even corrosion rates of
20 mm/year are reported. Stress
corrosion cracking and intergranular corrosion can, at least in unfavourable cases, lead to failures practically without preliminary warning.
It can already' be seen that the
reduction of H+ to H2 is a
thermodynamically feasible way to allow the oxidation of Fe to take place. This also implies that (especially in
deoxygenated solutions) the
concentration of H+ is very important.
Since pH = -log [H+], then: using
the Nernst equation one can write:
pH every change in pH unit.
Corrosion experiments intended to simulate steel in concrete have
historically employed a saturated
Ca(OH)2 solution, the pH of which is
approximately 12.4. However, with the advent of the pore water expression
method (12-14) and theoretical
Limitations associated with pore water expression include, first, prior water saturation of samples is required and, second, the method is more useful for pastes and mortars since expression yields for concrete, particularly high performance ones, is low. Consequently,
both ex-situ and in-situ leaching
methods (Sagüés, A.A. et all, 1997) have also been developed, where the former involves exposure of a powder sample the concrete becomes dissolved and elevates [OH-] compared to what
otherwise would occur. Also, the
dissolved Ca(OH)2, if saturated, buffers
the leachate at a pH of about 12.4. These limitations are minimized by the in-situ method because only about 0.4 ml of distilled water is employed; however, water saturation of the specimen is
required here also. Recently, a
modification of the exsitu method was proposed whereby a correction is made for the [OH-] resulting from Ca(OH)2 dissolution (Sagüés, A.A., et all, 1997); however, solubles in unreacted cement particles may also become dissolved, thereby elevating the calculated pH compared to what actually existed in the pore water. Consequently, this procedure may be more a measure of inherent alkalinity than of pore water pH.
2.4. Breakdown of the passivity due to pH-decrease
Passive hydrated oxides interact with the solution due to their certain solubility. If the solubility of the hydroxide (hydrated oxide) in a given aqueous environment is small then it is probable that it will form a stable protective film on the metal surface. However, the
passivating (hydrated) oxide or
hydroxide films on many metal surfaces
exhibit increasing solubility with
decreasing pH of the surrounding solution.
Increasing solubility of the oxide layer will often imply a reduced passivity and an increase in the corrosion rate.
in which active corrosion is expected.
3. Experimental Program
The purpose is to evaluate the rate of corrosion of the steel bar and how this is affected by acid with various pH, bar with different diameters, type of steel bar, and time of length of exposure. The tests are performed by both the linear polarisation resistance
(LPR) and AC impedance (EIS)
techniques using acid solution as a medium and steel bars as the test specimen. The test results of the two techniques then are compared.
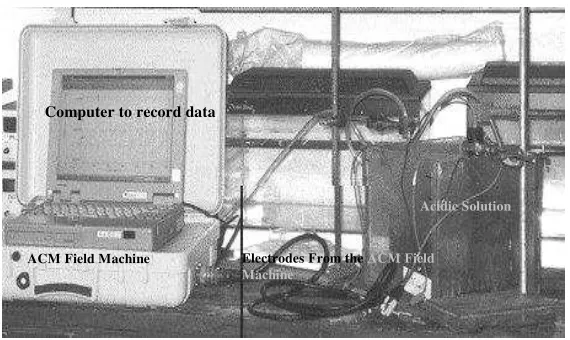
The reference electrode used was an Ag/AgCl of 3 % solution and the auxiliary electrode as well as the working electrodes comprised steel bars with 10 cm long. The working electrode were four different bars i.e. mild steel bar with diameter of 6 mm, 10mm, 25 mm and another one which is a stainless bar with a diameter of 10 mm. A 10 cm length of stainless steel with a diameter of 10 mm is used as the auxiliary electrode.
Furthermore, the experiment uses two kinds of acid i.e., acetic acid and
Resistor-Capacitor Circuits test, the test is
conducted by connecting the
reference electrode, working electrode and auxiliary electrode from the test specimen to the reference electrode,
working electrode and auxiliary
Figure 1. Connection between the electrodes from the ACM Machine and the electrode from Specimen
However, unlike the working
electrode bars, once the tests were finished the auxiliary electrode was taken out from the specimen (aqueous solution) to keep its surface area as well as the reference electrode.
The acid solution was aerated continuously as long as the tests were performed by an electric driven air pump. This aim was to provide oxygen, which is needed, for the corrosion
process. The electrode area was
obtained from the surface area of the
working electrode. The 'sequence'
program was used to set up the tests of both the linear polarisation resistance and the AC impedance techniques providing a delay time between the two tests by means the 'pause' technique.
4.Results and discussion
The experiment of each
concentration of both the acetic acid and sulphuric acid was performed for 7 days. In general, all of test results show that there is a rapid exponential decrease in the polarisation resistance until a certain time. There is then a slow decrease in the next time period as shown in Figure 2 below. The graph presents the test result of the polarisation resistance test using a mild steel bar of 6
mm diameter as a corrosion specimen in a acetic acid of pH 3.
From the results seen in Figure 2, it is seen that the polarisation resistance decreases with time for the mild steel specimen. As the corrosion current is inversely related to the polarisation resistance then it can be seen in Figure 3 that the corrosion rate increases in magnitude over 5 times during the 6 days test period. However, both the graphs show that after 5 to 6 days (on the end of test period) the rate of corrosion appears to stabilise.
The Figure 2 shows that the
polarisation resistance of the 6 mm mild steel bar decreases for the first three days. It reduces to more than half of its value at the start of the test i.e., from the
value of 418 on the first day to 165
on the third day (average results of the linear polarisation resistance and the AC impedance). The polarisation resistance then reduces more slowly between the third day and the sixth day of the test of
the value of 165 and 113
respectively. Finally, the corrosion
reaction looks to be constant at the last two days of the test i.e., from the value
of 113 on the sixth day to 111 on the
last day.
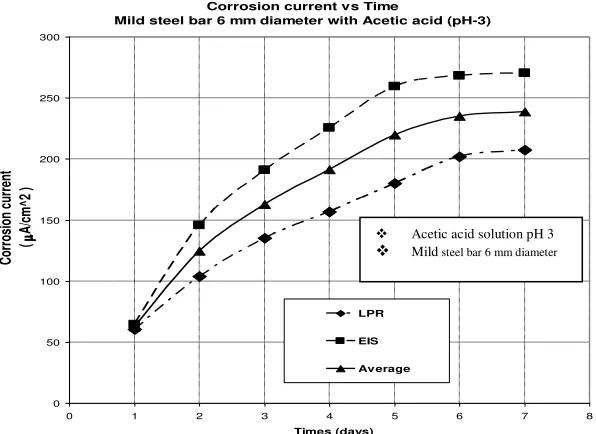
In contrast, the Figure 3 below show that there is a rapidly increase in
ACM Field Machine
Computer to record data
Acidic Solution
Electrodes From the ACM Field
the corrosion current for the first three
days from a value of 63 A/cm2 on the
first day of the tests to a value of
125 A/cm2 on the third day of the
tests. This is almost twice the value of the result on the first day. The corrosion reaction then becomes more constant
on the last two days of test i.e., from a
corrosion current value of 235 A/cm2 to
a value of 239 A/cm2. Therefore, the
rate of corrosion in the specimen will remain constant if the environment of the tests is not changed.
Figure 2. Plotting the polarisation resistance (.cm2) vs. Time (days)
Polarisation resistance vs Time
Mild steel bar 6 mm diameter with Acetic acid (pH-3)
0 50 100 150 200 250 300 350 400 450 500
0 1 2 3 4 5 6 7 8
Time (days)
Po
la
ris
ati
on
re
si
sta
nc
e
(
cm
^2
)
LPR EIS average
Acetic acid solution pH 3
Mild steel bar 6 mm diameter
Corrosion current vs Time
Mild steel bar 6 mm diameter with Acetic acid (pH-3)
0 50 100 150 200 250 300
0 1 2 3 4 5 6 7 8
Times (days)
Co
rr
os
io
n c
ur
re
nt
(
A/c
m
^2
)
LPR
EIS
Average
Acetic acid solution pH 3
Mild steel bar 6 mm diameter
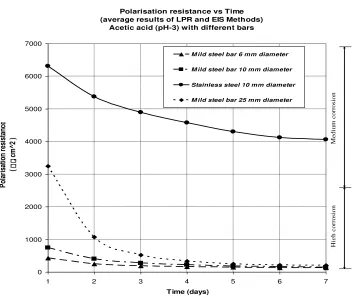
Figure 4 below presents the result of the tests, which were performed using the same of acid and concentration with different diameter of the bars. It can be seen from the figure that the polarisation resistance of a stainless steel bar is higher than the polarisation resistance of a mild steel bar. A
comparison the test results of
polarisation resistance shows that the polarisation resistance of the stainless steel bar is almost twenty times higher than the polarisation resistance of the
mild steel bar i.e., 4062 cm2 and 206
cm2 respectively. The results shown are
for the same 10 mm diameter of bar and for immersion in the same concentration of acid. This is because stainless steel bar has a passive oxide layer that acts as a
corrosion inhibitor that protects the bar surface from corrosion.
The figure also shows that using a bigger diameter of the same type of bar i.e., mild steel gives a higher polarisation resistance in the beginning of test. However, at the end of the tests it is found that the results are just a little different but still show that the bigger diameters of the steel bar give the higher polarisation resistance. The results from first day of test using mild steel bars of 6 mm, 10 mm and 25 mm diameter gives the polarisation resistance results of
3246 cm2, 746 cm2, and 419 cm2.
And at the end of test the polarisation
resistances of the bars are 206 cm2,
150 cm2, and 111 cm2 receptively.
Furthermore,
Figure 4. Measurement of polarisation resistance for different bar diameters with the same acidic solution
Polarisation resistance vs Time (average results of LPR and EIS Methods)
Acetic acid (pH-3) with different bars
0 1000 2000 3000 4000 5000 6000 7000
1 2 3 4 5 6 7
Time (days)
P
ol
ar
is
at
io
n
re
si
st
an
ce
(
. c
m
^2
)
M ild steel bar 6 mm diameter
M ild steel bar 10 mm diameter
Stainless steel 10 mm diameter
M ild steel bar 25 mm diameter
High
cor
ros
io
n
M
edium
c
or
ros
io
Figure 5. Measurement of corrosion current for different diameter of bars with the same acidic solution
Corrosion current vs Time (average results of LPR and EIS Methods) Acetic acid (pH-3) with different bars
0
Mils steel bar 6 mm diameter
Mild steel bar 10 mm diameter
Stainless steel bar 10 mm diameter
Mild steel bar 25 mm diameter
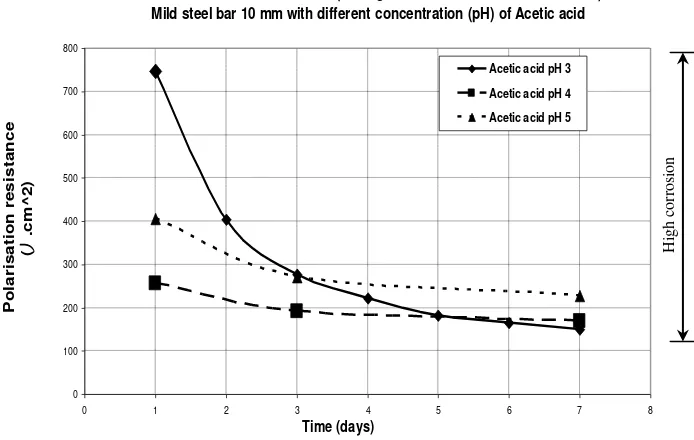
Polarisation resistance vs Time (average results of LPR and EIS methods) Mild steel bar 10 mm with different concentration (pH) of Acetic acid
0
Another presentation of the test results can be seen in Figure 5 below. By plotting the current density against time, the figure shows that the corrosion and exponentially over the same period. The corrosion current of the mild steel constant on the last two days of the test. This suggests the equilibrium rate of the corrosion in each bar have been reached. Therefore, the corrosion rate reaches equilibrium if the environment is not changed.
Finally, Figure 6 below shows the effects of different concentrations of acid to the corrosion process of the steel bar. The figure shows the polarisation resistance results of a mild steel bar of 10 mm diameter.
The graph on figure 6 is displaced because the experiments use the same actual bars for the test of each concentration of acid. The first test uses the strongest acid i.e., acetic acid of pH 3, therefore, when the other tests using acetic acid of pH 4 and pH 5 the bar used already has a corroded surface. However, at the end of experiment it shows that the strongest acid i.e., acetic acid of pH 3 gives the lowest of the polarisation resistance results. It can be seen that the results of both the acetic acid of pH 4 and of pH 5 give a higher polarisation resistance result than using acetic acid of pH 3.
The polarisation resistance of bar in acetic acid of pH 3 decreases more
dramatically than the other
concentrations of acetic acid. This
means that strong acids are more corrosive than weak acids. As the result of the strong acid more corrosion current can be passed. In other words, the use of strong acids will accelerate the corrosion reaction.
Therefore, the lower pH of an acid solution used in the experiment the higher rates of corrosion can be obtained. The corrosion process is faster with the lower pH of acid solution rather than with the higher pH of acid as presented in Graph 10 above. It also seems that the corrosion current for both of the two different pH i.e., pH 4 and pH 5 increases more slowly than the corrosion current with the acetic acid solution of pH 3.
The corrosion current for the tests, which used acetic acid solution of pH 4 corrosion current for each concentration of the acetic acid solution shows that
used the mild steel bars show that the corrosion rates of the mild steel bars which were immersed in acid are very high corrosion in which each the mild steel bars have a value of the
corrosion current over of 100 µA/cm2.
bar then corroded which is categorised in a medium corrosion with the corrosion current below of 10
µA/cm2.
2. The results of the corrosion rate
measurement, which used an acid solution, show that both the linear polarisation resistance (LPR) and the AC impedance techniques give similar results. The analogous resistor-capacitor circuit tests have been
performed to measure the
polarisation resistance Rp using both
the linear polarisation resistance (LPR) and the AC impedance techniques
by means the ACM Field machine.
3. The obtained results are similar to the
expecting result, before performed the tests with various variables such as using different concentration of the acid, different diameter and type of the bars particularly for the mild steel bars. There is little bit different from the expecting results for the stainless bar, which is expected to be a passive corrosion level, however, the results show that the bar is in the
medium corrosion level. This is
because the acid used was strong.
However, the results are still
reasonable to be good results because the surface of the stainless bar was looked much damaged after performed the experiment.
6. References
Akinov G.V., 1993, Theory and Testing Methods of Corrosion of Metals, STNL Praha.
Andrade C. and Alanso C., 1996, Corrosion rate monitoring in the
laboratory and on site,
Construction and Building
Materials, vol. 10, No. 5, pp. 315-322.
Andrade C., Castelo V., and Gonzales J.A., 1993, the determination of
the corrosion rate of steel
embedded in concrete by the polarisation resistance and A.C impedance methods, ASTM STP 906.
Bindschedler, D. 2001: Galvanic
corrosion in waste water
installations - Corrosions
galvaniques dans les réseaux d’eaux usées, Proceedings of CEOCOR plenary days Biarritz 2001 (CEOCOR)
Borgrad B., 1990, Mechanisms of
Corrosion of Steel in Concrete in:
Corrosion Rates of Steel in
Concrete, ASTM STP 1065.
Broomfield J.P. 1993, Corrosion rate
measurement in reinforced
concrete structures by a Linear
Polarisation device, ACI fall
convention, Minneapolis.
Broomfield J.P. 1997, Corrosion of steel in concrete. E & F.N. Spon, 1997
Hartt, W.H., Charvin, S., and Lee, S.K., 1999, Influence of Permaeability Reducing and Corrosion Inhibiting Admixtures in Concrete upon
Initiation of Salt Induced
Embedded Metal Corrosion, final report submitted to FDOT by FAU on Project WPI 0510716,
Lopez W. 1993, Influence of degree of pore saturation on the resistivity of concrete and the corrosion rate of
steel reinforcement. Cement and
Concrete Research, vol. 23, No. 23, pp. 368-376.
Millard S.G. 1999, Corrosion rates
measurement of in-situ reinforced concrete structures, Proc. Instn. Civ. Engrs. Structures and Buildings, vol. 99, pp.84-88.
Millard S.G., Gowers K.G., Gill J.S., and Gill R.P. 1994, Programmable linear
polarisation measurement for
determination of corrosion rate of
reinforcement in concrete
structures, British Corrosion Journal, vol. 28, No.4, pp 25-31.
Pruckner, F., 2001, Corrosion and
Protection of Reinforcement in
Concrete Measurements and