Effect of Temperature, pH, and Salinity on Adsorption of Textile Dye onto
Biosilica
Hadiatni R. Priyantini*, Lieke Riyadi, Andreas Lasakar, and Albert G. Kwenusland
Chemical Engineering Major, Faculty of Engineering, University of Surabaya Jalan Raya Kalirungkut, Surabaya
*E-mail: [email protected]
Abstract
This research presents the adsorption of Direct Red-31 dye with biosilica adsorbent from rice husk ash. Direct Red-31 dye is azo dye, which is frequently used in textile industry. Rice husk ash is used as asdorbent, because of the abundant existence of rice husk in Indonesia and it is easy to get. This research was run in batch process with dye concentration 20 ppm and adsorbent mass 10 g/L. The research was performed with pH variation (2, 3, 4, 5, and 6), variation of salt (NaCl, NaNO3, and Na2SO4) and temperature variation (35, 40, 45, 50, and 55 oC). From the research result, the optimum pH of the adsorption is at pH 2 with percent removal 83.949%. Adsorption process with addition of Na2SO4 salt increases the removal percentage to 87.714%. For the temperature effect analysis, the positive value of ΔG indicates the non spontaneous adsorption, the entalphy (ΔH) value of 11.8 kJ/mol indicates the adsorption was physical and endothermic. Entropy (ΔS) value of 0.03101 kJ/molindicates structural changes on the surface of the adsorbent.
Keywords: Direct Red-31, rice husk ash, temperature, salinity, pH
Introduction
Adsorption technique becomes more popular lately because of its simplicity and proven to be an effective process to remove pollutant (dye, toxic heavy metal ion, etc.) in the wastewater (Zhao, B., et al. 2013). From all types of adsorption material, activated carbon is the most efficient yet expensive material, thus researcher starts developing adsorbent with cheaper price and optimum quality of adsorption. In these last years, agriculture materials are taken into consideration since their abundance, affordability, and good adsorption capacity. These agriculture materials include rice husks, nutshells, corncobs, wheat brans, and saw dusts.
Waste from textile industry which is not pre-processed will contain large amount of dye that can damage environment and contaminate the water. When dye is found in water system, sunray will hardly come through the water and it will interrupt photosynthesis process that reduces oxygen amount in the water. It degrades the quality of
water and destabilizes flora and fauna’s life because of its toxic. There are some physical and chemical methods to remove dye, such as activated carbon, electrocoagulation, flocculation, flotation foam, ion exchange, membrane filtration, ozonation, and reverse osmosis.
Since the usage of rice husk as biosorbent is not common yet its amount is abundant, we need to perform a deeper research regarding the utilization of biosorbent from rice husk in the direct red-31 dye biosorption process.
Research Method
Materials
Direct red-31, rice husk ashes, H2C2O4, NaOH, HCl, NaNO3, Na2SO4, and NaCl.
Adsorbent Preparation
Initially, rice husks are washed then dried inside oven with 105°C for half an hour. Dry rice husks are treated with H2C2O4 1 N for an hour with 100°C. Dry rice husks are rinsed with water until the pH becomes neutral and put
into oven in 105°C for 2 hours. After rice husks are drying, those are ready to be burned in the furnace with 700oC
temperature for 5 hours. Rice husk ashes are sieved in 140-200 mesh and stored in the closed storage.
Dye Solution Preparation in Various pH
Adsorption on Batch
Adsorption process occurs in batch method to understand effects from various used parameters, such as pH, salinity, and temperature. In 200 mL dye adsorption process with various adsorbent masses and concentrations, this solution is stirred in the constant velocity which is 100 rpm within 4 hours in the ambient temperature. Every 10 minutes, sample is taken with using pipet and centrifuged with speed rotation 12,000 rpm within 120 seconds. Adsorbent of separated sample is being measured by UV-Vis spectrophotometer.
For determining adsorption’s effect in various pH, 0.1 M HCl and 0.1 M NaOH are used to set pH value range within 2-6 in 200 mL solution. For the same purpose in salinity addition, Na2SO4, NaCl, and NaNO3 are used in 200
mL solution. Concentration of used salt is 1 M which is obtained from the best result with concentration parameter 0.5-1 M with Na2SO4 and the best concentration from previous experiment is used in variation of Na2SO4, NaCl, and
NaNO3. Then, adsorption’s effects are determined at various temperatures (35-55oC) in pH 2 with waterbath shaker
in 100mL dye solution.
The amount of adsorbed dye (Cμeq) is calculated in Eq.1
[1] Where Cμeq is amount of dye which is adsorbed into the adsorbent (mg/g). C0 and Ceq (mg/L) are initial dye
concentration and dye concentration in equilibrium, respectively. V is dye solution volume (mL) and m is rice husks mass (gram). Percentage of removalis measured by Eq. 2
%removal = x 100% [2]
Isothermal adsorption process is approximated with Langmuir, Freundlich, and Linear methods.
Result and Discussion
XRD of Rice Husk Ashes Analysis
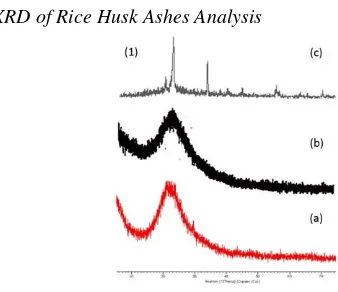
Figure 1. Rice husks diffractogram XRD analysis (a) amorphous structure in 700oC, (b) amorphous structure
(Sapei, L., et al, 2015) (c) crystal structure (Saceda, F.J.J.,
et al, 2011)
Figure 2. Removal percentage of direct red-31 dye by rice husks biosilica for every initial pH
Figure 1.1 (a) shows proof with maximum intensity in 2-θ 21o, biosilica structure in rice husk ashes is
amorphous solid. This is consistent with previous research shown in Figure 1.1 (b) with rice husk preliminary treatment using 3 M acetic acid in 750oC and it has sloping peak within 2-θ 22o with amorphous structure (Sapei, L., et al, 2015). Silicate amorphous structure will start changing in 900oC (Bakar, R.A., et al, 2016), thus biosilica
obtained from rice husk is consistent with the theory which is amorphous structure. Figure 1.1 (c) shows crystalline silicate with peak 2-θ -20.9o, 21.9o, 26.6o, 31.4o, 36o (Saceda, F.J.J., et al, 2011).
Initial pH Effect on Direct Red-31 Dye Adsorption
Figure 2 shows that the smaller the pH of the solution (acid) the bigger the percentage of the dye removal obtained. This explains that in the acid condition, adsorption process will increase the electrostatic interaction between adsorbent and direct red-31 dye.
Figure 3. Bond between rice husk ashes biosilica with direct red-31 dye
When the pH is low, ion H+ will enter active side from the adsorbent and bind direct red-31 dye that is an anionic
dye (having negative charge on the dye surface), thus it makes the electrostatic binding occur between the adsorbent surface and dye. Besides the electrostatic interaction, there is a hydrogen bond between atom H in Si(OH)2 with
atom N in direct red-31 dye. On the contrary, in the basic condition, silicate surface is surrounded by large amount of ion OH- and will be a hindrance in adsorption process. This is because ion OH- and atom N in dye will compete to
bind with H+ in Si(OH)
2, thus the adsorption process will be blocked (Fan, S., et al, 2016; Soltani, R.D.C. et. al,
2015).
Effect of Temperature in Direct Red-31 Dye Adsorption
In salinity experiment, Na2NO3, NaCl and Na2SO4 in pH 2 are used with concentration of solution 20 ppm and
adsorbent mass 10 g/L. Experiment is initiated with specifying the concentration that will be used with Na2SO4 in
concentration 0.5; 0.7; 0.8; 0.9; and 1 M.
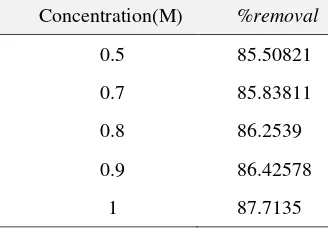
Table 1.Direct red-31dye removal percentage by rice husk ash biosilica in various concentration of Na2SO4
Concentration(M) %removal
0.5 85.50821
0.7 85.83811
0.8 86.2539
0.9 86.42578
1 87.7135
Table 2. Comparison of direct red-31 dye removal percentage direct red-31 by rice husk ashes biosilica with and without salt
Salt %removal Cµ (mg/g)
None 83.949 1.795 NaCl 83.2301 1.8194 NaNO3 84.051 1.82575
Na2SO4 87.714 1.8383
Based on Table 1, the best removal percentage is in 1 M which is the higher the salt concentration, the bigger the percentage of dye removal, thus in the salinity effect setting in NaCl and Na2NO3, concentration of 1 M is applied.
Na2SO4 is selected because of its strongest character among all, thus it can be a reference for another types of salt.
From Table 2, the existence of NaNO3 and Na2SO4 increases dye adsorption because it can increase the removal
percentage from 83.949% to 84.051% and 87.714%. Therefore, with salt addition in the process, dye removal percentage can be increased because dimerization inter direct red-31 dye is also increased. It affects the ion dipole force and dipoles bond that occur in the dye solution with adsorbent (Mahmoud, M.E., et al, 2016), where dimerization of direct red-31 dye occurs because the repel force is decreased with addition of positive ion that comes from salt amount caused by salt ionization in the solution (Alberghina, G., et al, 2000).
Effect of Temperature in Direct Red-31 Dye Adsorption
Table 3. Equilibrium data of temperature effect for direct red-31 dye adsorption by rice husk ashes biosilica
T (K) C0 (ppm) Ceq (ppm) Cµeq (ppm)
308.15 21.231 4.1271 1.7104 313.15 22.379 4.1898 1.818 318.15 21.791 3.5602 1.823 323.15 21.808 3.5597 1.825 328.15 22.378 3.4906 1.888
Based on Table 3, with the increasing of the temperature, the adsorption of the adsorbent will not be affected. It can be seen from Cµeq values that do not tend to change significantly. This is because the increase of temperature
will not affect the surface shape from the solid adsorbent, especially factors that affect adsorption capacity, such as active site and surface area of the material.
Table 4. Direct red-31 dye removalpercentage by rice husk ash biosilica in various temperature
From Table 4, with the increase of temperature, the removal percentage will also be higher. For nonlinear isotherm, the higher the temperature within adsorption, the higher the diffusivity within the adsorbent surface and the ability to adsorb dye will also be increased (Do, D.D., 1998). Langmuir equilibrium is the most suitable model to approximate this adsorption process, which Langmuir itself is nonlinear isotherm, thus we get the best removal percentage at 55oC.
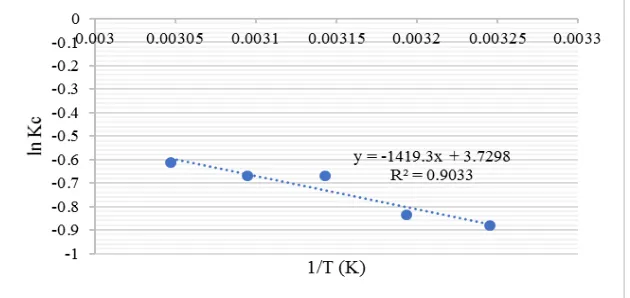
Figure 4. Temperature effect curve (1/T vs ln Kc) for direct red-31 by rice husk ashes biosilica
Van Hoff equation which is derived from Gibb’s equation is as follows
[3] [4]
[5]
Based on Eq. 3, 4, and 5, we can get the result in Table 5.
Temperature (oC) %removal
35 80.5609722
40 81.2779838
45 83.6620623
50 83.677091
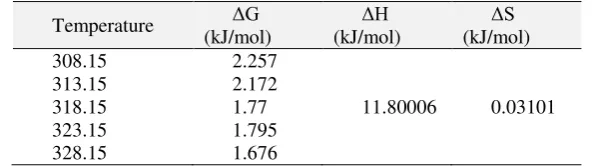
Table 5. Temperature effect parameter in direct red-31 dye adsorption process by rice husk ashes biosilica because of super small mass transfer velocity. Mass transfer velocity is affected by initial concentration of dye and used adsorbent mass. In addition, ΔG value will decrease with the increase of temperature, thus this adsorption process is preferably performed at high temperature (Fan, S., et al, 2016). Figure 4 shows that the slope of the curve is -1419.3. From the Gibb’s equation, slope value is used for finding ΔH from equation slope = -ΔH/R, thus ΔH is obtained as 11.8001 kJ/mol. ΔH within the range 2.1 – 20.9 kJ/mol indicates the physical adsorption (Humelnicu, I.,
et al 2017) which in this case is the adsorption in this experiment, thus the dye diffusion onto the adsorbent plays the key role, not the chemical adsorption, because the activation energy is very small. Positive ΔH value signifies that the process is endothermic.
The intercept value is used for finding ΔS from equation intercept = ΔS/R, thus ΔS is obtained as 0.03101 kJ/mol. Positive ΔS shows the randomness in the solid-solution interface and structural transformation in adsorbate and adsorbent. Because of the physical adsorption process, ΔS is positive and no chemical adsorption process occurs. Before this adsorption process occurs, the amount of adsorbate ions on the interface layer is greater and more organized than adsorbed circumstance (Konyucu, H., et al, 2014).
The best temperature and pH for adsorbent are in pH 2 and temperature 55oC, which the removal percentage is
84.4%. The types of the salt in this adsorption process that do not give a significant effect in this adsorption process are NaCl and NaNO3, while NaSO4 gives the most significant effect as 87.714%.
Conclusion
After performing some experimental works, it can be concluded that:
1.ΔH value is 11.8001 kJ/mol that indicates the adsorption process occurring in this experiment is physical adsorption. Positive ΔG value signifies that adsorption process goes in unspontaneous manner and ΔS is 0.03101 kJ/mol shows the randomness of the solid-solution interface and the structure transformation in the adsorbate and adsorbent
2.From salinity analysis, maximum adsorption is obtained with Na2SO4 1 M. The highest removal percentage
is 87.714% which shows that removal percentage is higher when the most correct type of salt is added. 3.From pH analysis, maximum adsorption occurs in pH 2. The highest removal percentage is 83.949%.
List of Symbols
Cμeq the amount of the adsorbed adsorbate per adsorbent mass in the equilibrium (mg/g) Ceq adsorbate concentration in the equilibrium (mg/L)
Bibliography
Alberghina, G., Bianchini, R., Fischera, M., and Fisichella, S. (2000). Dimerization of Cibacron of salts and temperature. Dyes and Pigments. 46. 129-137.
Atkins, P. (2006). Atkins Physical Chemistry 8th ed. New York: W. H. Freeman and Company.
Bakar, R.A., Yahya, R., Gan, S.N. (2016). Production of High Purity Amorphous Silica from Rice Husk. Procedia Chemistry. 19. 189-195.
Do, D.D. (1988). Adsorption Analysis : Equilibria and Kinetics. Imperial College Press, London.
Fan, S., Wang, Y., Wang, Z., Tang, J., Tang, J., and Li, X. (2016). Removal of methylene blue from aqueous solution by sewage sludge-derived biochar: Adsorption kinetics, equilibrium, thermodynamics and mechanism.
Journal of Environmental Chemical Engineering. 5. 601-611.
Humelnicu, I., Baiceanu, A., Ignat, M.E., and Dulman, V. (2016). The removal of Basic Blue 41 textile dye from aqueous solution by adsorption onto natural zeolitic tuff: Kinetics and thermodynamics. Process Safety and Environmental Protection. 105. 274-287.
Konyucu, H., Kul, A.R. (2014). An investigation of Cu(II) adsorption by native and activated bentonite : Kinetic, equilibrium and thermodynamic study. Journal of Encvironmental Chemical Engineering. 2. 1722-1730.
Mahmoud, M.E., Nabil, G.M., El-Mallah, N.M., Bassiouny, H.L., Kumar, Sandeep., and Abdel-Fattah, T.M. (2016). Kinetics, isoterm, and thermodynamics studies of the adsorption of reactive red 195 A dye from water by modified Switchrass Biochar adsorbent. Journal of Industrial and Engineering Chemistry. 37. 156-167.
Saceda, J.J.F., de Leon, R.L., Rintramee, K., Prayoonpokarach, S., and Wittayakun, J. (2011). Properties of Silica from Rice Husk and Rice Husk Ash and Their Utilization for Zeolite Y Synthesis. Quim Nova. 34 (8). 1394-1397.
Sapei, L., Padmawijaya, K.S., Sutejo, A., and Theresia, L. (2015). Karakterisasi Silika Sekam Padi dengan Variasi Temperatur Leaching Menggunakan Asam Asetat. Jurnal Teknik kimia. 9 (2). 38-43.
Soltani, R.D.C., Khataee, A., and Koolivand, A. (2015). Kinetic, Isotherm, and Thermodynamic Studies for Removal of Direct Red 12B Using Nanostructured Biosilica Incorporated into Calcium Alginate Matrix.
Environmental Progress & Sustainable Energy. 34 (5). 1435-1443.