L
Journal of Experimental Marine Biology and Ecology 242 (1999) 95–106
www.elsevier.nl / locate / jembe
The swimming behaviour and distribution of Neomysis
integer in relation to tidal flow
a b a ,* b
S.M. Lawrie , D.C. Speirs , D.G. Raffaelli , W.S.C. Gurney ,
c d
D.M. Paterson , R. Ford
a
Culterty Field Station, University of Aberdeen, Newburgh, Ellon, Aberdeenshire AB41 6AA, UK
b
Department of Statistics and Modelling Science, Strathclyde University, Livingston Tower, Glasgow, UK
c
Gatty Marine Laboratory, University of St Andrews, St Andrews, Fife, UK
d
Department of Marine Sciences, University of Otago, Dunedin, New Zealand Received 11 April 1999; received in revised form 29 June 1999; accepted 2 July 1999
Abstract
The behaviour and distribution of the estuarine mysid shrimp, Neomysis integer, were investigated in relation to a variety of flow regimes in the field and in the laboratory. In the field,
Neomysis aggregated in low-flow areas, such as in the lee of rocks and macroalgal clumps. Over
the low-tide period and during ascending and high-tide periods, individuals were concentrated in a band toward the moving tide edge where flows are typically low. Experiments performed using a laboratory flume demonstrated a clear response of Neomysis to flow, the proportion of individuals
21
above the bed declining with increasing flow. At flows of up to 10 cm s , 90–95% of individuals were able to maintain position on the bed of the flume, but at flows greater than this, Neomysis were unable to maintain position. When provided with a choice of water depths in a laboratory static tank (zero flow), there was little evidence of depth-seeking behaviour. We suggest that avoidance of areas of high flow is a key factor determining the local distribution of Neomysis.
1999 Elsevier Science B.V. All rights reserved.
Keywords: Behaviour; Current; Mysids; Neomysis integer; Aggregation
1. Introduction
In common with many other mysid shrimps, Neomysis integer shows aggregation behaviour (Clutter, 1969; Mauchline, 1971; Dadswell, 1975; Parker and West, 1979; Ohtsuka et al., 1995). The form of these social aggregations, their placement and their
*Corresponding author.
96 S.M. Lawrie et al. / J. Exp. Mar. Biol. Ecol. 242 (1999) 95 –106
function, have been discussed at length and seem to vary from species to species (Berrill, 1968; Clutter, 1969; Mauchline, 1971; Dadswell, 1975; O’Brien, 1988; Ohtsuka et al., 1995). In the case of Neomysis integer, which is restricted to estuarine habitats, one explanation of aggregations may be that individuals move to areas of the estuary where they are less likely to be displaced (Parker and West, 1979; Hough and Naylor, 1992; Roast et al., 1998).
Within the Ythan estuary, Aberdeenshire, Scotland, aggregations appear most obvious at the tide edge during the rising, falling and high-tide periods, but during the low-tide period are most conspicuous in the lee of rocks and macro-algal clumps, or as a mono-layer (in shallow water) at the sediment–water interface. These patterns of distribution suggest that aggregations may be more common in low-flow areas, but the relation between flow and abundance has not been quantified in the field to date at the relevant small scale (cf. Roast et al., 1998). In addition, it is not clear to what extent the distribution of aggregations is an inevitable consequence of passive entrainment of individuals into such low-flow areas, or whether Neomysis actively seeks such conditions. In the present paper, we address these questions by recording the abundance of Neomysis at different states of the tide in relation to water depth and flow, and by observing the response of Neomysis to flow under controlled laboratory conditions. Roast et al. (1998), have recently described the activities of Neomysis under a range of conditions within a laboratory annular flume and they relate these to the physical environment of the Looe estuary, Cornwall, UK. In the present study, we were able to make contemporary estimates of Neomysis densities and the flow environment in the field, and also to relate these to behavioural observations in a much larger flume environment. Our work thus both compliments and extends that of Roast et al. (1998).
2. Materials and methods
2.1. Field studies
S.M. Lawrie et al. / J. Exp. Mar. Biol. Ecol. 242 (1999) 95 –106 97
Mean directional water flows were measured over the intertidal flat over a 13 h period from high tide to high tide, using a Novar ‘‘streamflo’’ portable flow-meter with a
1
]
low-flow probe impeller. Maximum directional water current was measured at 3 depth
(H / 3, where H is the depth from sediment to water surface), and at maximum water depth (1 cm from the bed) at 0.5 m intervals along a transect perpendicular to the tide edge for a minimum distance of 5 m from the tide edge, congruent with the Neomysis sampling.
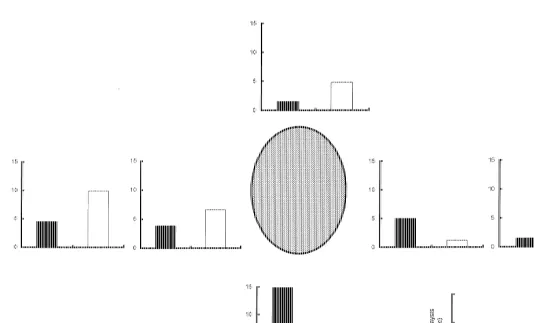
During the low-tide period, Neomysis abundance, water depth and flow were recorded at standard positions around rocks and macro-algal clumps situated in the lower part of the shore. With respect to the prevailing river flow, these were at the leading edge of the object, along its sides, in its lee and at two locations at least one metre away from either side of the structure (see Fig. 2). Neomysis were sampled simultaneously at these positions using standardised vertical hauls through the water column with a 1 mm mesh hand-net. Water depth and flow rate were then measured at each position, as above. It was not possible to repeat this at other tidal states because of the increased water depth.
2.2. Laboratory studies
In the laboratory studies, only mature individuals were used (c. 12 mm–16 mm length, rostrum to telson). These were freshly caught from the field site for each
experiment and held in aerated, sea-water (33‰, 148C), in low light levels for no longer
than 24 h prior to any experiment.
The distributions of Neomysis in relation to flow were recorded within a linear flume (8 m Armfield flume), 30 cm wide and 40 cm high. Approximately 100 individuals were introduced to an experimental area of the flume between two collimators 2 m apart under static flow conditions. After allowing 10 min for the animals to distribute themselves, the number of individuals within each of six depth sections in the water column was
recorded (0–2 cm, 2–5 cm, 5–10 cm, 10–15 cm, 15–20 cm and .20 cm from the
bottom) Subsequently, the free-stream flow velocity was increased to the following rates:
21 21 21 21 21
1.5 cm s , 4 cm s , 7 cm s , 8.5 cm s , 10 cm s . This was repeated seven times.
Boundary layer development within the flume was dependent upon free-stream velocity and distance along the flume test section. At the maximum free-stream velocity (10 cm
21
s ), the boundary layer was approximately 5 cm in depth (99% of free-stream
velocity). After each increase in flow velocity, individuals were allowed 2 min to distribute themselves and the number in each depth section recorded. For the initial experimental run, five recordings of distribution were made with zero flow. Flow velocity is reported as the mean flow rate of the free-stream velocity measured for the experimental test section based on the flow at a standard position in the flume tank above the boundary layer (midstream, 10 cm above the bed and 5 cm behind the leading collimator).
98 S.M. Lawrie et al. / J. Exp. Mar. Biol. Ecol. 242 (1999) 95 –106
column in each 5 cm depth class was recorded. For the initial experiment, six recordings were made at 10 min intervals for one set of individuals to assess the consistency of their distribution pattern over time (60 min). Four further experimental runs were carried out with each gradient, recording the distribution of individuals twice (20 min intervals) for each run.
3. Results
3.1. Field studies
At all states of the tide, Neomysis were distributed unevenly with depth (Fig. 1). For the majority of sampling occasions, individuals were aggregated into a band located just
behind the tide edge in a water depth of ,15–20 cm. The exception was during high
spring tides when individuals occurred over a much broader depth range. Furthermore, juveniles tended to gather in the shallower water in front of the adults At low tide, Neomysis were concentrated in the main channel, either in the shallow water at the channel edge, at the sediment–water interface, or aggregated around physical structures, such as stones and / or clumps of seaweed. Individuals were located in the lee of these
21
structures (Fig. 2) where flow was typically 0–3 cm s .
1
]
Flow rates measured at 3 depth and maximum depth rapidly increased from shallow
to deep water during low water slack and ebb tide periods (Fig. 3a–m). Flows of less
21
than 20 cm s were recorded only at the tide edge in relatively shallow water (,15 cm
21
depth). Flows close to the sediment–water interface were always less than 10 cm s ,
and often close to zero. During rising and high-tide periods, flow rates in the water column were markedly lower and at high tide were often too small to register (Fig. 3).
3.2. Laboratory studies
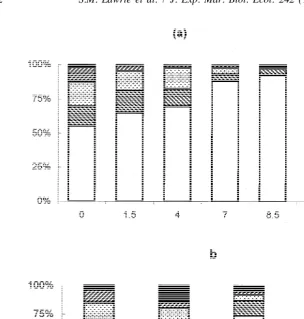
In the experimental flume, the depth distributions of individuals were remarkably consistent for each run (Fig. 4a). At zero flow, 48% of the individuals were swimming in
the water column between 2 and 20 cm from the bottom, with the remainder in the ,2
cm section. As current velocity increased, the proportion of individuals in the bottom
section (,2 cm water depth) also increased, with a consequent decline in the proportion
21
swimming in higher sections. At a flow of 7 cm s , more than 75% of individuals were
21
in the bottom section and at 10 cm s this had increased to more than 90%. In other
words, as flow increased, more individuals moved towards the flume bed and the
21
boundary layer (F4,1745536, P,0.0001). At flows greater than 10 cm s , individuals
were unable to maintain their position on the bottom of the tank and were washed backwards out of the experimental area.
It is possible that the observed changes in depth distribution with flow were due to entrainment of individuals into the low velocity boundary layer created by the floor of the flume. To examine this hypothesis, another boundary layer was created by floating a solid wooden plate fixed between the collimators at the water surface. At low current
21
S
.M
.
Lawrie
et
al
.
/
J.
Exp
.
Mar
.
Biol
.
Ecol
.
242
(1999
)
95
–
106
99
2
100
S
.M
.
Lawrie
et
al
.
/
J.
Exp
.
Mar
.
Biol
.
Ecol
.
242
(1999
)
95
–
106
S.M. Lawrie et al. / J. Exp. Mar. Biol. Ecol. 242 (1999) 95 –106 101
1 ]
102 S.M. Lawrie et al. / J. Exp. Mar. Biol. Ecol. 242 (1999) 95 –106
Fig. 4. Depth distribution of Neomysis in flume (a) open topped, (b) with roof fitted to provide an additional boundary layer (see text).
than had been recorded previously. However, as flow was increased, the general trends
in depth distributions were as before (Fig. 4b; F4,385296, P,0.0001). At zero flow,
21
47% of individuals were in the water column (.2 cm depth). At 7 cm s , less than
21
25% were in the water column and at 10 cm s , 95% of individuals were within the
bottom 2 cm section. Also, very few individuals (never more than 2–3%) used the boundary layer created by the sides of the flume. Reducing flow rates decrementally produced the reverse response to that described above.
S.M. Lawrie et al. / J. Exp. Mar. Biol. Ecol. 242 (1999) 95 –106 103
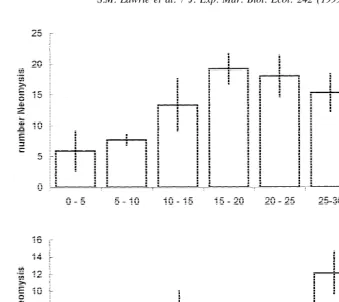
Fig. 5. Numbers of Neomysis in water of different depths in static tanks with different bed gradients.
4. Discussion
Neomysis showed a clear response to increasing flow in the experimental flume, moving to the bottom of the flume regardless of the presence of an alternative boundary layer. In other words, the response observed was due to the behaviour of the mysid, rather than a consequence of physical entrainment. However, Neomysis were unable to
21
maintain position on the flume bed in flows greater than 10 cm s . In the field, flows of
21
,10 cm s were only recorded next to the tide edge, at the sediment–water interface
(boundary layer) and in the lee of macro-algal clumps. These locations relate generally to those where Neomysis were recorded at high densities. With the exception of the
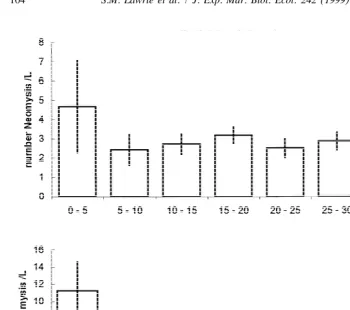
shallowest (,5 cm) section, the number of Neomysis at different depths in the tilted
tank (zero flow) was consistent with such a response and suggests that the distribution of Neomysis seen in the field is largely determined by the flow regime encountered, rather than water depth.
104 S.M. Lawrie et al. / J. Exp. Mar. Biol. Ecol. 242 (1999) 95 –106
Fig. 6. Density of Neomysis in water of different depths in static tanks with different bed gradients.
response of Neomysis to flow. Walesby (1973) found that Neomysis was able to maintain
21
position at current velocities up to 12 cm s , whilst Roast et al. (1998) observed
21
displacement at flows of 6–9 cm s . Roast et al. (1998) recorded a maximum
21
sustainable swimming speed of most adult Neomysis of 6 cm s and suggested that
position maintenance in undirectional flow is dictated by the maximum sustainable swimming speed. In addition, all these authors noted that more individuals maintained position by using the bottom boundary layer of the flume as flow was increased. The slightly higher threshold noted by Walesby (1973) may be due to his use of larger
animals (length 16.861.3 mm) compared with that used by Roast et al. (1561 mm) and
in the present study (1462 mm).
S.M. Lawrie et al. / J. Exp. Mar. Biol. Ecol. 242 (1999) 95 –106 105
difficult as drag increases. The difference between sand and mud is less clear, but Roast et al. (1998) suggest it may relate to the nature of the boundary layer and the development of rough turbulent rather than smooth turbulent flow conditions, depending on the size of the grains (Vogel, 1994). In the present study, sediment was not added to the flume (constructed of glass sides and with a smooth plastic base) and it is possible that more Neomysis would have been able to maintain themselves at high flow rates if mud had been provided. The field site in the present study is mud to muddy sand. Adult Neomysis might therefore be expected to maintain position on the mudflat at slightly higher flows than those recorded in the flume experiments,
In the field, a distinct band of Neomysis was recorded next to the tide edge throughout the flood and ebb periods on both spring and neap tides. Within this band, juvenile Neomysis tended to occur immediately in front of adults. Juveniles and adults were recorded in water no deeper than 9 cm and 16 cm, respectively, on spring tides and in 7 cm and 12 cm deep water on neap tides. Flow rates measured in the field declined with water depth during ebb flow and low-water slack (but not on the rising tide). Over much of these tidal periods, flow rates were in excess of those against which Neomysis can
21
swim or maintain position (.10 cm s ), except in the shallowest areas near the tide
edge, in agreement with the observed Neomysis distribution. During flood tides and high slack periods, there was no clear relationship between water depth and flow, so that flows recorded in water of 30 to 45 cm depth were all less than those against which Neomysis could swim and / or maintain position. At greater water depths flows were
21
typically in the range 30–45 cm s . On high spring tides, the range of depths over
which Neomysis occurred was much greater than for any other tidal state. On spring tides, the shallow water at the tide edge extended up onto the adjoining salt marsh, the edge of which presents a pronounced vertical barrier to Neomysis. Individuals aggre-gated at this barrier, where the water was 40 cm or more in depth. Thus, the depth range occupied by Neomysis on high spring tides is more a consequence of a steep change in the bed gradient at the edge of the marsh, rather than reflecting a broader band extending further away from the tide edge.
Nevertheless, Neomysis were aggregated towards the tide edge in much shallower water than would appear necessary to avoid a hostile flow regime on the rising tide. Additional factors such as avoidance of epibenthic predators (gobies, flounder and brown shrimp) which also move up with the rising tide to feed (Raffaelli et al., 1990), may therefore play some role in maintaining Neomysis concentrations at the tide edge during this phase of the tidal cycle.
References
Berrill, M. 1968. The schooling and anti-predatory behaviour of mysid shrimp. PhD thesis, Princeton University, NJ, p. 41.
Clutter, R.I., 1969. The microdistribution and social behaviour of some pelagic mysid shrimps. J. Exp. Mar. Biol. Ecol. 3, 125–155.
106 S.M. Lawrie et al. / J. Exp. Mar. Biol. Ecol. 242 (1999) 95 –106
Hough, A.R., Naylor, E., 1992. Distribution and position maintenance behaviour of the estuarine mysid
Neomysis integer. J. Mar. Biol. Ass. UK 72, 869–876.
Mauchline, J., 1971. The biology of Neomysis integer. J. Mar. Biol. Ass. UK 51, 347–354.
O’Brien, D.P., 1988. Direct observations of clustering (schooling and swarming) behaviour in mysids (Crustacea: Mysidacea). Mar. Ecol. Prog. Ser. 42, 235–246.
´
Ohtsuka, S., Inagaki, H., Onbe, T., Gushima, K., Yoon, Y.H., 1995. Direct observations of groups of mysids in shallow coastal waters of western Japan and southern Korea. Mar. Ecol. Prog. Ser. 123, 33–44. Parker, M., West, B., 1979. The natural history of Neomysis integer (Leach) in Lough Furnace, Co. Mayo, a
brackish water lough in the west coast of Ireland. Estuar. Coast. Mar. Sci. 8, 157–167.
Raffaelli, D.G., Richner, H., Summers, R., Northcott, S., 1990. Tidal migrations in the flounder (Platichthys
flesus). Mar. Behav. Physiol. 16, 249–260.
Roast, S.D., Widdows, J., Jones, M.B., 1998. The position maintenance behaviour of Neomysis integer (Peracarida:Mysidacea) in response to current velocity, substratum and salinity. J. Exp. Mar. Biol. Ecol. 220, 25–45.
Vogel, S. (Ed.), 1994. Life in Moving Fluids, Princeton University Press, p. 467.
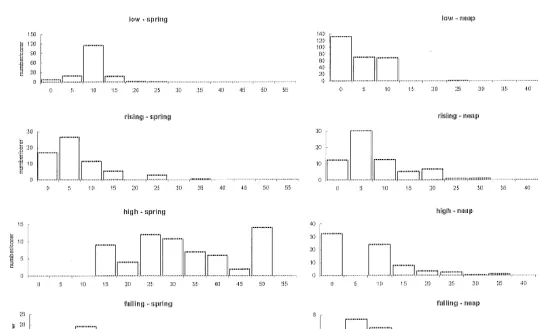
![Fig. 3. Variation in flow (open circles at]1depth and closed circles at bed) with water depth along transectsduring different tidal states.3](https://thumb-ap.123doks.com/thumbv2/123dok/3101043.1376004/7.612.111.364.66.588/variation-ow-circles-closed-circles-transectsduring-different-states.webp)