L
Journal of Experimental Marine Biology and Ecology 248 (2000) 53–78
www.elsevier.nl / locate / jembe
Lipid content and energy density of forage fishes
from the northern Gulf of Alaska
a ,* a b
J.A. Anthony , D.D. Roby , K.R. Turco
a
Oregon Cooperative Fish and Wildlife Research Unit, US Geological Survey, Biological Resources Division, and Department of Fisheries and Wildlife, Oregon State University, 104 Nsah Hall, Corvallis,
OR97331, USA
b
Institute of Marine Science, University of Alaska, Fairbanks, AK 99775, USA
Received 23 November 1998; received in revised form 16 February 1999; accepted 14 January 2000
Abstract
Piscivorous predators can experience multi-fold differences in energy intake rates based solely on the types of fishes consumed. We estimated energy density of 1151 fish from 39 species by proximate analysis of lipid, water, ash-free lean dry matter, and ash contents and evaluated factors contributing to variation in composition. Lipid content was the primary determinant of energy density, ranging from 2 to 61% dry mass and resulting in a five-fold difference in energy density
21
of individuals (2.0–10.8 kJ g wet mass). Energy density varied widely within and between species. Schooling pelagic fishes had relatively high or low values, whereas nearshore demersal fishes were intermediate. Pelagic species maturing at a smaller size had higher and more variable energy density than pelagic or nearshore species maturing larger. High-lipid fishes had less water and more protein than low-lipid fishes. In some forage fishes, size, month, reproductive status, or location contributed significantly to intraspecific variation in energy density. Differences in quality are sufficient to potentially affect diet selection of breeding seabirds, especially when transporting food for their young to the nest site. Published by Elsevier Science B.V.
Keywords: Energetics; Location; Proximate composition; Reproductive status; Size; Season
1. Introduction
Adult, juvenile, and larval fishes provide the bulk of the diet for many seabirds, marine mammals, and predacious fishes. In subarctic marine environments, food for fish stocks fluctuates on annual and decadal scales (Beamish and Bouillon, 1995),
influenc-*Corresponding author. Tel.:11-541-737-2462; fax:11-541-737-3590. E-mail address: [email protected] (J.A. Anthony)
ing forage fish abundance and condition throughout predator life cycles and affecting predator productivity (Braun and Hunt, 1983; Furness and Barrett, 1985; Springer et al., 1986). Timing of seasonal reproduction for predators is closely associated with food supply, because of relatively high energy demands for courtship, gamete production, incubation or gestation, lactation, and other post-natal care of young (Perrins, 1970; Lockyer, 1987). The distribution and abundance of some marine predators are strongly influenced by forage fish concentrations (Brown and Nettleship, 1983; Furness and Barrett, 1985; Payne et al., 1986). Declines in fish populations can lead to declines in predator populations, such as the reductions in seabirds, sea lions, and seals following a decrease in juvenile walleye pollock (Theragra chalcogramma) in Alaska (Springer, 1992).
As prey vary in resource value, optimally foraging predators must integrate this variability in simultaneously balancing costs and benefits to optimize survival and reproductive fitness (Stephens and Krebs, 1986). Predators rely on prey availability to satisfy nutritional and energy requirements (Murphy, 1994), but can compensate to some extent through adjustments in selection for prey quality (Ricklefs, 1979). For the
21
purposes of this study, we defined prey quality as energy density (kJ g wet mass). Energy density of lipid is about twice that of protein and carbohydrate (Schmidt-Nielsen, 1997, p. 171). Lipid content differs considerably among fishes (Clarke and Prince, 1980; Hislop et al., 1991; Van Pelt et al., 1997), which are generally low in carbohydrate and high in protein. Protein metabolism as an energy source is energetically expensive compared with lipid and carbohydrate metabolism (Schmidt-Nielsen, 1997). A diet high in lipid provides sufficient metabolizable energy for maintenance, so dietary protein can be allocated to tissue synthesis and growth in young predators (Roby, 1991). Differences in lipid content of prey could potentially influence adult predator survival or productivi-ty.
Seabird productivity is frequently energy-limited (Perrins et al., 1973; Drent and Daan, 1980; Roby, 1991). Birds have higher energy requirements than other vertebrates, after normalizing for body size. High power requirements of flight impose high mass-specific metabolic rates and birds can only meet their metabolic needs from stored reserves for short periods (Walsberg, 1983; Blem, 1990). Central place foragers optimize their energy delivery rate to the nest by increasing meal size or energy content (Orians and Pearson, 1979). As seabirds must transport food to the nest to feed their young, power requirements of flight limit transport capacity (Ricklefs, 1984; Ricklefs et al., 1985; Roby, 1991). Seabirds would be expected to select prey based on energy density, in addition to availability.
Few studies have investigated the energy content and nutritional value of forage fishes, despite their importance as food for many marine predators. Commercially harvested forage species (e.g. capelin Mallotus villosus, Pacific herring Clupea harengus
pallasi ) have received some attention (Jangaard et al., 1967; Nevenzel et al., 1969;
recent publications investigated the proximate composition of forage fishes from the Gulf of Alaska (Van Pelt et al., 1997; Payne et al., 1999), but these studies relied on a limited number of species and small sample sizes.
We examined the biochemical composition of forage fishes from Prince William Sound and Lower Cook Inlet in the northern Gulf of Alaska (NGOA) with a wide ranging sample of species, individuals, sampling sites, and life history stages. The major hypotheses tested were: (1) proximate composition (i.e. lipid, water, ash-free lean dry matter, and ash contents) and energy density differ among and within forage fishes from the NGOA; (2) inter- and intraspecific differences in energy density are determined primarily by differences in lipid content; and (3) factors such as size, sex, month, reproductive status, location, and year result in substantial intraspecific differences in lipid content and energy density. We restricted this study to prey of fish-eating seabirds during the breeding season in the NGOA, specifically when adults deliver food to their young. If the range in quality of forage fishes is sufficient to potentially influence predator selection of prey, the availability of fishes with higher energy density may influence survival, productivity, and demography of piscivorous predators.
2. Methods
We defined forage fishes as species commonly consumed by higher trophic levels and subdivided these taxa further into pelagic schooling (i.e. dwelling in schools) and nearshore demersal fishes (i.e. bottom-dwelling in lower intertidal and subtidal zones). This study focused on seabird prey and our sample is limited to fish ,300 mm standard
length. Of 39 species (n51151 fish), 18 were represented by sample sizes greater than
five individuals (Appendix A).
Fishes were collected in Prince William Sound (PWS) and Lower Cook Inlet (LCI), within the northern Gulf of Alaska (NGOA), with additional samples of eulachon (Thaleichthys pacificus) from Lynn Canal, southeastern Alaska. PWS was divided into three regions: northeastern (Valdez Arm, Port Fidalgo, Port Gravina), central (Naked, Block, Eleanor, Northern Knight, Smith, and Seal Islands), and southwestern (Knight Island Passage, Icy, and Whale Bays; Montague, Jackpot and Chenega Islands).
Fresh samples were collected by mid-water trawl, beach seine, cast net, dip net, minnow trap, and turning over rocks at low tide during the seabird breeding season (May through September) in 1995 and 1996. Small sample sizes were supplemented with whole fish that pigeon guillemots (Cepphus columba) or tufted puffins (Fratercula
cirrhata) delivered to their nestlings. Guillemot chick meals were collected by capturing
adults in mist nets or by picking up fish dropped near the nest. Puffin chick meals were collected by placing screens over burrow nest entrances, which caused some adults to drop their bill load of fish. Disturbance of the colonies was minimized.
Some samples were frozen at 2208C immediately; others were kept in a cooler
(,108C) or propane freezer (288C) before storage at 2208C. In the laboratory,
samples were partially thawed, weighed on an analytical balance (60.1 mg) to
determine wet mass, and measured for standard length (61 mm). Fish were identified to
1
Young-of-the-year (0 ) allocate energy differently than older juvenile and adult fishes (Love, 1970). Species with documented size–age relations were divided into their size–age classes (Smoker and Pearcy, 1970; Dick and Warner, 1982; Hatch and Sanger, 1992; L. Haldorson, University of Alaska, 11120 Glacier Highway, Juneau, AK 99801, personal communication). Male capelin ,90 mm standard length and female or
unknown sex capelin ,80 mm standard length were considered juveniles, reflecting
known sex differences in growth rate (Jangaard, 1974; Pahlke, 1985). Species without documented size–age relations were divided into ‘small’ and ‘large’ size classes at 100 mm for pelagic species and 80 mm for nearshore demersal species (Appendix A). The ‘small fish’ category appeared to approximate young-of-the-year adequately, and ‘large fish’ were either older juveniles (e.g. walleye pollock, Pacific tomcod Microgadus
proximus, Pacific cod Gadus macrocephalus) or included juveniles and adults (e.g.
Pacific sand lance Ammodytes hexapterus, Pacific herring).
Sex was determined by external morphology (adult capelin) or internal examination of gonads (adult sand lance, herring, eulachon, surf smelt) for a subsample of schooling fishes that can mature within the 300 mm size constraint. Reproductive status was assigned by examining ovaries or testes and classifying gonadal development into resting (stage 1: gonads ,0.5 body length in a light pink, thread-like strand),
developing (stage 2: gonads .0.5 body length), ripe (stage 3: gonads extend nearly
entire length of abdominal cavity in a turgid sac), running (stage 4: similar to stage 3 but contents spontaneously emerge with light pressure), and spent (stage 5: gonads shrunken with some contents visible).
Water content of wet mass was determined by drying each fish to constant mass in a convection oven at 608C. Chick meals were not included in analyses involving wet mass,
because these fish may have been desiccated before collection. Each fish was ground and homogenized thoroughly with mortar and pestle before extraction. Samples ,2 g dry
mass collected in 1995 were pooled to attain a sample mass of 2–3.5 g for lipid extraction, whereas those collected in 1996 were analyzed individually. Total lipids were extracted from dried samples with a Soxhlet apparatus and a solvent system of 7:2 (v / v) hexane / isopropyl alcohol. This solvent system is relatively non-toxic; extracts most complex lipids, such as structural lipids (e.g. phospholipids, sterols) and neutral lipids (storage forms such as triacylglycerols and wax esters); and does not extract non-lipids (Radin, 1981). Water content of lean mass was calculated by dividing water mass by the difference between wet mass and lipid mass. The samples, now dry and lean, were transferred to glass scintillation vials and incinerated in a muffle furnace at 5508C for 12
h. Ash content was determined by weighing the remaining portion, mostly composed of mineral from skeletal material. Protein content was estimated by ash-free lean dry matter (AFLDM; 94% protein; Montevecchi et al., 1984). We express AFLDM as % lean dry mass, because it was determined from the ash content of the lipid-free dry fish. Carbohydrate content was assumed to be negligible (,0.6%; Sidwell et al., 1974;
Stansby, 1976; Craig et al., 1978).
21
Energy density (kJ g ) of wet mass and dry mass were calculated from proximate composition with published energy equivalents for these fractions (Schmidt-Nielsen,
21
excrete uric acid as their primary nitrogenous waste, so we used the energy equivalent of
21
protein for uricotelic vertebrates (17.8 kJ g ). Energy density of individual fish on a wet mass basis was calculated by:
21
Energy density (kJ g wet mass)5(12WF)([LF?39.3]1[AFLDMF?17.8])
(1)
where WF is the water fraction of fresh fish mass, LF is the lipid fraction of dry fish mass, and AFLDMF is the ash-free lean dry matter fraction of dry fish mass. Energy density of individual fish on a dry mass basis was calculated by:
21
Energy density (kJ g dry mass)5(LF?39.3)1(AFLDMF?17.8) (2)
21
Unless otherwise noted, ‘energy density’ refers to kJ g wet mass and ‘lipid content’ refers to % dry mass. Energy density based on wet mass is relevant in assessing relative prey quality for breeding seabirds, because fish are transported back to the nest in this form. Expressing energy density based on dry mass is appropriate for interspecific comparisons (Table 1, Appendix B), because it minimizes effects related to variation in water content from desiccation (Montevecchi and Piatt, 1984).
Data were analyzed with Statview (Abacus Concepts, Berkeley, CA 94704). All proportional data underwent arcsin transformation. The level of statistical significance was a 50.05 for all tests.
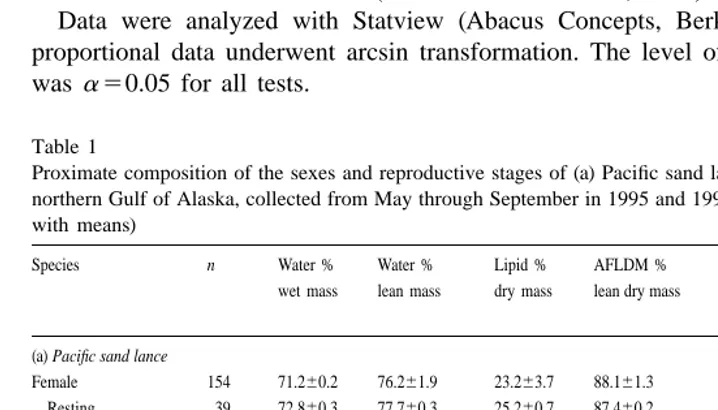
Table 1
Proximate composition of the sexes and reproductive stages of (a) Pacific sand lance and (b) capelin from the northern Gulf of Alaska, collected from May through September in 1995 and 1996 (standard error is presented with means)
Species n Water % Water % Lipid % AFLDM % Energy density wet mass lean mass dry mass lean dry mass
21 21
kJ g dry mass kJ g wet mass
(a) Pacific sand lance
Female 154 71.260.2 76.261.9 23.263.7 88.161.3 20.660.88 5.7960.54 Resting 39 72.860.3 77.760.3 25.260.7 87.460.2 20.860.15 5.5960.09 Developing 51 71.060.3 75.760.2 22.760.4 88.360.1 20.660.11 5.9160.07 Ripe 48 70.660.5 75.360.3 20.460.7 88.360.2 19.960.18 5.7160.12 Male 141 73.060.3 77.262.0 20.664.9 87.561.1 19.961.20 5.2560.73 Resting 34 73.260.3 77.860.3 24.360.8 87.560.2 20.760.20 5.4360.09 Developing 38 72.360.5 76.560.3 19.960.7 87.660.1 19.760.18 5.3860.15 Ripe 50 75.060.3 78.260.3 16.660.5 87.060.2 19.060.14 4.6560.08
(b) Capelin Sexes combined
3. Results
3.1. 1 Interspecific variation in proximate composition
3.1.1. Lipid content
Forage fish species exhibited a ten-fold difference in mean lipid content, ranging from 5% dry mass in Pacific tomcod to 50% in eulachon (Fig. 1). Most species averaged 10–25% lipid (Appendix B).
When only large fish (.100 or .80 mm) were analyzed, mean lipid content ranged
from 3% in tomcod to 50% in eulachon (Fig. 1; analysis of variance, F 542.9, 17,805
P,0.01). Based on lipid content, five groups were discernable among the 18 species
represented by more than five individuals (Fig. 1; analysis of variance with Bonferroni– Dunn multiple comparison, F 5179, P,0.01). Adult eulachon and northern
4,822
lampfish (previously northern lanternfish; Stenobrachius leucopsarus) had the highest mean lipid contents. Pacific herring was next, followed by a group of Pacific sand lance, capelin, and Pacific sandfish (Trichodon trichodon). The fourth group was predominantly
nearshore demersal fishes, such as slender eelblenny (Lumpenus fabricii ), arctic shanny (Stichaeus punctatus), snake prickleback (Lumpenus sagitta), crescent gunnel (Pholis
laeta), and northern ronquil (Ronquilus jordani ); but also included a few pelagic fishes,
namely surf smelt (Hypomesus pretiosus) and prowfish (Zaprora silenus). Low-lipid fishes were in the fifth group, composed of tidepool sculpin (Oligocottus maculosus), Pacific cod, pink salmon (Oncorhynchus gorbuscha), walleye pollock, and Pacific tomcod.
Mean lipid content of small fishes (,100 or,80 mm) ranged from 5% in tomcod to
18% in capelin (Appendix B; analysis of variance, F 519.3, P,0.01). Species high 11,276
in lipid as adults generally were lower in lipid as young-of-the-year. Capelin had the highest lipid content of small fishes, despite a wide range with some individuals containing only 1–2% lipid. Young-of-the-year capelin and sand lance had relatively high lipid contents compared to other small fishes, and were high-lipid as adults. Young-of-the-year herring had only moderate lipid content, despite high lipid content in older fish.
3.1.2. Water content
Mean water content of wet mass ranged from 62% in lampfish to 84% in prowfish (Appendix B) and was correlated negatively with lipid content for large fishes (R5 2
0.73, P,0.01). Eulachon was an outlier, with a much higher water content of wet mass
(71%) than expected for its high lipid content (50%).
Water content expressed as a percentage of lean mass reflects the degree of hydration of muscle and other lean tissue. Mean water content of lean mass for large fishes varied from 73% in lampfish to 85% in prowfish (Appendix B; analysis of variance, F 5
17, 742
54.4, P,0.01). The correlation between water content (% lean mass) and lipid content
was not significant.
3.1.3. Ash-free lean dry matter content
Mean AFLDM content of lean dry mass differed from 79% in tidepool sculpin to 89% in sand lance and surf smelt (Appendix B; analysis of variance, F 533.3, P,0.01).
17, 794
Most fish averaged 86–88% AFLDM. Lipid content was correlated positively with AFLDM content of lean dry mass (R50.43, P,0.02). Therefore, high-lipid fish tended
to have a higher protein content of lean dry tissue than did low-lipid fish. No relation between AFLDM content (% lean dry mass) and water content (% lean mass) was apparent.
3.1.4. Energy density
Forage fish species in the ‘large’ category exhibited a three-fold difference in mean
21 21
energy density, ranging from 3.0 kJ g wet mass in prowfish to 8.5 kJ g in lampfish (Fig. 2; analysis of variance, F 522.7, P,0.01). Energy density for most species
17,797
21
averaged 4–6 kJ g . Individual forage fish exhibited a five-fold difference in energy
21
density, ranging from 2.0 to 10.8 kJ g (Appendix B).
Based on energy density, four groups were apparent in the 18 species represented by more than five individuals (analysis of variance with Bonferroni–Dunn multiple comparison, F 5120, P,0.01). Adult lampfish and eulachon had the highest mean
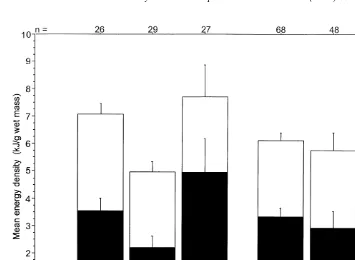
21
Fig. 2. Relative contributions of lipid content and AFLDM content toward total energy density (kJ g wet mass) of forage fishes ($100 mm) from the northern Gulf of Alaska, 1995 and 1996. Error bars represent two standard errors about the means or roughly the 95% confidence interval. Species connected with lines above the bar graph have no significant difference in energy density among species (univariate ANOVA with Bonferroni–Dunn muliple comparisons test). Sample sizes are indicated above each bar.
energy densities (Fig. 2), associated with very high lipid contents. Herring and sand lance were next, followed by a group consisting of capelin, sandfish, slender eelblenny, crescent gunnel, arctic shanny, snake prickleback, and surf smelt. Lowest mean energy densities were in the group of northern ronquil, tidepool sculpin, pink salmon, cod, pollock, tomcod, and prowfish.
Energy density of small fish differed significantly among species (analysis of variance,
F 529.8, P,0.01). Young-of-the-year sand lance had the highest mean energy 10,266
21 21
density (5.1 kJ g ), while small prowfish had the lowest (2.8 kJ g ; Appendix B).
3.1.5. Proximate composition as it relates to energy density
Lipid content of dry mass was the primary determinant of energy density, explaining
2
83% of interspecific variation (forward stepwise multiple regression partial r 50.83,
P,0.01). Variation in water content of lean mass explained an additional 14% of the 2
energy density of forage fishes were explained almost entirely by variation in lipid
2
content and water content of lean mass (multiple r 50.97, P,0.01). Ash content (or
conversely, AFLDM content) of lean dry mass did not explain a significant proportion of the variance, apparently due to little variance among species.
3.2. Intraspecific variation in proximate composition
Variation in proximate composition differed among species. Pelagic schooling fishes tended to have higher intraspecific variance than nearshore demersal species (variance ratio F-test, F50.097, P,0.01). Lipid content of capelin was extremely variable in
both young-of-the-year (2–39%) and older fish (3–51%). Herring exhibited a similarly large six-fold variation in lipid content of young-of-the-year (5–32%) and ten-fold variation in older fish (5–55%). Sand lance had a four-fold difference in lipid content for young-of-the-year (8–35%), which was greater than for older fish (14–35%). Less intraspecific variability was apparent in other species, such as a two-fold difference in walleye pollock, with 5–9% in small fish and 3–10% in large fish. Arctic shanny ($80
mm) varied little, with lipid content ranging from 12 to 18%.
3.2.1. Size
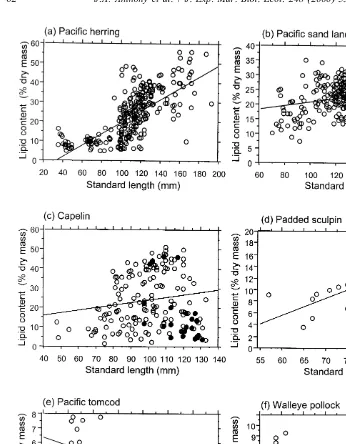
Pelagic species maturing at a smaller size were more variable than pelagic or nearshore species maturing at a larger size. Size differences in lipid content were detected within our 300-mm size constraint. In some species, standard length and lipid content were correlated positively (Fig. 3a–d, Appendix B): herring (R50.73, P,0.01),
pre-spawning sand lance (R50.25, P,0.01), pre-spawning capelin (R50.24, P,0.01),
padded sculpin (R50.72, P,0.01), sandfish (R50.85, P,0.01), and surf smelt (R5
0.76, P,0.05). In contrast, size and lipid content were correlated negatively in tomcod
(Fig. 3e; R5 20.44, P,0.05). For other species, size and lipid content were not
correlated (e.g. walleye pollock [Fig. 3f], Pacific cod).
Herring demonstrated an especially dramatic increase in lipid content from young-of-the-year to older fish (Fig. 3a; analysis of variance, F 5163, P,0.01). The largest
1,288
herring in our sample (140–300 mm) averaged almost twice the lipid content of the 100–140 mm size-class and three times that of the,100 mm size-class (Mean6S.E.:
3861.6, 2560.7, and 1060.5%, respectively; F 5129, P,0.01). 2,287
Pahlke (1985, cited in Hatch and Sanger, 1992) defined age-classes for capelin as
1 1
,50 mm for young-of-the-year, 50–90 mm for age 1 , 90–125 mm for age 2 , and
1
.125 mm for age 3 . In pre-spawning capelin (Fig. 3c), lipid content increased from
1 1
1861.8% for juveniles to 2561.5% for 2 capelin to 3262.4% for 3 capelin.
3.2.2. Sex
Of those species where sex was determined, only Pacific sand lance demonstrated significant differences in lipid content between the sexes (Table 1a). Female sand lance had higher lipid content (23.263.7%) than did males (20.664.9%; analysis of variance,
21
F 524.5, P,0.01), with concomitant higher energy density (5.79 vs. 5.25 kJ g ; 1,212
Fig. 3. Realation between standard length (mm) and lipid content (% dry mass) of some forage fishes sampled in the northern Gulf of Alaska in 1995 and 1996: (a) Padded sculpin, (b)Pacific herring, (c) Pacific sand lance, (d) Capelin, with spent fish indicated by solid symbols, (e) Pacific tomcod, and (f) Walleye pollock. Scale differs among graphs.
3.2.3. Month
Fig. 4. Monthly differences in lipid content (% dry mass) of juvenile capelin and juvenile and adult Pacific sand lance from the northern Gulf of Alaska, 1995 and 1996. Error bars represent two standard errors about the mean or roughly the 95% confidence interval.
Lipid content of older capelin decreased significantly from June through September (Fig. 4; analysis of variance, F 523.2, P,0.01), such that energy density in June
3,146
21 21
(6.760.60 kJ g ) steadily decreased from July (5.361.6 kJ g ) through August
21 21
(4.060.88 kJ g ) to a low in September (3.760.87 kJ g ; F 523.2, P,0.01). 3,146
Lipid content of older sand lance declined steadily from June through September (Fig. 4; analysis of variance, F 524.4, P,0.01). Reflecting changes in lipid content,
3,309
21
energy density decreased from June (5.660.09 kJ g ) through September (4.960.10
21
kJ g ; F 513.1, P,0.01). 3,308
Young-of-the-year sand lance in PWS decreased in lipid content from June to July, but increased again in August (Fig. 4; analysis of variance, F 56.80, P,0.01). The
2,31
AFLDM content of lean dry mass increased from June (8760.5%) through August
(9060.7%; F 55.72, P,0.01). Driven by these changes in lipid content and AFLDM 2,30
21
content of lean dry mass, energy density was highest in June (6.560.11 kJ g ),
21 21
decreased in July (4.8 kJ g 60.15), and increased again in August (5.360.19 kJ g ;
F 59.39, P,0.01). 2,31
3.2.4. Reproductive status
and developing stages (analysis of variance, F 57.42, P,0.01). Thus, energy density 4,88
for resting and developing capelin was higher than ripe, running, and spent capelin (F 55.11, P50.01). The AFLDM content of lean dry mass was significantly higher
4,88
for resting, developing, and ripe capelin compared to those in running and spent stages (F 56.38, P,0.01).
4,84
In sand lance, lipid content decreased from resting to ripe fish (Table 1a) for both females (analysis of variance, F 511.5, P,0.01) and males (F 527.6, P,0.01).
2,102 2,91
Therefore, energy density decreased significantly from resting to ripe in both females (F 54.26, P,0.02) and males (F 510.4, P,0.01). Resting female sand lance
2,101 2,91
had lower AFLDM content of lean dry mass than did developing and ripe females (F 58.43, P,0.01). Resting and developing males had higher AFLDM content of
2,102
lean dry mass than ripe males (F 53.81, P,0.03). 2,91
3.2.5. Location
Considerable variation in lipid content within size-classes of Pacific herring was attributable to location within PWS (analysis of variance, F 530.9, P,0.01).
8,264
Differences were most pronounced in 100–140 mm herring, because the composition of fish ,100 and .140 mm were similar among locations. Herring (100–140 mm) from
northeastern PWS had significantly higher lipid content (2960.1%) than those from
central (2461.3%) or southwestern PWS (2161.3%; F 511.1, P,0.01). Conse-2,181
quently, energy density of herring (100–140 mm) was higher in northeastern PWS
21 21
(6.360.15 kJ g ) than either central (5.260.19 kJ g ) or southwestern PWS
21
(4.860.15 kJ g ; F 524.8, P,0.01). Energy density of herring (100–140 mm) 2,178
from central PWS was marginally higher than from southwestern PWS (P50.047).
Pacific herring (.140 mm) from PWS had higher lipid content than those from LCI
(4161.9 vs. 3262.7%; analysis of variance, F 59.90, P,0.01), which resulted in
Pacific herring (100–175 mm) from PWS had higher energy density in 1995
21 21
(6.360.22 kJ g ) than in 1996 (5.660.13 kJ g ; analysis of variance, F 56.91, 1,204
P,0.01). Among the three regions, herring in southwestern PWS had the highest lipid
content and energy density in 1995 (Fig. 5), much higher than this region in 1996 for both lipid content (F 515.8, P,0.01) and energy density (F 522.3, P,0.01). In
1,71 1,69
contrast, herring in northeastern PWS in 1996 had less variance in lipid content between the two years than in southwestern (variance ratio F-test, F50.36, P,0.01) and central
PWS (variance ratio F-test, F51.72, P,0.03).
3.2.7. Proximate composition as it relates to energy density
21
Fig. 5. Relative contributions of lipid and AFLDM toward total energy density (kJ g wet mass) of Pacific herring from Prince William Sound, Alaska, in 1995 and 1996. Error bars represent two standard errors about the mean or roughly the 95% confidence interval. Sample sizes are indicated above each bar.
In a few species, ash content (or AFLDM content) of lean dry mass explained a significant proportion (1–5%) of the intraspecific variation in energy density (Table 2d). Many forage fishes demonstrated a close correlation between water content (% wet
21
mass) and energy density (kJ g wet mass). Thus, water content is a cost- and time-efficient way to estimate species-specific energy density in lieu of proximate analysis or bomb calorimetry (Table 3).
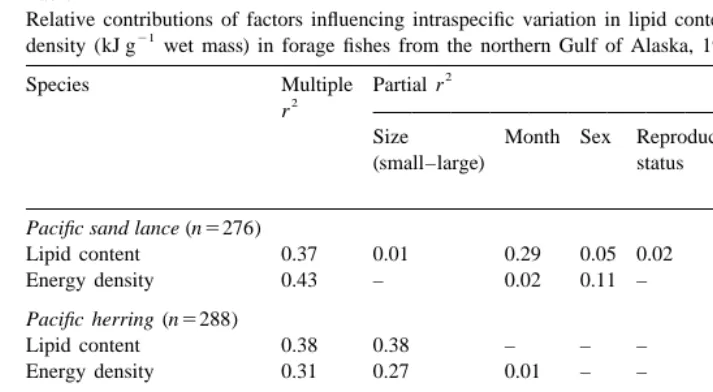
3.2.8. Relative contributions of factors influencing variation
Size and month were the most influential factors contributing to intraspecific variation in lipid content and energy density, with notable contributions from sex, reproductive status, and location (PWS vs. LCI; Table 4). Reproductive status was confounded with month. Location within PWS and year did not explain much of the variation in lipid content or energy density.
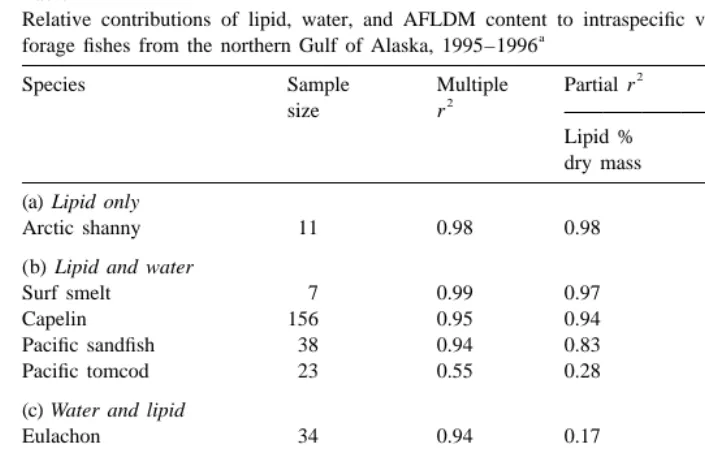
Table 2
Relative contributions of lipid, water, and AFLDM content to intraspecific variation in energy density of
a
forage fishes from the northern Gulf of Alaska, 1995–1996
2
Species Sample Multiple Partial r
2
size r
Lipid % Water % AFLDM %
dry mass lean mass lean dry mass (a) Lipid only
Arctic shanny 11 0.98 0.98 0 0
(b) Lipid and water
Surf smelt 7 0.99 0.97 0.02 0
Capelin 156 0.95 0.94 0.01 0
Pacific sandfish 38 0.94 0.83 0.11 0
Pacific tomcod 23 0.55 0.28 0.27 0
(c) Water and lipid
Eulachon 34 0.94 0.17 0.77 0
Prowfish 23 0.85 0.34 0.51 0
(d) Lipid, water, and ash
Pacific herring 277 0.95 0.87 0.07 0.01
Pacific sand lance 276 0.94 0.78 0.15 0.01
Crescent gunnel 42 0.95 0.74 0.17 0.04
Walleye pollock 42 0.79 0.46 0.28 0.05
Pacific cod 18 0.90 0.73 0.15 0.02
a 2
Adjusted regression coefficients (r ) were the result of a forward stepwise multiple regression within species. All probabilities were P,0.01.
Table 3
21
Simple linear regression equations predicting energy density (kJ g wet mass; y) from water content (% wet
a
mass; x) for forage fishes sampled in the northern Gulf of Alaska
2
Species Sample size Regression equation r
Capelin 152 y532.2236.1x 0.97
Crescent gunnel 36 y518.8219.3x 0.58
Eulachon 33 y528.7230.0x 0.97
Lingcod 11 y517.8218.3x 0.77
Pacific cod 18 y520.5221.7x 0.83
Pacific herring 277 y532.4236.8x 0.95
Padded sculpin 12 y533.7239.1x 0.92
Pacific tomcod 19 y520.1222.1x 0.48
Pink salmon 49 y518.2218.7x 0.86
Prowfish 24 y516.6216.4x 0.74
Pacific sand lance 278 y524.4226.2x 0.80
Pacific sandfish 37 y525.3227.6x 0.36
Slender eelblenny 22 y523.5225.2x 0.80
Walleye pollock 45 y517.9218.3x 0.70
a
Table 4
Relative contributions of factors influencing intraspecific variation in lipid content (% dry mass) and energy
21 a
density (kJ g wet mass) in forage fishes from the northern Gulf of Alaska, 1995–1996
2
Species Multiple Partial r
2
r
Size Month Sex Reproductive Location Year
(small–large) status
b c
NGOA PWS
Pacific sand lance (n5276)
Lipid content 0.37 0.01 0.29 0.05 0.02 – – –
Energy density 0.43 – 0.02 0.11 – 0.26 – 0.04
Pacific herring (n5288)
Lipid content 0.38 0.38 – – – – – –
Energy density 0.31 0.27 0.01 – – – – 0.03
Capelin (n5178)
Lipid content 0.35 – 0.17 – 0.18 – – –
Energy density 0.23 – 0.10 – 0.13 – – –
Walleye pollock (n544)
Lipid content 0.15 0.14 – – – – – –
Energy density 0.24 0.24 – – – – – –
a 2
Adjusted regression coefficients (r ) were the result of a forward stepwise multiple regression on indicator variables within species.
b
All probabilities were P,0.05. Location in the northern Gulf of Alaska is either Prince William Sound or Lower Cook Inlet.
c
Location in Prince William Sound is either northeastern, central, or southwestern regions.
content and energy density in herring and pollock, whereas month and reproductive status were most influential in capelin.
It is noteworthy that less than 50% of the intraspecific variation in lipid content and energy density was explained by the potentially influential factors of size, sex, month, reproductive status, location in NGOA, location in PWS, and year. Any residual, unexplained variation in lipid content and energy density was assumed to be related primarily to individual variation in condition.
4. Discussion
4.1. Differences in fish quality
Proximate composition and energy density differed among and within forage fishes from NGOA (hypothesis 1). Differences in the quality of forage fishes were sufficient to potentially influence prey selection by predators. Seabirds, marine mammals, and predacious fishes could experience a ten-fold difference in lipid content (% dry mass)
21
and a five-fold difference in energy density (kJ g wet mass), based on prey choice. Increased energy intake rate through prey selection would be especially important to seabirds raising young, which have limited transport capacity (e.g. size of bill or foregut; Ricklefs, 1984; Ricklefs et al., 1985; Roby, 1991) and high energy cost of transport (Walsberg, 1983; Blem, 1990). In addition to increasing energy provisioning rates to the brood, parents selecting high-energy prey can potentially adjust their time and energy costs by making fewer trips between foraging areas and nest site, foraging farther from the colony, raising more young per nesting attempt, raising young with larger fat reserves, and / or reducing parental investment to enhance their own survival (Ashmole, 1971; Drent and Daan, 1980; Ricklefs, 1984; Laugksch and Duffy, 1986; Obst, 1986). Seabird parents that provision their young with high-lipid fish raise faster growing nestlings that fledge earlier and have larger fat reserves, attributes that presumably enhance pre- and post-fledging survival (Ricklefs, 1979; Ricklefs, 1983; Massias and Becker, 1990).
A clear dichotomy in quality was found among pelagic forage fishes with high-lipid (e.g. lampfish, eulachon, Pacific herring, Pacific sand lance, capelin) and low-lipid contents (e.g. walleye pollock, Pacific cod, Pacific tomcod). Some similarities existed among species from the same taxonomic family: osmerids (e.g. eulachon, capelin, surf smelt) tended to be high-lipid (30618%) for fish $100 mm; gadids (e.g. pollock, cod,
tomcod) were low-lipid (662%); and stichaeids, a family of nearshore demersal fishes
(e.g. arctic shanny, slender eelblenny, snake prickleback), were intermediate (1462%).
Other families were not well represented in our sample. We demonstrated that pelagic fishes varied considerably in their lipid content and energy density, whereas nearshore demersal species were consistently intermediate.
Pelagic species attaining maturity at a smaller size (e.g. sand lance, capelin) had higher and more variable energy density than did species reaching maturity at a size larger than our upper limit of 300 mm (e.g. gadids, salmonids). Size-related differences in lipid content among pelagic fishes result from changes in allocation of energy for maintenance, growth, reproduction, and storage with maturity. Some species attaining reproductive maturity at a smaller size invest relatively less energy in growth and invest in reproduction earlier than fishes reaching maturity at a larger size (Calow and Townsend, 1981). Young organisms allocate a higher proportion of assimilated energy to growth. Rapid weight gain early in life requires more protein turnover than does normal weight gain and maintenance in adults, such that older fish store more energy as lipid (Harris et al., 1986).
4.2. Variation in energy density from proximate composition
the variation among species in energy density and water content of lean mass explained an additional 14%. Variation in ash content of lean dry mass (or conversely, AFLDM content) did not explain a significant proportion of the variation in energy density among species, but did explain 1–5% of the intraspecific variation in some species. Variation in water content of lean mass explained the majority of intraspecific variation in energy density for a few fishes with high water content of lean tissue (i.e. prowfish, eulachon).
4.3. Factors influencing intraspecific variation in energy density
Piscivorous predators can potentially increase energy intake by selecting prey within species for such factors as size, sex, month, reproductive state, location, and year to enhance lipid content and energy density (hypothesis 3). In this study, size and month were most influential to variation in lipid content and energy density, with notable effects from sex, reproductive status, and location. Similar-sized conspecifics from the NGOA had similar lipid content and energy density, based on comparisons between this study, Van Pelt et al. (1997), and Payne et al. (1999). As size of fish and month of collection were comparable among these studies, any differences within species are probably related to effects of sex, reproductive status, location, or year.
4.3.1. Size
Pelagic fishes that mature at a smaller size were more variable than pelagic or nearshore species that mature at a larger size. We observed increasing lipid content with increasing size for many species (e.g. herring, sand lance, padded sculpin), supporting increased allocation of energy to storage with maturity. Lipid content was correlated negatively with size for some species (e.g. tomcod). Other fishes showed no correlation between size and lipid content (e.g. walleye pollock, cod).
In organisms with high juvenile mortality, selection favors rapid growth to adult size (Calow and Townsend, 1981). Juveniles allocate their energy to somatic growth to increase locomotive efficiency, predator evasion, and food procurement. Once an organism is large enough to reduce predation pressure, selection favors maintaining an energy reserve, especially if life expectancy is long compared to the periods of food scarcity and reproduction (Calow and Townsend, 1981).
4.3.2. Sex
4.3.3. Month and reproductive status
Productivity in the Gulf of Alaska pulses with bimodal phytoplankton blooms in spring (April–May) and autumn (September–October) that, after a short time lag, support high densities of zooplankton that further serve as food for planktivorous fishes (Cooney and Coyle, 1988). Many animals perform energetically expensive activities (e.g. reproduction, larval release) during these periods of food abundance (Love, 1970). Monthly differences in intraspecific lipid content and energy density appear to reflect fluctuations in reliance on stored energy reserves and procured nutrients for survival, growth, and reproduction. Fish allocating most of their energy to somatic growth or reproduction in spring and summer must shift to increasing lipid storage to survive overwintering (Love, 1970).
Capelin in Alaska are thought to spawn nearshore from late May to early June (Warner and Shafford, 1979, quoted in Dick and Warner, 1982), after the spring bloom, followed by offshore movement before or around the autumn bloom. Our results support commencement of spawning in May, as many capelin in our sample were already spent in July (when we first identified reproductive stage). Also, a small sample of spent males was collected as early as 26 May in 1996. Our data suggest spawning extends through September, as the proportion of spent capelin continued to increase throughout the summer.
Capelin have adapted to productivity cycles by fasting when resources are low during overwintering and spawning and feeding on the blooms during pre-spawning and post-spawning (Winters, 1970). The highest lipid content in capelin was recorded in June and decreased dramatically with advancing reproductive stage throughout the summer, in concordance with prey availability and investment in reproductive structures and behaviors. For example, lipid content of resting capelin decreased by 30% between July and August (34611 vs. 23614%), followed by a more than 50% decline by
September (1066%).
Sand lance use a different reproductive strategy than capelin by spawning mid-autumn, before or during the bloom. Sand lance had the highest lipid content in June. We observed ripe sand lance as early as July and as late as September. The incidence of ripe sand lance in our sample increased throughout the summer, corresponding to a steady decline in lipid content. Sand lance appear to increase investment in reproduction, rather than energy storage, as autumn approaches. These differences in reproductive strategies between sand lance and capelin influence temporal reliance on stored energy reserves.
4.3.4. Location
Geographic variation in lipid content and energy density was evident in some forage fishes. Location effects may have resulted from differences in abundance and possibly nutritional quality of zooplankton prey. Herring provided an exceptional example of the influence of geographic location on lipid content and energy density, both within PWS and between PWS and LCI. Herring in the size range of 100–140 mm, presumably the
1
population of zooplankton. Consequently, densities of calanoid copepods in the northeastern portion of PWS may be greater to possibly provide more food for zooplanktivores, such as herring (Cooney and Coyle, 1988). Regional and seasonal differences in prey availability could explain differences in body growth (Ware, 1985) and lipid reserves.
4.3.5. Year
Most forage fish species represented by adequate sample sizes did not exhibit annual differences in composition. Differences between 1995 and 1996 in energy density of herring suggested that the availability and / or quality of their food may have been better in 1995. Juvenile herring (100–175 mm) from southwestern PWS in 1995 had about 25% higher lipid content than those from northeastern PWS and more than twice the lipid content of those from central PWS. In 1996, these regional differences were no longer apparent. In 1996, herring from southwestern PWS had the lowest lipid content, herring from northeastern PWS had the highest lipid content, and there was less regional variation in lipid content compared with 1995.
4.4. Implications for piscivorous predators
Birds appear to be able to select prey based on composition of macronutrients and micronutrients to satisfy their nutritional and energy requirements (Murphy, 1994). Differences in prey quality clearly can alter energy provisioning rates to seabird young (Ricklefs, 1984; Ricklefs et al., 1985; Roby, 1991; Lance and Roby, 2000), suggesting that seabirds may select prey based on energy density. Given the high lipid content and energy density of lampfish and eulachon, it seems reasonable that seabirds would select these taxa. These fishes are consumed by seabirds and marine mammals in Alaska (Fritz et al., 1993; Lance and Roby, 1998), but are not prevalent in seabird diets in the study area. Lampfish are meso-pelagic and eulachon are bathy-pelagic fishes, both living mostly beyond the continental shelf (Parks and Zenger, 1979). Their habitat preferences and behavior provide a partial refuge from predators in NGOA. Lampfish become available to predators only during their vertical migration to the surface at night to prey
1
on plankton (Fast, 1960), while juvenile eulachon remain at depth until age 3 , when these anadromous fish migrate to rivers to spawn (Barraclough, 1964). Instead, herring, sand lance, and capelin, the three next most energy-dense species, are available to predators nearshore and in shallow water. Generally, these three species are the primary prey of piscivorous seabirds in the NGOA (Springer, 1991; Hatch et al., 1993).
Seabirds apparently select prey based on species. As the intraspecific variation in lipid content of forage fishes is as much as ten-fold, it is potentially advantageous for piscivorous predators to select for characteristics within species, in addition to selection among species. Selection of forage fish based on month or size would have the greatest potential effect on energy intake rates, while selection based on sex, reproductive status, or location would also enhance diets composed of some species.
in a resting stage of reproduction. Predators consuming capelin should select for resting and developing stages of reproduction. Feeding on capelin early in the summer and switching to sand lance later would increase energy intake rates, if availability were equal. Predators feeding on herring may be able to enhance energy density of the diet by selecting prey in certain regions of PWS, but the regions supporting the highest quality herring apparently differ among years.
Proximate composition and energy density of prey can be integrated in bioenergetics models with prey selection, predator / prey abundance and distribution, and predator metabolic requirements to understand how ecosystem shifts influence marine trophic structure. The NGOA ecosystem appears to be undergoing a shift in the abundance and species composition of forage fishes. The incidence of Pacific sand lance, Pacific herring, and capelin in seabird diets has fluctuated (Hatch et al., 1993; Oakley and Kuletz, 1996; Piatt and Anderson, 1996), coincident with population fluctuations of these forage fishes (Anderson et al., 1994; Piatt and Anderson, 1996). These species have high energy densities compared to the juvenile pollock that are apparently declining in the pelagic zone (Anderson et al., 1994). Potentially, the range in quality of forage fishes is sufficient to influence predator selection of prey, such that the availability of higher quality fishes may influence productivity of piscivorous predators.
5. Conclusions
1. Forage fishes exhibited a ten-fold difference in lipid content (% dry mass) and a
21
five-fold difference in energy density (kJ g wet mass), such that predators could potentially experience large differences in foraging efficiency depending on prey choice.
2. Schooling pelagic fishes tended to have either relatively high or low lipid content and energy density, whereas nearshore demersal fishes had intermediate values.
3. Interspecific variation in lipid content was the primary factor influencing energy density of forage fishes, with variation in water content also contributing.
4. Lipid content (% dry mass) was negatively correlated with water content (% wet mass) and positively correlated with protein content (% lean dry mass). Thus, high-lipid fish had higher nutritional value than low-lipid fish, because of lower water content (% wet mass), higher protein content, and lower ash content (% lean dry mass).
5. Intraspecific differences in lipid content and energy density of forage fishes were related to size, sex, month, reproductive status, location, and year. Size and month were the factors with the most influence, with contributions from sex, reproductive status, and location. Pelagic species maturing at a smaller size had higher and more variable energy densities than did pelagic or nearshore species maturing at a larger size.
Acknowledgements
We are grateful to Stan Gregory, Bill Pearcy, Jerry Wolff, David Stephenson, A.J. Paul, and Tom Van Pelt for helpful comments on earlier drafts; John Ryder, Matt Yurdana, Heather Zollinger, Isaac Sanders, and Lorne Fitts for laboratory and data entry assistance; Gail Blundell, Bryan Duggan, Jared Gerstein, D. Lindsay Hayes, Max Kaufman, Arthur Kettle, Chris Kuntsch, Kirk Lenington, Dom Malenfant, Kyle Payton, Cynthia Restrepo, Martin Robards, Mark Russell, John Ryder, Terry Sauer, Pam Seiser, Ted Spencer, Rob Suryan, Dave Tessler, Sean Wolfe, and Darcie Ziel for field assistance; Alan Springer for assistance with fish identifications; Melani Bonnichsen, Debbie Nigro, Joy Huber, Ellen Holsberry, Mel Hughes, Lori Hurt, Ted Inman, Jean James, LaVon Mauer, Jan Mosley, Norma Mosso, Annette Nelson, Kathy Pearse, Bert Pratte, James Reynolds, Judy Romans, Genelle Tilton, Kent Wohl for logistical support; Evelyn Brown, David Duffy, Kathy Frost, Lew Haldorson, David Irons, John Piatt, David Roseneau, and Bruce Wright for help in procuring samples; and David Duffy, Leslie Holland-Bartels, A.J. Paul, and Bruce Wright for overall project assistance. Financial support for this research was provided by the National Oceanographic and Atmospheric Administration (BAA-95118) as part of the Exxon Valdez Oil Spill Trustee Council Restoration Program. This research was part of the larger Alaska Predator Ecosystem Experiment (APEX) research program. To all these individuals and many more, we express our sincere appreciation. [SS]
Appendix A. Size of forage fish samples for proximate analysis. Ranges are presented in parentheses with means.
Species n Sex Size Size– Standard Wet mass
class Age length (g)
class (mm)
Armor-head sculpin Gymnocanthus galeatus 1 – $80 Large 109 20.9
Arctic shanny Stichaeus punctatus 11 – $80 Large 95 (76–112) 9.04 (6.38–12.7) Black prickleback Xiphisteratro purpureus 3 – $80 Large 174 (124–215) 17.8 (4.59–24.8)
1
Capelin Mallotus villosus 32 F $80 .1 103 (83–121) 8.15 (3.68–13.1) 1
Crescent gunnel Pholis laeta 42 – $100 Large 140 (103–186) 10.4 (3.44–28.1)
Crested sculpin Blepsias bilobus 2 – $80 Large 87 (84–90) 20.2
Daubed shanny Lumpenus maculatus 2 – $80 Large 127 (120–134) 7.21 (6.43–7.98)
Dover sole Microstomus pacificus 1 – $80 Large 105 10.8
1
Eulachon (Hooligan) Thaleichthys pacificus 10 F $100 .0 155 (141–173) 28.4 (20.5–35.5)
1
Eulachon 14 M $100 .0 162 (151–174) 31.0 (24.5–39.1)
1
Eulachon 10 – $100 .0 178 (138–202) 44.0 (19.0–84.2)
Flatfish unknown species 2 – ,80 Small 69 (68–70) 5.49 (5.06–5.92)
Flatfish 2 – $80 Large 87 (83–91) 11.9 (8.48–15.4)
Great sculpin Myoxocephalus 1 – $80 Large 105 17.8
polyacanthocephalus
High cockscomb Anoplarchus purpurescens 1 – $80 Large 120 10.5
Horned sculpin Myoxocephalus quadricornis 2 – ,80 Small 60 (40–79) 9.16 (9.16–9.16)
1
Appendix A. Continued
Species n Sex Size Size– Standard Wet mass
class Age length (g)
class (mm)
Lingcod Ophiodon elongatus 12 $100 Large 77 (69–89) 2.87 (1.72–4.27) Northern ronquil Ronquilus jordani 8 – $80 Large 114 (85–160) 13.5 (4.16–37.4)
1
Pacific cod Gadus macrocephalus 15 – ,100 0 73 (58–86) 3.88 (3.28–4.46) 1
Pacific cod 5 – $100 .0 121 (111–136) 15.4 (11.9–23.1)
1
Pacific herring Clupea harengus pallasi 15 F $100 .0 170 (155–194) 66.0 (48.2–102) 1
Pacific herring 11 M $100 .0 151 (111–173) 46.7 (9.70–76.1)
1
Pacific herring 203 – $100 .0 118 (100–160) 19.1 (6.93–49.1)
1
Pacific sand lance Ammodytes hexapterus 98 F $100 .0 134 (111–188) 10.7 (6.00–26.5)
1
Pacific sand lance 2 M ,100 0 95 (93–96) 2.77 (2.73–2.81)
1
Pacific sand lance 75 M $100 .0 131 (114–158) 10.1 (5.26–19.5)
1
Pacific sand lance 37 – ,100 0 86 (70–99) 2.56 (1.21–3.71)
1
Pacific sand lance 70 – $100 .0 122 (103–174) 7.84 (3.70–25.1)
Pacific sandfish Trichodon trichodon 30 – ,100 Small 68 (57–97) 4.74 (2.35–14.8)
Pacific sandfish 8 – $100 Large 106 (100–112) 20.3 (17.5–22.3)
1
Pacific tomcod Microgadus proximus 20 – ,100 0 69 (54–95) 2.90 (1.21–6.79) 1
Pacific tomcod 3 – $100 .0 123 (103–160) 14.4 (7.80–25.0)
Padded sculpin Artedius fenestralis 10 – ,80 Small 70 (57–79) 8.69 (7.77–9.80)
Padded sculpin 4 – $80 Large 86 (80–94) 13.4 (8.36–18.5)
1
Pink salmon Oncorhynchus gorbuscha 37 – ,100 0 85 (57–98) 7.49 (3.40–11.6) 1
Pink salmon 9 – $100 .0 112 (102–135) 14.5 (10.6–19.5)
Plain sculpin Myoxocephalus jaok 1 – ,80 Small 75 5.69
Prowfish Zaprora silenus 15 – ,100 Small 70 (53–87) 7.88 (2.75–17.6)
Prowfish 8 – $100 Large 107 (100–118) 20.6 (11.6–33.0)
Red irish lord Hemilepidotus hemilepidotus 1 – $80 Large 97 21.9
1
Red salmon Oncorhynchus nerka 5 – ,100 0 72 (65–77) 3.72 (2.93–4.58) Rex sole Glyptocephalus zachirus 3 – $80 Large 138 (129–150) 17.9 (15.5–22.0)
Ribbed sculpin Triglops pingeli 1 – ,80 Small 71 5.28
Ribbed sculpin 5 – $80 Large 120 (107–160) 9.53 (7.16–12.8)
Rough spine sculpin Triglops macellus 2 – $80 Large 112 (107–116) 9.57 (5.96–13.2)
Searcher Bathymaster signatus 1 – $80 Large 139 25.9
Silverspotted sculpin Blepsias cirrhosus 1 – $80 Large 83 8.64 Slender eelblenny Lumpenus fabricii 22 – $100 Large 156 (113–295) 15.4 (6.70–43.0)
Slender sculpin Cottus tenuis 1 – $80 Large 80 2.7
Snake prickleback Lumpenus sagitta 7 – $80 Large 208 (142–272) 22.5 (6.99–47.6)
Spotted snailfish Liparis callyodon 1 – ,100 Small 94 15.8
Surf smelt Hypomesus pretiosus 5 M ,100 Small 118 (106–131) 17.2 (10.4–23.7)
Surf smelt 2 – $100 Large 105 (101–108) 10.1 (9.64–10.6)
Tidepool sculpin Oligocottus maculosus 1 – ,80 Small 44 1.06
Tidepool sculpin 6 – $80 Large 120 (110–130) 28.3 (18.0–38.0)
1
Walleye pollock Theragra chalcogramma 17 – ,100 0 57 (47–64)
1
Appendix B. Proximate composition of forage fishes from the northern Gulf of Alaska, collected from May through August 1995–1996. Energy content
21 21
(kJ fish ) is the product of wet mass (g) and energy density (kJ g wet mass). Standard error is presented with means.
Species Size n Wet Water % Water % Lipid % AFLDM % Energy density class mass (g) wet mass lean mass dry mass lean dry
21 21
(mm) mass (kJ g dry (kJ g wet
mass) mass)
Armor-head sculpin $80 1 20.9 73.9 77.1 16.1 82.1 18.6 4.77 Arctic shanny $80 11 9.0460.76 73.761.30 76.460.20 15.160.60 85.460.40 18.760.16 4.7960.08 Great sculpin $80 1 17.8 76.9 77.6 3.80 77.0 14.3 3.22 High cockscomb $80 1 10.5 75.0 76.7 9.40 84.0 17.2 4.28 Horned sculpin ,80 2 9.16 78.461.50 81.3 8.5060.10 80.261.60 16.460.29 3.4860.30 Silverspotted sculpin $80 1 8.64 79.9 81 6.60 78.1 15.5 3.05 Slender eelblenny $80 22 15.462.07 74.060.30 77.260.20 16.360.60 86.660.20 19.260.14 4.9060.08 Slender sculpin $80 1 2.70 72.5 74.7 11.2 77.6 16.2 4.29 Snake prickleback $80 7 22.565.37 74.060.70 76.360.70 11.661.40 84.960.60 18.060.44 4.5560.18 Spotted snailfish ,100 1 15.8 78.7 79.5 4.50 83.9 15.7 3.28 Surf smelt $100 7 15.262.29 73.262.00 78.360.40 16.562.90 88.660.30 18.860.69 4.3960.35 Tidepool sculpin ,80 1 1.06 67.3 0 11.6 79.7 15.5 4.75 Tidepool sculpin $80 6 28.362.63 75.060.10 76.560.30 7.7661.30 78.561.00 15.860.51 3.8460.12 Walleye pollock ,100 17 7.9361.98 79.160.30 80.360.30 7.1060.30 85.960.50 17.060.14 3.4760.06 Walleye pollock $100 27 29.061.68 79.260.30 80.260.20 6.7060.40 85.260.30 16.560.13 3.2460.06
a
Juvenile capelin were ,90 mm standard length for males and ,80 mm for unknown sex and females. b
References
Anderson, P.J., Payne, S.A., Johnson, B.A. (Eds.), 1994. Multi-species dynamics and changes in community structure in Pavlof Bay, Alaska 1972–1992, National Marine Fisheries Service, Kodiak, AK, p. 26, Unpublished MS.
Ashmole, N.P., 1971. Seabird ecology and the marine environment. In: Farner, D.S., King, J.R. (Eds.), Avian Biology, Vol. 1, Academic Press, New York, pp. 223–286.
Barraclough, W.E., 1964. Contribution to the marine life history of the eulachon Thaleichthys pacificus. J. Fish. Res. Board Can. 21, 1333–1337.
Beamish, R.J., Bouillon, D.R., 1995. Marine fish production trends off the Pacific coast of Canada and the United States. In: Beamish, R.J. (Ed.), Climate Change and Northern Fish Populations, pp. 585–591, Can. Spec. Publ. Fish. Aquat. Sci. No. 121.
Blem, C.R., 1990. Avian energy storage. In: Power, D.M. (Ed.), Current Ornithology, Vol. 7, Plenum Press, New York, pp. 59–114.
Braun, B.M., Hunt, G.L., 1983. Brood reduction in black-legged kittiwakes. Auk 100, 469–476.
Brown, R.G.B., Nettleship, D.N., 1983. Capelin and seabirds in the Northwest Atlantic. In: Nettleship, D.N., Sanger, G.A., Springer, P.F. (Eds.), Proc. Spec. Symp. 8th Annual Meeting of the Pacific Seabird Group, Marine Birds: Feeding Ecology and Commercial Fisheries, Can. Wildl. Serv. Spec. Publ, Ottawa. Calow, P., Townsend, C.R., 1981. Resource utilization in growth. In: Townsend, C.R., Calow, P. (Eds.),
Physiological Ecology: an Evolutionary Approach To Resource Use, Sinauer Associates, Sunderland, MA, pp. 220–244.
Clarke, A., Prince, P.A., 1980. Chemical composition and calorific value of food fed to mollymauk chicks Diomedea melanophris and D. chrysostoma at Bird Island, South Georgia. Ibis 122, 488–494.
Cooney, R.T., Coyle, K.O., 1988. Water column production. In: Shaw, D.G., Hameedi, M.J. (Eds.), Environmental Studies in Port Valdez, Alaska. A Basis For Management. Lecture Notes On Coastal and Estuarine Studies, Vol. 24, Springer, New York, pp. 93–115.
Craig, J.F., Kenley, M.J., Talling, J.F., 1978. Comparative estimations of the energy content of fish tissue from bomb calorimetry, wet oxidation, and proximate analysis. Freshwater Biol. 8, 585–590.
Dick, M.H., Warner, I.M., 1982. Pacific sand lance, Ammodytes hexapterus Pallas, in the Kodiak Island group, Alaska. Syesis 15, 43–50.
Drent, R.H., Daan, S., 1980. The prudent parent: Energetic adjustments in avian breeding. Ardea 68, 225–252. Fast, T.N., 1960. Some aspects of the natural history of Stenobrachius leucopsarus Eigenmann and
Eigenmann. PhD dissertation, Stanford University, Stanford, CA, 107 pp.
Fritz, L.W., Wespestad, V.G., Collie, J.S., 1993. Distribution and abundance trends of forage fishes in the Bering Sea and Gulf of Alaska. In: Is It Food?: Addressing Marine Mammal and Seabird Declines, Alaska Sea Grant College Program, University of Alaska, Fairbanks, pp. 30–44.
Furness, R.W., Barrett, R.T., 1985. The food requirements and ecological relationships of a seabird community in North Norway. Ornis Scand. 16, 305–313.
Harris, R.K., Nishiyama, T., Paul, A.J., 1986. Carbon, nitrogen and caloric content of eggs, larvae, and juveniles of the walleye pollock, Theragra chalcogramma. J. Fish. Biol. 29, 87–98.
Hatch, S.A., Sanger, G.A., 1992. Puffins as samplers of juvenile pollock and other forage fish in the Gulf of Alaska. Mar. Ecol. Progr. Ser. 80, 1–14.
Hatch, S.A., Byrd, G.V., Irons, D.B., Hunt, G.L., 1993. Status and ecology of kittiwakes (Rissa tridactyla and R. brevirostris) in the North Pacific. In: Vermeer, K., Briggs, K.T., Morgan, K.H., Siegel-Causey, D. (Eds.), The Status, Ecology, and Conservation of Marine Birds in the North Pacific, Can. Wildl. Serv. Publ, Ottawa, pp. 140–153.
Hislop, J.R.G., Harris, M.P., Smith, J.G.M., 1991. Variation in the calorific value and total energy content of the lesser sandeel (Ammodytes marinus) and other fish preyed on by seabirds. J. Zool. Lond. 224, 501–517. Holdway, D.A., Beamish, F.W.H., 1984. Specific growth rate and proximate body composition of Atlantic cod
(Gadus morhua L.). J. Exp. Mar. Biol. Ecol. 81, 147–170.
Jangaard, P.M., 1974. The capelin (Mallotus villosus): Biology, distribution, exploitation, utilization, and composition. Bull. Fish. Res. Board Can. 186, 1–70.
Krzynowek, J., Murphy, J., 1987. Proximate composition, energy, fatty acid, sodium, and cholesterol content of finfish, shellfish, and their products. NOAA Tech. Rep. NMFS 55, 48.
Lance, B.K., Roby, D.D., 1998. Diet and postnatal growth of red-legged and black-legged kittiwakes: An interspecies comparison. Colonial Waterbirds 21, 375–387.
Lance, B.K., Roby, D.D., 2000. Diet and postnatal growth of red-legged and black-legged kittiwakes: An interspecies cross-fostering experiment. Auk 117, 00–00.
Laugksch, R.C., Duffy, D.C., 1986. Food transit in cape gannets and jackass penguins. Condor 88, 119–120. Lockyer, C., 1987. Evaluation of the role of fat reserves in relation to the ecology of North Atlantic fin and sei whales. In: Huntley, A.C., Costa, D.P., Worthy, G.A.J., Castellini, M.A. (Eds.), Approaches To Marine Mammal Energetics, Society For Marine Mammalogy Special Publication No. 1, Allen Press, Lawrence, KS, pp. 183–203.
Love, M.R. (Ed.), 1970. The Chemical Biology of Fishes, Academic Press, New York, p. 547.
Massias, A., Becker, P.H., 1990. Nutritive value of food and growth in common tern Sterna hirundo chicks. Ornis Scand. 21, 187–194.
Montevecchi, W.A., Piatt, J., 1984. Composition and energy contents of mature inshore spawning capelin (Mallotus villosus): Implications for seabird predators. Comp. Biochem. Physiol. 78A, 15–20.
Montevecchi, W.A., Ricklefs, R.E., Kirkham, I.R., Gabaldon, D., 1984. Growth energetics of nestling gannets (Sula bassanus). Auk 101, 334–341.
Murphy, M.E., 1994. Dietary complementation by wild birds: Considerations for field studies. J. Avian Biol. 25, 27–38.
Nevenzel, J.C., Rodegker, W., Robinson, J.S., Kayama, M., 1969. The lipids of some lantern fishes (Family Myctophidae). Comp. Biochem. Physiol. 31, 25–36.
Oakley, K.L., Kuletz, K.J., 1996. Population, reproduction, and foraging of pigeon guillemots at Naked Island, Alaska, before and after the Exxon Valdez oil spill. In: Rice, S.D., Spies, R.B., Wolfe, D.A., Wright, B.A. (Eds.), Proc. Exxon Valdez Oil Spill Symposium, American Fisheries Society Symposium No. 18, American Fisheries Society, Bethesda, MD.
Obst, B.S., 1986. The energetics of Wilson’s storm petrel (Oceanites oceanicus) breeding at Palmer Station, Antarctica. PhD dissertation, University of California, Los Angeles.
Orians, G.H., Pearson, N.E., 1979. On the theory of central place foraging. In: Horn, D.J., Mitchell, R.D., Stairs, G.R. (Eds.), Analysis of Ecological Systems, Ohio State University Press, Columbus, pp. 155–177. Pahlke, K.A., 1985. Life history and distribution of capelin, Mallotus villosus, in Alaskan waters. MSc thesis,
University of Alaska, Juneau.
Parks, N.B., Zenger, H. (Eds.), 1979. Trawl survey of demersal fish and shellfish resources in Prince William Sound, Alaska, NOAA, NMFS, Seattle, WA, NWAFC Progress Report 79-2.
Paul, A.J., Paul, J.M., Brown, E.D., 1996. Ovarian energy content of Pacific herring from Prince William Sound, Alaska. Alaskan Fish. Res. Bull. 3, 102–111.
Payne, P.M., Nicholas, J.R., O’Brien, L., Powers, K.D., 1986. The distribution of the humpback whale, Megaptera novaeangliae, on Georges Bank and in the Gulf of Maine in relation to densities of the sand eel Ammodytes americanus. Fish. Bull. US 81, 271–277.
Payne, S.A., Johnson, B.A., Otto, R.S., 1999. Proximate composition of some north-eastern Pacific forage fish species. Fish. Oceanogr. 8, 159–177.
Perrins, C.M., 1970. The timing of birds’ breeding season. Ibis 112, 242–255.
Perrins, C.M., Harris, M.P., Britton, C.K., 1973. Survival in manx shearwaters Puffinus puffinus. Ibis 115, 535–548.
Piatt, J.F., Anderson, P., 1996. Response of common murres to the Exxon Valdez oil spill and long-term changes in the Gulf of Alaska marine ecosystem. In: Rice, S.D., Spies, R.B., Wolfe, D.A., Wright, B.A. (Eds.), Proc. Exxon Valdez Oil Spill Symposium, American Fisheries Society Symposium No. 18, American Fisheries Society, Bethesda, MD.
Radin, N.S., 1981. Extraction of tissue lipids with a solvent of low toxicity. Methods Enzymol. 72, 5–7. Ricklefs, R.E., 1979. Adaptation, constraint, and compromise in avian postnatal development. Biol. Rev. 54,
269–290.
Ricklefs, R.E., 1984. Meal size and feeding rates of Christmas shearwaters and Phoenix petrels on Christmas Island, Central Pacific Ocean. Ornis Scand. 15, 16–22.
Ricklefs, R.E., Day, C.H., Huntington, C.E., Williams, J.B., 1985. Variability in feeding rate and meal size of Leach’s storm-petrel at Kent Island, New Brunswick. J. Anim. Ecol. 54, 883–898.
Roby, D.D., 1991. Diet and postnatal energetics in two convergent taxa of plankton-feeding seabirds. Auk 108, 131–146.
Royer, T.C., Hansen, D.V., Pashinsk, D.J., 1979. Coastal flow in the northern Gulf of Alaska as observed by dynamic topography and satellite-tracked drogue drift buoys. J. Phys. Oceanogr. 9, 785–801.
Schmidt-Nielsen, K. (Ed.), 1997. Animal Physiology: Adaptation and Environment, 5th Edition, Cambridge University Press, New York, p. 607.
Sidwell, V.D., Foncannon, P.R., Moore, N.S., Bonnet, J.C., 1974. Composition of the edible portion of raw (fresh or frozen) crustaceans, finfish, and mollusks. I. Protein, fat, moisture, ash, carbohydrate, energy value, and cholesterol. Mar. Fish. Rev. 36, 21–35.
Smoker, W., Pearcy, W.G., 1970. Growth and reproduction of the lanternfish Stenobrachus leucopsarus. J. Fish. Res. Board Can. 27, 1265–1275.
Springer, A.M., 1991. Seabird relationships to food webs and the environment: Examples from the North Pacific. Can. Wildl. Serv. Occas. Paper 68, 39–48.
Springer, A.M., 1992. A review: Walleye pollock in the North Pacific — how much difference do they really make? Fish. Oceanogr. 1, 80–96.
Springer, A.M., Roseneau, D.G., Lloyd, D.S., McRoy, C.P., Murphy, E.C., 1986. Seabird responses to fluctuating prey availability in the eastern Bering Sea. Mar. Ecol. Prog. Ser. 32, 1–12.
Stansby, M.E., 1976. Chemical characteristics of fish caught in the northeast Pacific Ocean. Mar. Fish. Rev. 38, 1–11.
Stephens, D.W., Krebs, J.R., 1986. Foraging Theory, Princeton University Press, Princeton, NJ.
Van Pelt, T.I., Piatt, J.F., Lance, B.K., Roby, D.D., 1997. Proximate composition and energy density of some North Pacific forage fishes. Comp. Biochem. Physiol. 118A, 1393–1398.
Walsberg, G.E., 1983. Avian ecological energetics. In: Farner, D.S., King, J.R., Parkes, K.C. (Eds.), Avian Biology, Vol. 7, Academic Press, New York, pp. 161–220.
Ware, D.M., 1985. Life history characteristics, reproductive value, and resilience of Pacific herring (Clupea harengus and pallasi ). Can. J. Fish. Aquat. Sci. 42 (Suppl. 1), 127–137.