www.elsevier.comrlocateratmos
Retrieval of cloud optical and microphysical
properties from multispectral radiances
Lothar Schuller
¨
), Wolfgang Armbruster, Jurgen Fischer
¨
Institut f ur Weltraumwissenschaften, Freie Uni¨ Õersitat, Fabeckstraße 69, D-14195 Berlin, Germany¨
Received 23 November 1998; accepted 1 March 2000
Abstract
Ž .
This paper describes measurements made with a high spectral resolution radiometer OVID during the EUCREX mission 206, for the retrieval of optical and microphysical cloud properties. The retrieval algorithm is based on the calculation of the radiative transfer through a cloudy atmosphere with a numerical model based on the Matrix Operator method. The simulation of the spectral radiances at the flight level in 942 spectral channels fits precisely the actual spectra measured with OVID, with a good description of the absorption and scattering features. A number of 1486 simulations, based on a plane parallel model of clouds with various combinations of cloud optical thickness and droplet effective radius, form the lookup table of reflectance values that are used to retrieve these parameters from the measured spectra. The OVID measurements performed along five legs flown by the DLR-F20 aircraft during the EUCREX mission 206 have been processed. The retrieved values of optical thickness and effective radius are compared in the EUCREX summary paper to estimates derived from in situ measurements and values retrieved from airborne lidar and radiometric measurements as well as from satellite radiometric measure-ments.q2000 Elsevier Science B.V. All rights reserved.
Keywords: Cloud radiative properties; Remote sensing retrieval techniques
1. Introduction
During the EUCREX experiment, remote sensing measurements have been performed with POLDER multidirectional radiometers onboard the DLR-F20 and the ARAT
Ž .
aircraft, with the lidar LEANDRE onboard the ARAT Pelon et al., 2000 and with the
)Corresponding author. Tel.:q49-30-838-2375.
Ž .
E-mail address: [email protected] L. Schuller .¨
0169-8095r00r$ - see front matterq2000 Elsevier Science B.V. All rights reserved. Ž .
OVID multiwavelength radiometer onboard the DLR-F20. The experiment was dedi-Ž
cated to the study of the indirect effect of aerosols on climate see the introductory paper .
of this series by Brenguier and Fouquart, 2000 . The objectives of the remote sensing measurements are twofold. They are used to validate the parameterisation schemes of
Ž .
optical cloud properties that are needed in general circulation models GCM . They are also useful for the validation of various systems installed in satellite for the climatologi-cal survey of cloud radiative properties. This paper describes the OVID radiometer, the calibration procedure, and the techniques employed for the retrieval of cloud optical thickness and droplet effective radius from the OVID measurements. These two parameters have been calculated along the five legs of the DLR-F20 for further comparison with the values derived from in situ measurements and values retrieved from
Ž
the POLDER, LEANDRE, and AVHRR remote sensing measurements Pawlowska et .
al., 2000b .
2. The optical visible and near infrared detector
2.1. Description of the instrument
Ž .
The optical VIS and NIR Detector OVID Schuller et al., 1997 is a high-resolution
¨
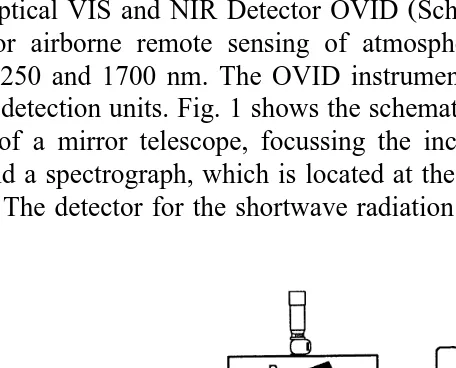
sensor for airborne remote sensing of atmospheric properties in the spectral range between 250 and 1700 nm. The OVID instrument consists of two separate, but nearly identical detection units. Fig. 1 shows the schematics of a single detection unit. The unit consists of a mirror telescope, focussing the incoming radiation to a bundle of fibre cables and a spectrograph, which is located at the front of the thermoelectrically cooled
Ž . Ž
detector. The detector for the shortwave radiation VIS contains a CCD array 1024=
.
256 pixels , which enables measurements in 1024 wavelength channels and the integra-tion of up to 256 pixelsrchannel. This allows for a wide range of detectable intensities using constant sample time intervals. The spectral range of the instrument can be adapted to the experimental goals and can be changed by the use of different gratings in the spectrograph. With a grating of 300 linesrmm and a block filter to avoid second-order effects, the range extends from 600 to 1000 nm, and the spectral resolution is 1.7 nm. The minimum exposure time is 5 ms and the minimum sample time is 40 ms. The near
Ž .
infrared NIR InGaAs detector consists of a diode panel with 256 pixels. The spectral range of the NIR system extends from 1000 to 1650 nm with a spectral resolution of 6 nm. Typical exposure time ranges from 0.3 to 3 s. Each detector is operated by a
Ž .
separate controller and a separate microcomputer PC . The spatial resolution is deter-mined by the exposure times, aircraft velocity and by the aperture of the telescopes, which is a function of the focal length and of the fibre diameter. The technical specifications of OVID are summarized in Table 1.
2.2. Calibration procedure
A data processing scheme for OVID measurements has been developed that com-prises spectral and radiometric calibration as well as an error analysis. The OVID
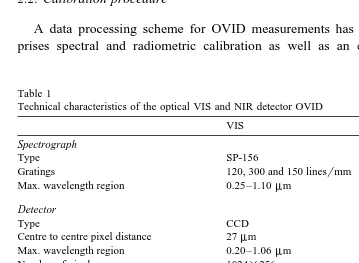
Table 1
Technical characteristics of the optical VIS and NIR detector OVID
VIS NIR
Spectrograph
Type SP-156 CP-140
Gratings 120, 300 and 150 linesrmm 20 linesrmm
Max. wavelength region 0.25–1.10mm 1.0–1.7mm
Detector
Type CCD InGaAs diode panel
Centre to centre pixel distance 27mm 50mm
Max. wavelength region 0.20–1.06mm 0.80–1.75mm
Number of pixels 1024=256 256
Ž .
Spectral resolution 1.7 nm with 300 linesrmm 6.0 nm
Approximate exposure time 10 ms 200–1000 ms
Sample frequency 23 Hz 1–5 Hz
Controller
14-bit ArD converter 14-bit ArD converter binning and grouping
Telescope
Mirror diameter 8 cm 8 cm
Focal length 31 cm 16 cm
Diameter of fibre cable entrance 1.45 mm 0.95 mm
Spatial resolution
Perpendicular to flight direction 42.8 m 54.3 m
Ž . Ž .
instrument requires special calibration procedures before and after each flight, to account for variations in the remote sensing system characteristics.
2.2.1. Spectral calibration
An ideal spectral calibration would be a complete knowledge of the sensor response, in each channel, to monochromatic radiance as a function of wavelength. In practice,
Ž .
this response function R l cannot be measured directly because no continuously monochromatic reference light source is available over the whole spectral range of the instrument. The spectral response of each channel is specified by two parameters: its central wavelength lc and its bandwidth Dl.
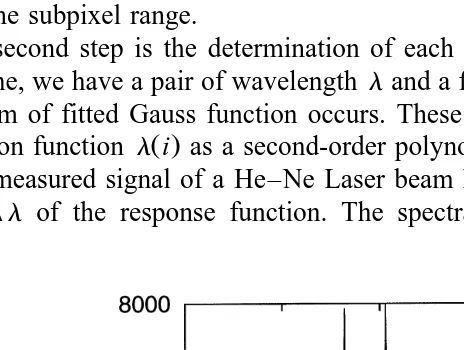
The central wavelength lc of an OVID channel is obtained by using the signal of an Ž .
argon discharge lamp Fig. 2 . The spectral width of a single argon emission line is much smaller than the nominal bandwidth of an OVID channel. The observed broaden-ing is then only due to the instrumental characteristics such as the defects on gratbroaden-ing and mirrors of the spectrograph, transfer inefficiency during the CCD readout or different pixel sensitivities.
The wavelengths of the argon lines are known and the first step is to locate their positions on the detector. This is done by fitting the discrete signal pattern to a Gaussian function. Since the peaks of the emission lines are located somewhere between the channel centres, the Gauss fitting techniques allow for the definition of the line position within the subpixel range.
The second step is the determination of each channel central wavelength. For each argon line, we have a pair of wavelength land a fractional channel number i, where the maximum of fitted Gauss function occurs. These values are now used to fit a spectral
Ž .
calibration function l i as a second-order polynomial.
The measured signal of a He–Ne Laser beam has been used to estimate the spectral width Dl of the response function. The spectral shape of the response function is
assumed to be of Gaussian form. The distribution of the signal to adjacent pixels has thus been fitted to a Gauss function whose width has been used as an estimate of the bandwidth Dl for all channels. During the EUCREX campaign, we obtained a spectral resolution of 1.64 nm for the VIS system and 5.83 nm for the NIR system.
A spectral calibration is valid as long as the orientation of the optical system spectrometerrdetector remains unchanged. During some flights, we observed significant wavelength shifts in the VIS system due to vibrations of the aircraft and material conditions. This problem occurs within the VIS system only, because the relative position of the grating can be tuned with a 1-mm knob from the outside, whereas the NIR grating is firmly fixed.
The high spectral resolution offers a solution to the problem: The Fraunhofer absorption lines of the sun photosphere can be resolved and every single spectrum can
Ž .
be corrected for the spectral shift Kollewe, 1993 . The positions of the Fraunhofer lines are calculated similarly as for the argon lines using a Gauss fitting technique. During EUCREX, a deviation of up to 0.15 nm from the pre-flight argon calibration has been observed.
2.2.2. Radiometric calibration
The principle of the intensity calibration is the comparison of the measured signals
Ž .
with the signal of a uniform integration sphere source calibration lamp with known emission characteristics. The ground calibration measurements comprise the OVID response to the calibration lamp as well as dark signals for a set of reasonable exposure times and binning parameters. At least 10 spectra are recorded under the same conditions. The standard deviation is used for the error analysis.
Ž .
The calibration factor k or radiance conversion factor is derived from the radiance of the calibration lamp LCL, the measured OVID signal for the calibration lamp CCL, as
Ž .
well as the background dark- signal C :D
LCL
ks .
Ž .
1CCLyCD
Ž .
Eq. 1 has to be evaluated for each channel and for each exposure time and binning parameter. The dark signal is strongly correlated to the detector temperature, which
Ž .
varies during a flight. Beside the spectral shift Section 2.2.1 , this leads to a radiometric shift. Therefore, a complete calibration procedure shall be performed before and after each flight. In addition, dark signal measurements can be performed during the flight in order to increase the accuracy of the procedure.
Ž .
Both detectors’ VIS and NIR ranges overlap in the spectral interval from 1.0 and 1.1mm. However, the calibration shows discrepancies between the two detectors in this interval. Further investigation led to the conclusion that stray light due to scattering and reflection inside the spectrometer occurs in the VIS system. The sensitivity of silicon-based VIS detector decreases rapidly towards longer wavelengths and therefore, the shortwave stray light causes significant errors after radiometric calibration due to the large radiance conversion factors for longwave channels. Looking at channels where no
Ž . Ž
signal is expected, i.e. at the beginning blocking filter and end of the detector array no .
contribution of stray light depends almost linearly upon the total intensity measured over the 1024 channels. On this basis, a stray light correction procedure has been included in the calibration algorithm, using the measured counts at the first and last four channels. After applying this correction to raw data before calibration, discrepancies between the two detectors in the overlap region disappear.
3. Description of the radiative transfer model
Ž .
The radiative transfer model MOMO Matrix Operator Model solves the radiative
Ž . Ž
transfer equation RTE for diffuse radiation using the matrix operator method Plass et .
al., 1973; Fischer and Grassl, 1984; Fell, 1997 . The atmospheric model is represented by a number of layers to approximate the actual vertical structure.
For each layer, reflection and transmission matrices as well as source functions are derived which describe how the diffuse radiation is transmitted through, reflected at or emitted from the layer. The primary model output is the azimuthally and zenithally resolved radiances at the layer boundaries. In this study, we only analyzed nadir radiances, for which the measurements were performed. The model includes all relevant physical processes necessary to simulate the light field in the atmosphere within the VIS and NIR range of the solar spectrum: Rayleigh scattering of atmospheric molecules, absorption and scattering due to atmospheric aerosols and clouds, absorption due to the
Ž
atmospheric gases using an exponential sum fitting technique Armbruster and Fischer,
. Ž .
1996 based on the HITRAN data base Rothman et al., 1992 .
To transform the equation of radiative transfer into a form suitable for the matrix operator method, assumptions are made, which cause limitations inherent to the method. Ž .i Each layer is considered horizontally and vertically homogeneous. The actual vertical structure is approximated by a stack of an appropriate number of layers with varying optical properties. Horizontal inhomogeneities and bordering effects cannot be considered.
Ž .ii It is assumed that the phase function depends only on the scattering angle and on the wavelength of the incident light. Scattering effects that are caused by a certain Ž . prevailing orientation of non-spherical scattering particles cannot be considered halos .
Ž .iii The integrals with respect to the zenith angle are evaluated by a Lobatto quadrature scheme. As a consequence, the radiances are computed at a number of discrete zenith angles. Radiance values at other angles have to be gathered by interpola-tion.
Additionally, limitations occur due to the assumption made to enhance computational efficiency: The zenith dependence of the RTE is separated from azimuth dependence by expanding the latter into a cosine series with a finite number of terms. Each term of the expanded RTE is then treated independently. In order to allow an efficient treatment of
Ž
strongly-peaked phase functions whose expansion would require a large number of .
approxima-tion technique is adequate for most problems, except for the treatment of details in the forward-scattered radiance peak.
The matrix operator method is a very efficient way to calculate the radiative transfer in both thin and dense media, since the computational cost is almost independent of the optical depth. All orders of scattering are included in the calculations and the radiances are computed for specific directions at any desired depth.
4. The European Cloud Radiation Experiment EUCREX
During EUCREX 94, OVID was mounted on board the DLR-F20. Both telescopes were fixed on a mounting platform with parallel orientation viewing through one of the
Ž .
bottom windows Schuller and Fischer, 1996 . Mission 206 on April 18, 1994 was
¨
dedicated to the investigation of a stratocumulus cloud field. Radiance spectra with full spectral resolution have been recorded during the five legs flown above the cloud layer,
Ž .
between points M and A Pawlowska et al., 2000a,b . In Table 2 the flight altitudes and averaged values of the solar zenith angles are given for each leg. The spectra derived with the two independent OVID detectors have been averaged over 2 s, i.e. a spatial resolution of the order of 230 m.
4.1. Radiances data base for the EUCREX 94 case study
Ž .
A database lookup table containing radiances in 942 spectral channels ranging from 550 to 1650 nm, simulated with different cloud optical thicknesses and effective radii, has been created using the MOMO radiative transfer code. The values of optical thickness mentioned in this study are always relative to a reference wavelength at 550 nm.
The bandwidth of the simulated channels varies from 0.5 to 20 nm. It has been selected according to the OVID characteristics and according to the existence of gaseous absorption. The atmospheric model has been divided into 22 homogeneous layers. The temperature and pressure profiles in the model are derived from a radiosounding ŽBrenguier and Fouquart, 2000. and the profiles measured in situ by the M-IV ŽPawlowska et al., 2000a ..
Table 2
Flight altitude of the DLR-F20 aircraft and solar zenith angle for the five legs flown during EUCREX mission 206
Ž . Ž .
Leg no. Flight altitude m Average solar zenith angle 8
1 3000 44
2 3000 42
3 46,000 and 6000 40.5
4 6000 39
The ocean surface is considered as an isotropic reflector since the anisotropic behaviour does not significantly influence the radiation field above a cloud layer, although it can be a source of misinterpretation especially in regions of very thin or broken cloudiness. A continental aerosol with an optical thickness of 0.3 at 550 nm is
Ž
assumed in the simulations. The single scattering parameters extinction and scattering .
coefficient, scattering phase function of liquid cloud droplets and aerosol particles have Ž
been calculated with Mie theory considering a modified gamma function Deirmandjian, .
1969 for the droplet size distribution. The cloud base altitude has been selected at 500
Ž .
m and the cloud top at 1000 m see Fig. 3 in Pawlowska et al., 2000a .
A total of 1486 cases have been simulated for values of cloud optical thicknesses between 0 and 100 and values for the effective radius between 1 and 15mm. For a direct comparison of simulated and measured spectra, the radiative transfer calculation results are adapted in terms of spectral channels, solar zenith angle and flight altitude by interpolation. The spectral channels used in the radiative transfer simulations have been modified by a convolution with a Gauss-shaped response function matching the spectral response of the detectors.
4.2. InÕersion scheme
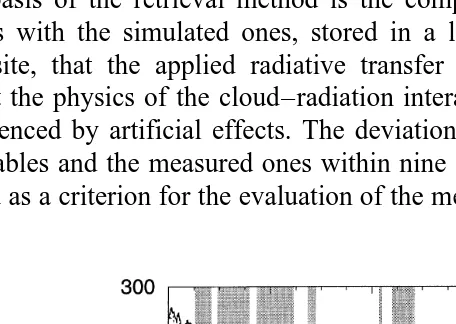
The basis of the retrieval method is the comparison of the measured multispectral radiances with the simulated ones, stored in a lookup table. Therefore, it is a major prerequisite, that the applied radiative transfer model as well as the measurements represent the physics of the cloud–radiation interaction correctly and that they are both not influenced by artificial effects. The deviation between the simulated spectra of the
Ž .
lookup tables and the measured ones within nine spectral regions grey bands in Fig. 3 was used as a criterion for the evaluation of the method. Radiance values were converted
Ž .
Fig. 3. Spectral agreement between OVID measurements solid line during the EUCREX mission 206, at
Ž .
into reflectance values before the comparison to avoid overrating of the shortwave region. A typical OVID spectrum is shown in Fig. 3 together with the best-fit simulated
Ž
spectrum from the lookup table optical thickness ts34 and effective radius res8 .
mm . The mean relative deviation is about 2% for all OVID measurements. Fig. 3 also shows that the measured spectral features and the slope of the spectrum are well reproduced by the radiative transfer simulations. For each OVID sample, the best-fit simulated spectrum and the corresponding values of optical thickness and effective radius were derived from the lookup table with this method.
Fig. 4. Cloud parameters derived from OVID measurements during the five legs. Optical thicknesst at 550
Ž . Ž .
4.3. Results
The derived parameters for the five legs flown by the DLR-F20 during mission 206 are shown in Fig. 4 as a function of the distance from point M. There is a decrease in
Ž . optical thickness as well as in droplet sizes towards the end of the leg point A . The total overcast in the southeast changes to broken clouds in the northwestern part of the leg. This tendency increases with time. Therefore, the retrieval is less reliable for the late legs, especially for the droplet effective radius. A maximum cloud optical thickness of about 40 was retrieved with OVID. The retrieved effective radius varies between 5 and 10mm. A more detailed discussion of the OVID results compared to results from other
Ž .
instruments and in situ data is given in Pawlowska et al. 2000b . In that work, it is concluded that the retrieved optical thicknesses from OVID and POLDER as well as from the AVHRR satellite sensor are in general agreement with values derived from in
Ž situ measurements of cloud microphysics. The remotely sensed effective radii OVID
.
and AVHRR show similar distributions, although both algorithms overestimate the droplet size as compared to in situ measurements of the droplet size distributions.
5. Summary and outlook
The comparison between high spectral resolution measurements with an airborne spectrometer and simulations with a radiative transfer model have shown that the model provides a reliable and relatively accurate description of the cloud–radiation interaction. On the basis of the good agreement between simulated and measured radiances, a simple lookup table inversion algorithm has been developed to derive cloud optical thickness and effective droplet radius from remote sensing measurements of cloud spectral radiances.
The high spectral resolution of 1–10 nm was found to be very useful for the definition of the algorithm, mainly due to the possibility to test various combinations of channels. An optimization in terms of efficiency and computational performance has to be done, by reducing the number of channels, resulting in smaller lookup tables. A principal component analysis of all the simulated spectra led to the conclusion, that three
Ž .
specific channels e.g., at 750, 1200, and 1550 nm could be sufficient for the retrieval of optical thickness and droplet effective radius. Once the optimal channel is definition can be determined, faster radiative transfer simulations will be possible and a larger range of variations in cloud microphysical, geometrical and optical properties will be considered.
The CLOUDYCOLUMN experiment within the frame of the second Aerosol Charac-Ž .
terisation Experiment ACE 2 in 1997 provides a good opportunity to test the procedures by comparing the results with in situ and satellite measurements.
Acknowledgements
References
Armbruster, W., Fischer, J., 1996. Improved method of exponential sum fitting of transmission to describe the absorption of atmospheric gases. Appl. Opt. 35, 1931–1941.
Brenguier, J.-L., Fouquart, Y., 2000. Introduction to the EUCREX-94 mission 206. Atmos. Res., this issue. Deirmandjian, D., 1969. Electromagnetic scattering on spherical polydispersions. Elsevier, Amsterdam. Fell, F., 1997. Validierung eines Modells zur Simulation des Strahlungstransportes in Atmosphare und Ozean,¨
Strahlung in Atmosphare und Ozean, Beitrage zur Fernerkundung 7, Institut f ur Weltraumwissenschaften,¨ ¨ ¨
Ž .
Freie Universitat, Berlin in German with English Abstr. .¨
Fischer, J., Grassl, H., 1984. Radiative transfer in an atmosphere–ocean system: an azimuthally dependent matrix-operator approach. Appl. Opt. 23, 1035–1039.
Kollewe, M., 1993. Fernerkundung von Wolken mit der Sauerstoff Absorptionsbande im nahen Infrarot.
Ž
Berichte aus dem Zentrum f ur Meeres- und Klimaforschung, Reihe A: Meteorologie 9 in German with¨
.
English Abstr. .
Pawlowska, H., Brenguier, J.L., Burnet, F., 2000. Microphysical properties of stratocumulus clouds. Atmos. Res., this issue.
Pawlowska, H., Brenguier, J.L., Fouquart, Y., Armbruster, W., Descloitres, J., Fischer, J., Flamant, C., Fouilloux, A., Gayet, J.F., Ghosh, S., Jonas, P., Parol, F., Pelon, J., Schuller, L., 2000. Microphysical and¨ radiative properties of stratocumulus clouds: The EUCREX mission 206 case study. Atmos. Res., this issue.
Pelon, J., Flamant, C., Trouillet, V., Flamant, P.H., 2000. Optical and microphysical parameters of dense stratocumulus cloud during mission 206 of EUCREX ’94 as retrieved from LEANDRE I measurements. Atmos. Res., this issue.
Plass, G.N., 1973. Matrix operator theory of radiative transfer: 1. Rayleigh scattering. Appl. Opt. 12, 314–329. Potter, J.F., 1970. The delta function approximation in radiative transfer theory. J. Atmos. Sci. 27, 511–517. Rothman, L.S., Gamache, R.R., Tipping, R.H., Rinsland, C.P., Smith, M.A.H., Benner, D.C., Devi, V.M., Flaud, J.M., Camy-Peyret, C., Perrin, A., 1992. The HITRAN molecular data base — editions of 1991 and 1992. J. Quant. Spectrosc. Radiat. Transfer 48, 469–507.
Schuller, L., 1996. Multispectral flight measurements of atmospheric water vapour bands. Adv. Space Res. 17,¨ 55–58.