Full Terms & Conditions of access and use can be found at
http://www.tandfonline.com/action/journalInformation?journalCode=cbie20
Download by: [Universitas Maritim Raja Ali Haji] Date: 17 January 2016, At: 23:28
Bulletin of Indonesian Economic Studies
ISSN: 0007-4918 (Print) 1472-7234 (Online) Journal homepage: http://www.tandfonline.com/loi/cbie20
Ownership and Energy Efficiency in Indonesian
Manufacturing
Eric D. Ramstetter & Dionisius Narjoko
To cite this article: Eric D. Ramstetter & Dionisius Narjoko (2014) Ownership and Energy Efficiency in Indonesian Manufacturing, Bulletin of Indonesian Economic Studies, 50:2, 255-276, DOI: 10.1080/00074918.2014.938407
To link to this article: http://dx.doi.org/10.1080/00074918.2014.938407
Published online: 30 Jul 2014.
Submit your article to this journal
Article views: 222
View related articles
View Crossmark data
Bulletin of Indonesian Economic Studies, Vol. 50, No. 2, 2014: 255–76
ISSN 0007-4918 print/ISSN 1472-7234 online/14/000255-22 © 2014 Indonesia Project ANU http://dx.doi.org/10.1080/00074918.2014.938407
* We are grateful to the Japan Society for the Promotion of Sciences for inancial assistance (grant 22530255 for the project Ownership and Firm- or Plant-Level Energy Eficiency in Southeast Asia) and to the International Centre for the Study of East Asian Development
and the Economic Research Institute for ASEAN and East Asia for logistic support. We
thank Kornkarun Cheewatrakoolpong, Kenichi Imai, Kozo Kiyota, Lin See Yan, Kiichiro Fukusaku, Sadayuki Takii, Siang Leng Wong, Chih-Hai Yang, and Naoyuki Yoshino for
discussing related papers on Indonesia, Malaysia, and Thailand. Two referees provided valuable comments, as did several other participants in the 9th Australasian Development Economics Workshop on 6–7 June 2013 and previous 2012 and 2013 conferences where re-lated papers were presented. Other project participants (Shahrazat Binti Haji Ahmad and Archanun Kohpaiboon) and Juthathip Jongwanich also provided important input. The au-thors are solely responsible for the content of this article.
OWNERSHIP AND ENERGY EFFICIENCY IN INDONESIAN
MANUFACTURING
Eric D. Ramstetter*
International Centre for the Study of East Asian Development; Kyushu University
Dionisius Narjoko*
Economic Research Institute for ASEAN and East Asia
Using 1996 and 2006 census data on medium-large plants in Indonesian manufac-turing, we examine whether foreign multinational enterprises (MNEs) and
state-owned enterprises (SOEs) used purchased energy more eficiently than local, pri
-vate plants, inding that the correlation between plant ownership and total energy
intensity, gas intensity, and coal intensity was generally weak in both years. Second,
we ask whether energy eficiency in private plants was affected by the presence of
MNEs or SOEs in high-energy-consuming industries. In 1996, private energy in-tensities were often positively correlated with the presence of SOEs and majority- foreign MNEs and negatively correlated with the presence of wholly foreign or minority-foreign MNEs, but in 2006 the corresponding results differed substan-tially. This suggests that ownership-related differentials in energy intensity and intra-industry energy-intensity spillovers are not pronounced. If policymakers are
concerned with improving energy eficiency in Indonesian manufacturing, plant
ownership should not be a major consideration.
Keywords: ownership, multinational corporations, energy eficiency, manufacturing JEL classiication: F23, K32, L32, L33, L60, O53, Q40
INTRODUCTION
The consumption of purchased energy generates much of the pollution (mainly air pollution) emitted by manufacturing plants in Indonesia. Improving energy eficiency or conservation is thus an effective way of limiting pollution by
256 Eric D. Ramstetter and Dionisius Narjoko
manufacturers. In this article we use plant-level data underlying the Indonesian manufacturing censuses (Statistik Industri) of 1996 and 2006 to analyse whether plants controlled by foreign multinational enterprises (MNEs) or state-owned enterprises (SOEs) used purchased energy (deined as electricity and fuel) more eficiently than medium-large local, private plants. We then ask whether energy intensities (ratios of purchased energy to output), in local, private plants were cor-related with the shares of MNEs and SOEs in Indonesia’s high-energy-consuming industries.
A 2003 study by Eskeland and Harrison is one of the few to use microdata to investigate the consumption of purchased energy in developing economies. It inds that ‘foreign plants are signiicantly more energy eficient and use cleaner types of energy’ than their local peers in Côte d’Ivoire, Mexico, and Venezuela (Eskeland and Harrison 2003, 21). He (2006, 228) provides evidence that foreign direct investment (FDI) enterprises in China ‘produce with higher pollution [sul-fur dioxide] eficiency’, but that stronger environmental regulation has simultane-ously, though moderately, deterred FDI among Chinese provinces. Earnhart and Lizal (2006) analyse the effects of inancial performance and privatisation on the environmental performance of Czech irms, their results indicating that foreign ownership was usually an insigniicant determinant of pollution.
As detailed in the following literature review, MNEs, in particular, are also thought to be a source of positive spillovers on private irms. Theory suggests that a greater MNE presence in an industry can increase competition and labour mobility among MNEs and local, private plants, as well as strengthen linkages that foster higher productivity in local plants. Previous studies generally indi-cate positive productivity spillovers from MNEs in Indonesia. If the presence of MNEs has affected productivity in private plants, it may have also affected energy eficiency (the inverse of energy productivity). This article describes the data and patterns of energy intensities, as well as SOE and MNE presence, and analyses the statistical signiicance of MNE–private and SOE–private energy differentials and energy spillovers, after accounting for the scale, input mix, and technical charac-teristics of plants.
MULTINATIONAL AND STATE ENTERPRISES AND ENERGY EFFICIENCY
This section surveys the relevant literature, explaining why MNEs are usually expected to be more eficient than SOEs and discussing the implications of pro-ductivity spillovers for possible spillovers of energy eficiency.
Productivity Differentials and Energy Eficiency
Recent theoretical analyses have drawn attention to the role of knowledge-based, intangible assets (terminology from Markusen 1991) in MNEs. Most observers agree that MNEs tend to have relatively large amounts of technological knowl-edge and marketing expertise, strong international networks, and generally sophisticated and effective management.1 These characteristics are evidenced
by relatively high research and development (R&D) intensities (ratios to sales or
1. Caves (2007) and Dunning and Lundan (2008) provide thorough literature reviews. See
also Markusen’s (2002) study.
Ownership and Energy Eficiency in Indonesian Manufacturing 257
output), large proportions of patent applications and approvals, high advertising– sales ratios, and a high dependence on international trade.
If MNEs have relatively large knowledge-based, intangible asset stocks, they should be more eficient producers than non-MNEs in some respect. They may become more energy eficient, for example, or pollute less, as part of efforts to increase demand among consumers and minimise production costs. Moreover, because MNEs tend to be R&D- and patent-intensive, and because energy conser-vation technologies often require sophisticated technological inputs, it is logical that MNEs should be both better able to and more motivated to conserve energy than other irms.2
The theoretical rationale for expecting MNEs to be more productive than other irms is convincing. However, in Southeast Asia’s developing economies the empirical evidence on productivity differentials between foreign MNEs and local irms (most of which are not MNEs) is often ambiguous. For example, studies of manufacturing in Malaysia (Oguchi et al. 2002; Haji Ahmad 2010) and Thailand (Ramstetter 2004, 2006) suggest that productivity differentials tend to be small and often statistically insigniicant. Similar evidence for Indonesia (Takii 2004, 2006) and Vietnam (Ramstetter and Phan 2008, 2013) suggests that productiv-ity differentials between MNEs and local plants are more commonly statistically signiicant, although these differentials are often statistically insigniicant when using a translog function (allowing for lexible assumptions about scale and factor substitution) and disaggregating plants by industry (allowing for differences in production function slopes among industries, as well as the constant).
Many economists expect SOEs, in contrast with MNEs, to be less productive than private plants, largely because SOEs are thought to have fewer incentives for pursuing proits and eficiency. The empirical evidence is mixed, with several studies inding that SOEs are less productive than private irms and several ind-ing the opposite.3 In Indonesia, SOEs have played large roles in several industries,
such as basic metals (table 1), and are generally perceived to be ineficient. This is one reason for the privatisation of many SOEs during 1996–2006. Hartono, Irawan, and Achsani (2011) ind that local, private plants tend to have signiicantly higher energy intensities than SOEs in Indonesian manufacturing and that MNE–SOE differentials were not signiicant in samples of all manufacturing plants 2002–6.
Productivity Spillovers and the Potential for Energy-Eficiency Spillovers The presence of MNEs in an industry can increase the productivity of local plants by creating spillovers through at least three major channels: (a) by fostering link-ages between MNEs and local plants, (b) by stimulating labour mobility between MNEs and local plants, and (c) by creating a demonstration or competition effect. First, direct linkages are usually backward linkages created when MNEs source raw materials, parts, or services from local plants. MNEs can also create forward
2. For example, evidence from Cole, Elliott, and Shimamoto (2006) suggests that Japanese irms with FDI and international trade pollute less and manage emissions better than irms without FDI or trade.
3. See the studies of Aharoni (2000), Djankov and Murrell (2002), and Stretton and Orchard
(1994) for surveys; Jefferson and Su (2006) for Chinese evidence; and Brown, Earle, and
Telegdy (2004, 2006) for Eastern European evidence.
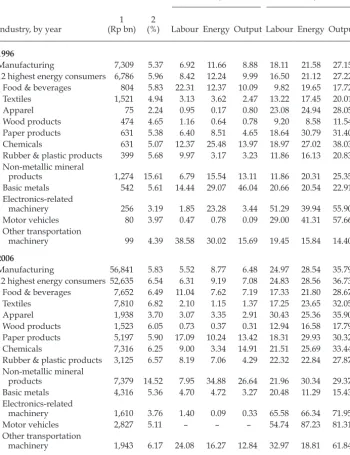
TABLE 1 Total Energy Expenditures; Private Energy Intensities; and Shares of State-Owned and Multinational Enterprises in Labour, Energy Expenditures, and Output
SOE shares (% of industry subtotals)
MNE shares (% of industry subtotals)
Industry, by year
1 (Rp bn)
2
(%) Labour Energy Output Labour Energy Output
1996
Manufacturing 7,309 5.37 6.92 11.66 8.88 18.11 21.58 27.15 12 highest energy consumers 6,786 5.96 8.42 12.24 9.99 16.50 21.12 27.22
Food & beverages 804 5.83 22.31 12.37 10.09 9.82 19.65 17.72
Textiles 1,521 4.94 3.13 3.62 2.47 13.22 17.45 20.01
Apparel 75 2.24 0.95 0.17 0.80 23.08 24.94 28.05
Wood products 474 4.65 1.16 0.64 0.78 9.20 8.58 11.54
Paper products 631 5.38 6.40 8.51 4.65 18.64 30.79 31.40
Chemicals 631 5.07 12.37 25.48 13.97 18.97 27.02 38.03 Rubber & plastic products 399 5.68 9.97 3.17 3.23 11.86 16.13 20.83 Non-metallic mineral
products 1,274 15.61 6.79 15.54 13.11 11.86 20.31 25.35 Basic metals 542 5.61 14.44 29.07 46.04 20.66 20.54 22.91 Electronics-related
machinery 256 3.19 1.85 23.28 3.44 51.29 39.94 55.90
Motor vehicles 80 3.97 0.47 0.78 0.09 29.00 41.31 57.66 Other transportation
machinery 99 4.39 38.58 30.02 15.69 19.45 15.84 14.40
2006
Manufacturing 56,841 5.83 5.52 8.77 6.48 24.97 28.54 35.79 12 highest energy consumers 52,635 6.54 6.31 9.19 7.08 24.83 28.56 36.73
Food & beverages 7,652 6.49 11.04 7.62 7.19 17.33 21.80 28.67
Textiles 7,810 6.82 2.10 1.15 1.37 17.25 23.65 32.05
Apparel 1,938 3.70 3.07 3.35 2.91 30.43 25.36 35.90
Wood products 1,523 6.05 0.73 0.37 0.31 12.94 16.58 17.79 Paper products 5,197 5.90 17.09 10.24 13.42 18.31 29.93 30.32
Chemicals 7,316 6.25 9.00 3.34 14.91 21.51 25.69 33.44 Rubber & plastic products 3,125 6.57 8.19 7.06 4.29 22.32 22.84 27.87 Non-metallic mineral
products 7,379 14.52 7.95 34.88 26.64 21.96 30.34 29.37 Basic metals 4,316 5.36 4.70 4.72 3.27 20.48 11.29 15.43 Electronics-related
machinery 1,610 3.76 1.40 0.09 0.33 65.58 66.34 71.95
Motor vehicles 2,827 5.11 – – – 54.74 87.23 81.31
Other transportation
machinery 1,943 6.17 24.08 16.27 12.84 32.97 18.81 61.84
Source: Authors’ calculations based on data from BPS.
Note: SOE = state-owned enterprise. MNE = multinational enterprise. 1 = total energy expenditures.
2 = private energy intensities. – = no plants in category. Industry deinitions differ between 1996 and 2006. See the text for detailed deinitions of industries and ownership groups.
Ownership and Energy Eficiency in Indonesian Manufacturing 259
linkages by supplying local plants with intermediate goods (materials, parts, or services) or inal goods of superior quality to those produced locally. Second, MNEs often require relatively skilled workers, such as middle-level technicians and managers, and seek to recruit them from local irms. Local plants also try to woo workers from MNEs, and some MNE workers resign after realising that they have obtained the skills to start their own irm. Third, the entry or expansion of foreign MNEs usually increases competitive pressure on local plants that produce goods or services similar to those of the MNEs. The increased competition can motivate local irms to develop or upgrade technology, cut input costs, or expand marketing efforts.
Much of the existing research on spillovers focuses on intra-industry produc-tivity spillovers, although more recent studies examine inter-industry spillovers. Several reviews emphasise that there is only mixed evidence of productivity spillovers (Görg and Strobl 2001; Fan 2002; Görg and Greenaway 2004; Lipsey and Sjöholm 2005; Pessoa 2007).4 Moreover, studies of Asian economies (reviewed
below) suggest that estimates of spillovers vary substantially depending on the economies and industry groups studied, the measure of foreign presence used (for example, whether measured as shares of employment, output, or ixed assets), and the estimation methodology. Cross-sectional methodologies tend to result in larger estimates of spillovers, but recent studies generally use ixed-effects estima-tors when panel data are available.5
Some of the earliest research on spillovers from MNEs in Asian host econo-mies examined Indonesia. Cross-sectional evidence for 1980 and 1991 from Blom-ström and Sjöholm (1999) and Sjöholm (1999a, 1999b) indicates that productivity spill overs tended to be positive and stronger in industries in which competition among local plants was relatively intense and within regions with diversiied industrial structures. Subsequent panel analysis for 1990–95 (Takii 2005, 2006) suggests that positive intra-industry spillovers were more prevalent in industries with small technical gaps and in which minority foreign MNEs had relatively large shares. Blalock and Gertler (2008) ind strong evidence of productivity gains, greater competition, and lower prices among local irms in markets that supplied foreign entrants in 1988–2006. Suyanto, Salim, and Bloch (2009) analyse spillovers in chemical and pharmaceutical plants in 1998–2000, inding positive productivity spillovers from MNEs that are larger in more competitive industries and in local plants with R&D. Results from Lipsey and Sjöholm (2004, 2006) and Sjöholm and Lipsey (2006) also suggest the existence of positive wage spillovers.
For Malaysia, Khalifah and Adam (2009) ind that productivity spillovers were positive when the presence of MNEs was measured as the share of value added or ixed assets in 2000–4, but insigniicant or negative when measured as the share of labour. Haji Ahmad (2010, chapter 6) uses the same dataset and inds that evidence of signiicant spillovers was rare and that results varied among industry groups.
4. Mebratie and Van Bergeijk’s (2013) meta-analysis argues that accounting for irm hetero -geneity in R&D and exporting changes many ambiguous results and provides relatively strong evidence of positive spillovers.
5. In general, ixed-effects panel estimates are preferable because they control for unob
-served characteristics among local plants or irms and because they are less vulnerable to
simultaneity problems that may arise if MNEs are attracted to high-productivity industries.
260 Eric D. Ramstetter and Dionisius Narjoko
For Thailand in 1996, industry-level results from Kohpaiboon (2006a, 2006b) and plant-level results from Ramstetter (2006) and Movshuk and Matusoka-Movshuk (2006) suggest positive productivity and wage spillovers from MNEs. Using a more limited sample of manufacturing irms in 2001–3, Kohpaiboon (2009) inds positive horizontal spillovers in industries in which import protection was rela-tively low.
For Vietnam, Pham’s (2008) estimates generally suggest that positive spill-overs were largest in Hanoi and Ho Chi Minh City, and from MNEs that were not wholly foreign. For 2000–5, Nguyen (2008) inds that both horizontal and vertical spillovers were generally positive, and largest in more advanced regions and in more sophisticated local irms. Nguyen et al. (2008) inds that backward, vertical spillovers were positive in manufacturing and that horizontal spillovers were positive in services. Le and Pomfret (2011) ind positive backward spillovers in manufacturing but negative and strong horizontal spillovers to private irms, domestic-oriented irms, irms without R&D, and irms in low-technology indus-tries. Ramstetter and Phan (2008) ind positive spillovers from MNEs to private irms in cross-sections, but Ramstetter and Phan (2013) ind no signiicant spill-overs in unbalanced panels for 2001–6.
DATA SOURCES, ENERGY CONSUMPTION, AND ENERGY INTENSITIES
This article uses data from industrial censuses for 1996 and 2006 because they are comprehensive and contain details on energy expenditures and labour quality that other annual surveys do not. Because a number of plants are jointly owned by two or more irms (which may be MNEs, SOEs, and/or private, joint ventures with foreign shares of 33% or more) are classiied as MNEs and non-MNE joint ventures with state shares of 33% or more are classiied as SOEs. The cut-off for deining MNEs is higher than the IMF standard (having foreign shares of 10% or more), but we know of no similar standard for deining SOEs and we need to be clear.
The irst column of table 1 shows total energy (fuel and electricity) expenditures in manufacturing and by the 12 highest-energy-consuming industries, generally deined by the two-digit level of Indonesia’s Standard Industrial Classiication (ISIC) Revision 3. The industry deinitions for 1996 are based on ISIC Revision 2 and differ from the 2006 deinitions, so caution is necessary when interpreting industry-level trends.6 The data refer to purchased energy (most of which is fuel,
and which accounts for the bulk of the energy used by most plants) and do not account for energy generated or sold.7
6. It is impossible to construct a precise correspondence between the two revisions, because
several detailed categories (that is, at the four- or ive-digit level) in one classiication are
split among detailed categories in the other. Ramstetter and Narjoko (2012, appendix table
8) give detailed deinitions.
7. Self-generated electricity is important for some plants. Purchased electricity accounted for 42% of total purchased energy in 1996 and 47% in 2006; if we assume that plant-level prices of purchased and self-generated electricity were identical, the ratios of self-generated electricity to total purchased energy were 24% in 1996 and 9% in 2006. These ratios varied only slightly among ownership groups in 1996 (23% for private plants, 25% for MNEs, and
Ownership and Energy Eficiency in Indonesian Manufacturing 261
Calculations of electricity prices (unit values) by source are also of interest, because they give hints about the quality of the data and because SOEs are said to receive cheap electricity from the state provider (Perusahaan Listrik Negara [PLN]) and because they give hints into the quality of the data. In 2006, SOEs and MNEs paid much lower electricity prices to PLN in 2006 than private plants, but in 1996 they paid slightly higher prices to PLN.8 Non-PLN electricity was a
relatively small source for all ownership groups in 1996 and for private plants and SOEs in 2006, but it composed two-ifths of the total for MNEs in 2006. Prices of non-PLN electricity, however, were several times higher for MNEs than for pri-vate plants or SOEs in 1996. Thus both ownership-related variations in electricity prices and sources of purchased electricity were much smaller in 1996 than in 2006. To some extent this is probably realistic, relecting PLN’s shrinking inlu-ence and the privatisation of SOEs. Yet the substantial price differentials in 2006 may also relect a deterioration of data quality, which is also observed in other variables such as ixed asset (capital) stocks.
Nominal energy expenditures increased greatly between 1996 and 2006, largely because of inlation (table 1).9 In this article we focus on the 12
highest-energy-consuming industries, which together accounted for 93% of total energy expenditures and caused the most energy-related pollution in Indonesian manu-facturing.10 Among these industries, textiles, chemicals, paper products, food and
beverages, and non-metallic mineral products accounted for 66% of total pur-chased energy in 1996 and 62% in 2006.
The third to eighth columns of table 1 show the shares of labour, energy, and output held by SOEs and MNEs in 1996 and in 2006 in each of these 12 industries, in these industries as a group, and in manufacturing overall. Nearly all shares were larger in the group of 12 industries than in manufacturing. On one hand, most SOE shares fell between 1996 and 2006, relecting the privatisation of several SOEs after the 1997–98 Asian inancial crisis. On the other hand, most MNE shares
27% for SOEs), but were much lower for SOEs in 2006 (2%) than for MNEs (10%) or private plants (15%). The ratios of electricity sold to total purchased energy were much smaller— under 0.5% for all ownership groups in 1996 and 2006 (authors’ calculations based on BPS data from various years).
8. In 1996, SOEs paid 6% more than private plants for PLN electricity and MNEs 4% more,
but these price differentials were –82% and –31% in 2006. For non-PLN energy, correspond -ing energy prices differentials were –8% for SOEs and 21% for MNEs in 1996, and –32% and 393% in 2006. Non-PLN shares of purchased electricity were 1% for private plants, 14% for SOEs, and 5% for MNEs in 1996, but 9%, 0.2%, and 40%, respectively, in 2006. PLN shares of purchased electricity quantities were 99% for private plants, 86% for SOEs, and 95% in MNEs in 1996, and 91%, 100%, and 60%, respectively, in 2006 (authors’ calculations based on BPS data from various years).
9. According to national accounts estimates, manufacturing GDP increased 6.7-fold in
1996–2006 if measured in current prices, but the manufacturing GDP delator increased
4.9-fold while real manufacturing GDP increased only 1.4-fold. The growth of the
manu-facturing GDP delator peaked in 1998 (60%), but this measure of manumanu-facturing inlation
was also high in 2000–2001 (20%–27%), and in 1997, 1999, and 2005–6 (13%–17%; Asian Development Bank 2004, 2011).
10. These analyses focus on industries that accounted for 3% or more of expenditures in 1996 or 2006 (or both) for each type of fuel examined (total energy, natural gas, and coal).
262 Eric D. Ramstetter and Dionisius Narjoko
increased, partially because the inancial crisis increased debts of many Indone-sian irms and led to large declines in asset prices and the rupiah. The ensuing ire sale made mergers and acquisitions, as well as new investments, relatively cheap for MNEs. In addition, Indonesian policymakers stepped up implementation of reforms mandated by FDI policy changes in the mid-1990s, reducing restrictions on foreign ownership and simplifying approval procedures for FDI. Shares of heavily foreign MNEs (foreign shares of 90% or more) in labour, output, and pur-chased energy all increased conspicuously.11
SOEs accounted for more than one-ifth of the energy expenditures in chemi-cals, basic metals, electronics-related machinery, and other transportation machin-ery in 1996, and in non-metallic mineral products in 2006 (table 1). MNE shares exceeded one-ifth of the energy expenditures in most of the highest-energy-consuming industries, including basic metals in 1996; food and beverages, tex-tiles, and rubber and plastics in 2006; and apparel, paper products, chemicals, non-metallic mineral products, electronics-related machinery, and motor vehicles in both years. SOEs and MNEs generally accounted for larger shares of energy and output than labour; that is, they tended to have higher energy–labour and output–labour ratios than private plants. Energy shares were usually smaller than output shares in MNEs, indicating that they tended to have lower energy intensi-ties than private plants, while the reverse was true for SOEs.
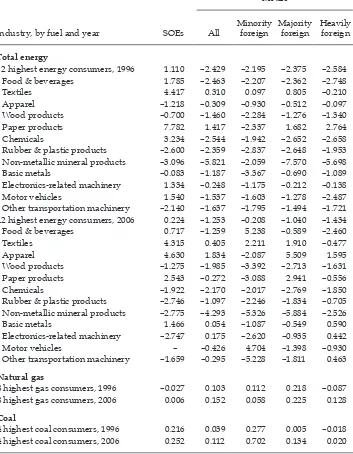
Mean energy intensities, measured as the ratio of total energy expenditures to output, were generally lower in MNEs and higher in SOEs than in private plants (table 2). If we combine plants from the 12 highest-energy-consuming industries, the mean energy intensity of private plants was 6.0% in 1996 and 6.5% in 2006 (table 1). The mean energy intensity of MNEs was 2.4 percentage points lower in 1996 and 1.3 percentage points lower in 2006, while that of SOEs was 1.1 and 0.2 percentage points higher. Heavily foreign MNEs had the lowest energy intensities among MNEs (2.6 and 1.4 percentage points lower than private plants). The dif-ferentials were smallest in absolute value for minority-foreign MNEs (33%–49% foreign shares) and of intermediate size for majority-foreign MNEs (50%–89% for-eign shares).
Energy intensities and MNE–private differentials varied greatly among indus-tries and ownership groups (tables 1 and 2). For example, both private energy intensities and negative MNE–private differentials were relatively large in non-metallic mineral products. In contrast, SOEs and minority- and majority-foreign MNEs all had higher energy intensities than private plants in textiles in both years. Most MNE–private differentials were negative in both years (10–11 indus-tries in 1996, 8–9 indusindus-tries in 2006). In other words, MNEs tended to have lower energy intensities than private plants at the industry level, but the size of differ-entials varied among industries. SOE–private differdiffer-entials were negative in six of the twelve (1996) and six of the eleven (2006) relevant, high-energy-consuming industries.12
11. Heavily foreign shares of both labour and output were only 6%–7% in 1996 (for both total manufacturing and the 12 highest-energy-consuming industries, but they more than doubled, to 15%–16% of labour and 20%–21% of output, by 2006 (Ramstetter and Narjoko 2012, table 2).
12. There were no SOEs in the 2006 sample of motor vehicle plants.
TABLE 2 Difference in Intensities of Mean Total Energy, Natural Gas, and Coal between Private Plants and State-Owned Enterprises or Multinational Enterprises
(percentage points)
MNEs
Industry, by fuel and year SOEs All
Minority foreign
Majority foreign
Heavily foreign
Total energy
12 highest energy consumers, 1996 1.110 –2.429 –2.195 –2.375 –2.584
Food & beverages 1.785 –2.463 –2.207 –2.362 –2.748
Textiles 4.417 0.310 0.097 0.805 –0.210
Apparel –1.218 –0.309 –0.930 –0.512 –0.097
Wood products –0.700 –1.460 –2.284 –1.276 –1.340
Paper products 7.782 1.417 –2.337 1.682 2.764
Chemicals 3.234 –2.544 –1.942 –2.652 –2.658
Rubber & plastic products –2.600 –2.359 –2.837 –2.648 –1.953 Non-metallic mineral products –3.096 –5.821 –2.059 –7.570 –5.698
Basic metals –0.083 –1.187 –3.367 –0.690 –1.089
Electronics-related machinery 1.334 –0.248 –1.175 –0.212 –0.138
Motor vehicles 1.540 –1.537 –1.603 –1.278 –2.487
Other transportation machinery –2.140 –1.637 –1.795 –1.494 –1.721 12 highest energy consumers, 2006 0.224 –1.253 –0.208 –1.040 –1.434
Food & beverages 0.717 –1.259 5.238 –0.589 –2.460
Textiles 4.315 0.405 2.211 1.910 –0.477
Apparel 4.630 1.834 –2.087 5.509 1.595
Wood products –1.275 –1.985 –3.392 –2.713 –1.631
Paper products 2.543 –0.272 –3.088 2.941 –0.556
Chemicals –1.922 –2.170 –2.017 –2.769 –1.850
Rubber & plastic products –2.746 –1.097 –2.246 –1.834 –0.705 Non-metallic mineral products –2.775 –4.293 –5.326 –5.884 –2.526
Basic metals 1.466 0.054 –1.087 –0.549 0.590
Electronics-related machinery –2.747 0.175 –2.620 –0.935 0.442
Motor vehicles – –0.426 4.704 –1.398 –0.930
Other transportation machinery –1.659 –0.295 –5.228 –1.811 0.463
Natural gas
8 highest gas consumers, 1996 –0.027 0.103 0.112 0.218 –0.087
8 highest gas consumers, 2006 0.006 0.152 0.058 0.225 0.128
Coal
4 highest coal consumers, 1996 0.216 0.039 0.277 0.005 –0.018 4 highest coal consumers, 2006 0.252 0.112 0.702 0.134 0.020
Source: Authors’ calculations based on data from BPS.
Note: MNE = multinational enterprise. SOE = state-owned enterprise. – = no plants in category. See
the text for detailed deinitions of ownership groups and note that industry deinitions differ between
1996 and 2006. The eight highest gas-consuming industries were food and beverages, textiles, paper products, chemicals, rubber and plastic products, non-metallic mineral products, basic metals , and fabricated metals. The four highest coal-consuming industries were textiles, paper products, chemi-cals, and non-metallic mineral products.
264 Eric D. Ramstetter and Dionisius Narjoko
The aggregate energy intensities at the top of table 2 do not relect the impor-tant possibility that MNEs and private plants may consume different energy mixes and thus have different effects on the environment even if their aggre-gate energy intensities are similar. For example, Eskeland and Harrison (2003) assume that electricity consumption is cleaner than fuel consumption and ind that MNEs tend to consume more electricity than non-MNEs. However, electricity is not unambiguously clean in Indonesia; coal (a dirty fuel) generated large and increasing shares of electricity in 2000 and 2005. In contrast, natural-gas usage is relatively clean. Purchases of both fuels were small and concentrated in only a few industries.13 Natural-gas expenditures accounted for more than 3% of purchased
fuels in only eight industries in either 1996 or 2006, and coal shares exceeded 3% of the total in only four industries.14
Mean natural-gas intensities (ratios of expenditures to output) of private plants in high-energy-consuming industries were only 0.10% in 1996 and 0.08% in 2006, while mean coal intensities were 0.04% and 0.23%, respectively (Ramstet-ter and Narjoko 2012, table 2). When all high-energy-consuming industries were combined, mean MNE–private differentials were positive for both types of fuel, except for a negative differential in gas intensities for heavily foreign MNEs in 1996 (table 2). MNEs used large amounts of both clean and dirty fuels per unit of output, on average. In SOEs, coal intensities were large in both years, while gas intensities were small in 1996 but increased to a level similar to that of private plants in 2006.
In short, the energy intensities in table 2 are consistent with Eskeland and Har-rison (2003), suggesting that MNEs purchase less total energy per unit of output than private plants. MNEs also purchase more relatively clean gas per unit of output than private plants—as well as more coal, which is a relatively dirty fuel. Such simple comparisons, however, mask plant-level differences in scale, factor usage, and technology that may affect the relation between ownership and energy intensities.
ENERGY INTENSITIES AFTER ACCOUNTING FOR SCALE AND FACTOR USAGE
We examine the relation between ownership and energy intensities after account-ing for scale and other factor usage by estimataccount-ing a factor demand model ‘based on a translog approximation to a production function’ taken from Eskeland and Harrison (2003, 16–18). The model speciies the share of the energy factor’s income (expenditure) in gross output as a function of the logs of other factor
13. According to the Asia Paciic Energy Research Centre (2009), natural gas and hydro -power together generated 36% of Indonesia’s electricity in 2000 and 23% in 2005, while
accounting for 22% and 18% of the primary energy supply, respectively. Coal generated
37% of electricity in 2000 and 41% in 2005, while its share of the primary energy supply rose from 7% to 13%, respectively. Oil generated 40% and 39% of electricity and accounted for 30% and 19% of the primary energy supply. See Ramstetter and Narjoko’s (2012) study for detailed analyses of MNE–private and SOE–private differentials in electricity intensities. 14. Natural gas accounted for 7% of total energy in 1996 and 3% in 2006; coal accounted for 5% and 6%, respectively (Ramstetter and Narjoko 2012, appendix tables 1a, 1d, 1e).
Ownership and Energy Eficiency in Indonesian Manufacturing 265
inputs (other intermediate consumption, ixed assets, and labour); the log of the quantity of the energy input; and factors related to a plant’s technological sophis-tication. Indonesian manufacturing census data include four indicators of techno-logical sophistication that may affect energy intensities: plant vintage, the ratio of R&D expenditures to gross output, shares of moderately educated workers in the workforce, and shares of highly educated workers in the workforce.15
To determine whether energy intensities in MNEs or SOEs differed signii-cantly from those in private plants, we introduce dummy variables for MNEs and SOEs. The simplest version of the model assumes that MNE–private differentials were the same for all MNE ownership groups:
EPij=a0+a1(LLij)+a2(LKij)+a3(LMij)+a4(LEij)+a5(SMij)+a6(SHij)+
a7(RDij)+a8(YRij)+a9(DSij)+a10(DFij)+UAij (1)
where the dummy DFij equals one if plant i in industry j was an MNE and zero otherwise; the dummy DSij equals one if i was an SOE and zero otherwise; EPij is the energy intensity or ratio of energy expenditures to gross output of i (%); LEij is the natural log of the quantity of energy used in i + 1 (kilowatt hours of electric-ity for total energy, kilograms for coal, cubic meters for natural gas); LLij is the natural log of the number of workers in i (number); LKij is the natural log of the ixed assets, less depreciation at year-end, of i (Rp thousand); LMij is the natural log intermediate consumption, excluding energy, of i (Rp thousand); RDij is the ratio of R&D expenditures to gross output of i (%); SMij is the percentage of work-ers with secondary education in i; SHij is the percentage of workers with tertiary education in i; YRij is the vintage, or the number of years of operation of i; and UAij is the error term.
The coeficient a10 is the percentage point differential (comparable to the
dif-ferentials in table 2) of energy intensities between MNEs and local, private plants, after accounting for scale and factor usage and the four indicators of technologi-cal sophistication. We can test if MNE–private differentials varied among MNE ownership groups by estimating the following:
EPij = b0+b1(LLij)+b2(LKij)+b3(LMij)+b4(LEij)+b5(SMij)+b6(SHij)+
b7(RDij)+b8(YRij) +b9(DSij)+b10(DFMINij)+b11(DFMAJij)+
b12(DFHVYij)+UBij (2)
where (other variables as deined above) the dummy DFMINij equals one if i was a minority-foreign MNE and zero otherwise; the dummy DFMAJij equals one if i was a majority-foreign MNE and zero otherwise; the dummy DFHVYij equals one if i was a heavily foreign MNE and zero otherwise; and UBijis the error term.
The coeficients b10, b11, and b12 are the percentage point differentials between
minority-foreign, majority-foreign, and heavily foreign MNEs, on the one hand,
15. Eskeland and Harrison’s (2003) model includes the R&D ratio and plant vintage. It also includes machinery imports, but that variable is not available in the Indonesian census data.
266 Eric D. Ramstetter and Dionisius Narjoko
and private plants, on the other, after accounting for scale and other factor usage and the four indicators of technological sophistication.
To determine whether the presence of MNEs or SOEs affected energy eficiency in local plants, we restrict the sample to private plants and replace the ownership dummies in equations (1) and (2) with the corresponding MNE or SOE shares of labour or output:
where (other variables as deined above) SFj is the share of MNEs in the labour or output of industry j (%), SSj that of SOEs, SFMIN j that of minority-foreign MNEs, SFMAJ j that of majority-foreign MNEs, and SFHVY j that of heavily foreign MNEs. The error terms are UCij and UDij.
Energy requirements differ greatly among manufacturing industries, so the determinants of energy intensities (including SOE–private and MNE–private differentials) are also likely to have differed similarly. We therefore compare the industry-level estimates of equations (1) and (2) with estimates in samples of the 12 highest-energy-consuming industries combined. We account for more detailed, industry-related differences in intercepts in all regressions by adding industry dummies at the four-digit level, when possible.16 When estimating equations
(3) and (4), we limit the industry dummies to the 12 highest-energy-consuming industries because we measure the shares of SOEs and MNEs at the three- or four-digit level. We include regional dummies to account for the effects of plant location on intercepts.17 Because the data cover two years, including a period of
severe economic crisis and large structural change, we estimate the models in the cross-section using ordinary least squares with robust standard errors to control for heteroskedasticity. The lack of panel data and usable instruments in the cross-sectional data limits our ability to address simultaneity.
Even after we exclude plants that reported extreme values of production or the average product of labour, 28%–33% of plants in high-energy-consuming
16. One industry, motor vehicles, was a four-digit category in ISIC Revision 2 (1996). In
other industries, it is sometimes necessary to combine four-digit categories with few
obser-vations or ambiguous deinitions.
17. We use Jakarta as the reference region and regional dummies to identify plants in ive regions—Sumatra, West Java, Central Java (including Yogyakarta), East Java, and East In -donesia (including Nusa Tenggara, Kalimantan, Sulawesi, Maluku, and Irian Jaya). We omitted plants in East Indonesia from some estimates of equations (1) and (2), to avoid perfect correlations with ownership dummies (paper products in 1996, basic metals in 2006, and electronics-related machinery and motor vehicles in both years [Ramstetter and Narjoko 2012, appendix tables 3, 6, 7]).
Ownership and Energy Eficiency in Indonesian Manufacturing 267
industries did not report data on ixed assets in 1996 and 43%–48% did not do so in 2006. More plants reported year-end capital than initial capital. Estimates using initial capital are preferable because they reduce the possibility of simultaneity, but samples using year-end capital are up to 15% larger.18 Yet even the smallest
samples—such as total energy and natural gas in basic metals (105 plants in 1996 and 130 in 2006)—are large enough to facilitate reasonable inference.
Differentials in Energy Intensities
The quantity of total energy is not measurable, so we use as a proxy the quan-tity of electricity (as in Eskeland and Harrison 2003). We measure quantities of other energy types directly, in homogeneous units. The performance of the model varies substantially, depending on the energy intensity, period, and industry (Ramstetter and Narjoko 2012, appendix tables 3, 6, 7). In the samples of plants combined, for example, the model is effective in explaining variations in total energy and coal intensities in 1996 (R-squared of 0.59 or higher) but less effective in explaining variations in gas intensities in 1996 and 2006 and coal intensities in 2006 (R-squared of 0.36 or lower). As expected, explanatory power across indus-tries also varied substantially. However, even the lowest R-squared (0.18 for total energy in other transportation machinery in 2006) was not unusually low for such cross-sections.
In almost all estimates of equation (1) for total energy, the coeficients on labour and the energy quantity were positive and at least weakly signiicant at the 5% level or better, while the coeficients on intermediate consumption (excluding the energy input in question) were negative and signiicant. In estimates of equa-tion (2), however, the coeficients on intermediate consumpequa-tion and the energy quantity differed in sign depending on the industry. Moreover, the coeficient on the energy quantity was positive and signiicant in most gas and coal estimates (Ramstetter and Narjoko 2012, appendix tables 3, 6, 7). Higher shares of workers with secondary education were positively and signiicantly correlated with total energy intensities in slightly under half of the estimates. Other indicators of tech-nological sophistication were not generally signiicant determinants of energy intensities, and the correlations were weakest for gas and coal.
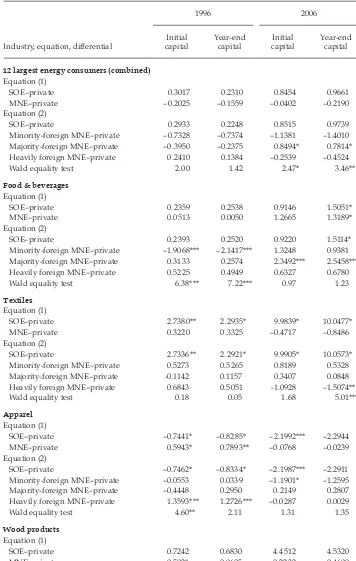
Our estimates of total energy intensities for all 12 industries combined (the top panel of table 3) suggest that all SOE–private and MNE–private differentials were statistically insigniicant in 1996. The positive differential between majority-foreign MNEs and private plants was the only weakly signiicant (at the 10% level or better) differential in 2006. Tests of the hypothesis that MNE–private differen-tials differed among MNE ownership groups are rejected at either the 10% level (initial capital) or the standard 5% level (year-end capital), suggesting that equa-tion (2) is preferable to equaequa-tion (1). Yet none of the differentials in equaequa-tion (2) are signiicant at the standard 5% level or better.
As the data in table 2 suggest, ownership-related differentials and other slope coeficients sometimes differed greatly among industries. However, industry-level
18. Ramstetter and Narjoko (2012, 2013) report in appendix tables the results of estimates
in large samples that omit capital. Choosing or omitting the capital variable does not have
a predictable effect on estimates of MNE–private differentials, SOE–private differentials, or spillovers.
TABLE 3 Estimates of Total-Energy-Intensity Differentials from Equations (1) and (2)
SOE–private 0.3017 0.2310 0.8454 0.9661
MNE–private –0.2025 –0.1559 –0.0402 –0.2190
Equation (2)
SOE–private 0.2933 0.2248 0.8515 0.9739
Minority-foreign MNE–private –0.7328 –0.7374 –1.1381 –1.4010 Majority-foreign MNE–private –0.3950 –0.2375 0.8494* 0.7814* Heavily foreign MNE–private 0.2410 0.1384 –0.2539 –0.4524
Wald equality test 2.00 1.42 2.47* 3.46**
Food & beverages
Equation (1)
SOE–private 0.2359 0.2538 0.9146 1.5051*
MNE–private 0.0513 0.0050 1.2665 1.3189*
Equation (2)
SOE–private 0.2393 0.2520 0.9220 1.5114*
Minority-foreign MNE–private –1.9068*** –2.1417*** 1.3248 0.9381 Majority-foreign MNE–private 0.3133 0.2574 2.3492*** 2.5458*** Heavily foreign MNE–private 0.5225 0.4949 0.6327 0.6780
Wald equality test 6.38*** 7.22*** 0.97 1.23
Textiles
Equation (1)
SOE–private 2.7380** 2.2935* 9.9839* 10.0477*
MNE–private 0.3220 0.3325 –0.4717 –0.8486
Equation (2)
SOE–private 2.7336** 2.2921* 9.9905* 10.0573*
Minority-foreign MNE–private 0.5273 0.5265 0.8189 0.5328 Majority-foreign MNE–private -0.1142 0.1157 0.3407 0.0848 Heavily foreign MNE–private 0.6843 0.5051 -1.0928 –1.5074**
Wald equality test 0.18 0.05 1.68 5.01***
Apparel
Equation (1)
SOE–private –0.7441* –0.8285* –2.1992*** –2.2944
MNE–private 0.5943* 0.7893** –0.0768 –0.0239
Equation (2)
SOE–private –0.7462* –0.8334* –2.1987*** –2.2911
Minority-foreign MNE–private –0.0553 0.0339 –1.1901* –1.2595 Majority-foreign MNE–private –0.4448 0.2950 0.2149 0.2807 Heavily foreign MNE–private 1.3593*** 1.2726*** –0.0287 0.0029
Wald equality test 4.60** 2.11 1.31 1.35
Wood products
Equation (1)
SOE–private 0.7242 0.6830 4.4512 4.5320
MNE–private –0.5021 –0.0605 –0.2232 –0.4600
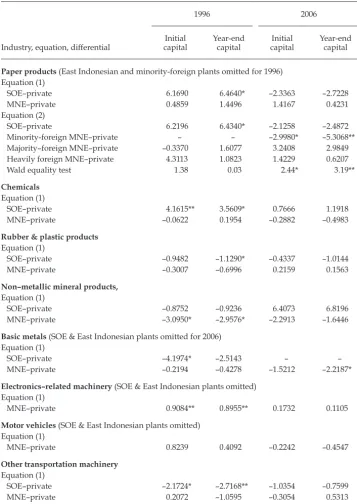
TABLE 3 (continued)
Paper products (East Indonesian and minority-foreign plants omitted for 1996) Equation (1)
SOE–private 6.1690 6.4640* –2.3363 –2.7228
MNE–private 0.4859 1.4496 1.4167 0.4231
Equation (2)
SOE–private 6.2196 6.4340* –2.1258 –2.4872
Minority-foreign MNE–private – – –2.9980* –5.3068**
Majority–foreign MNE–private –0.3370 1.6077 3.2408 2.9849 Heavily foreign MNE–private 4.3113 1.0823 1.4229 0.6207
Wald equality test 1.38 0.03 2.44* 3.19**
Chemicals
Equation (1)
SOE–private 4.1615** 3.5609* 0.7666 1.1918
MNE–private –0.0622 0.1954 –0.2882 –0.4983
Rubber & plastic products
Equation (1)
SOE–private –0.9482 –1.1290* –0.4337 –1.0144
MNE–private –0.3007 –0.6996 0.2159 0.1563
Non–metallic mineral products,
Equation (1)
SOE–private –0.8752 –0.9236 6.4073 6.8196
MNE–private –3.0950* –2.9576* –2.2913 –1.6446
Basic metals (SOE & East Indonesian plants omitted for 2006) Equation (1)
SOE–private –4.1974* –2.5143 – –
MNE–private –0.2194 –0.4278 –1.5212 –2.2187*
Electronics–related machinery (SOE & East Indonesian plants omitted) Equation (1)
MNE–private 0.9084** 0.8955** 0.1732 0.1105
Motor vehicles (SOE & East Indonesian plants omitted) Equation (1)
MNE–private 0.8239 0.4092 –0.2242 –0.4547
Other transportation machinery
Equation (1)
SOE–private –2.1724* –2.7168** –1.0354 –0.7599
MNE–private 0.2072 –1.0595 –0.3054 0.5313
Note: SOE = state-owned enterprise. MNE = multinational enterprise. – = no plants in category. Wald tests address the hypothesis that MNE–private differentials are equal for all MNE groups and associ-ated p-values. Equation (2) results are omitted for industries if all Wald tests of MNE group equality
for the industry are not signiicant at the 10% level. For other slope coeficients and equation statistics,
see Ramstetter and Narjoko (2012, appendix table 3).
* p < 0.1; ** p < 0.05; *** p < 0.01.
270 Eric D. Ramstetter and Dionisius Narjoko
results were consistent with estimates for the 12 highest-energy-consuming indus-tries, suggesting that the correlation between ownership and total energy intensi-ties was generally weak (table 3). For example, all ownership coeficients were insigniicant (at the 5% level or better) in paper products in 1996; in chemicals, electronics-related machinery, and other transportation machinery in 2006; and in wood, rubber and plastics, non-metallic mineral products, basic metals, and motor vehicles in both years. We observed negative and signiicant (at the 5% level) differentials for minority-foreign plants in food and beverages and for SOEs in other transportation machinery in 1996; for heavily foreign plants in textiles and, using year-end capital, for minority-foreign plants in paper products in 2006; and, using initial capital, for SOEs in apparel in 2006. Positive and signiicant dif-ferentials were slightly less frequent, and were restricted to 1996; we observed them for SOEs in textiles and, using initial capital, for SOEs in chemicals; for heav-ily foreign MNEs in apparel; and for all MNEs in electronics-related machinery. These results suggest few signiicant differentials. Only about a quarter of the esti-mated differentials in table 3 were weakly signiicant at the 10% level. Moreover, only the positive SOE–private differential in textiles was signiicant with the same sign in both speciications in 1996 and 2006.
Natural gas is a relatively clean source of energy, so we would expect posi-tive ownership-related differentials if MNEs or SOEs used large amounts of it. Yet in estimates for the eight highest gas-consuming industries combined, SOEs had signiicantly lower gas intensities than private plants in 1996, while other SOE–private and MNE–private differentials were insigniicant (Ramstetter and Narjoko 2012, table 6).19 All ownership-related differentials were insigniicant in
four of the eight industries (textiles, paper products, basic metals, and metal prod-ucts). The results for other industries revealed a few signiicant MNE–private and SOE–private differentials, but their signs and signiicance levels varied substan-tially depending on the year or the measure of capital. Any signiicant differen-tials were negative, but the relation of ownership to gas intensities was weak.
The correlations of ownership and coal intensities were also weak, with 78% of the estimated differentials being insigniicant (Ramstetter and Narjoko 2012, table 7). Negative MNE–private differentials in chemicals and in all four industries combined (using year-end capital) were the only weakly signiicant differentials in 1996. Signiicant or weakly signiicant differentials were more common in 2006 but were all positive. When we combined all four coal-intensive industries the SOE–private differentials were insigniicant in 1996 but positive and signiicant in 2006, and all MNE–local differentials were insigniicant at standard levels.
Correlations of Energy Intensities in Private Plants and SOE or MNE Shares
In order to examine the robustness of our spillover estimates, we measure the pres-ence of MNEs and SOEs in both labour and output shares and at the three- and four-digit levels of ISIC. Revision 2 (1996) of the classiication is more aggregated than Revision 3 (2006). This complicates comparisons of spillover coeficients
19. Our estimates of equation (2) indicate relatively low gas intensities for minority- foreign-owned MNEs in 2006, but we could not reject our tests of the hypothesis that all MNE–private differentials were the same. Our estimates of equation (1) reveal the MNE–
private differential to be insigniicant.
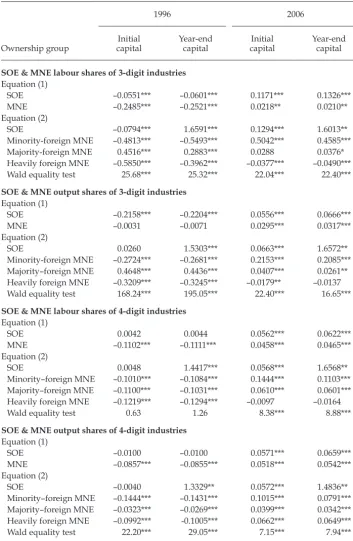
TABLE 4 Correlation between the Presence of State-Owned and Multinational Enterprises and Total-Energy Intensities in Private Plants, from Equations (3) and (4)
1996 2006
SOE & MNE labour shares of 3-digit industries
Equation (1)
SOE –0.0551*** –0.0601*** 0.1171*** 0.1326***
MNE –0.2485*** –0.2521*** 0.0218** 0.0210**
Equation (2)
SOE –0.0794*** 1.6591*** 0.1294*** 1.6013**
Minority-foreign MNE –0.4813*** –0.5493*** 0.5042*** 0.4585*** Majority-foreign MNE 0.4516*** 0.2883*** 0.0288 0.0376* Heavily foreign MNE –0.5850*** –0.3962*** –0.0377*** –0.0490*** Wald equality test 25.68*** 25.32*** 22.04*** 22.40***
SOE & MNE output shares of 3-digit industries
Equation (1)
SOE –0.2158*** –0.2204*** 0.0556*** 0.0666***
MNE –0.0031 –0.0071 0.0295*** 0.0317***
Equation (2)
SOE 0.0260 1.5303*** 0.0663*** 1.6572**
Minority-foreign MNE –0.2724*** –0.2681*** 0.2153*** 0.2085*** Majority–foreign MNE 0.4648*** 0.4436*** 0.0407*** 0.0261** Heavily foreign MNE –0.3209*** –0.3245*** –0.0179** –0.0137 Wald equality test 168.24*** 195.05*** 22.40*** 16.65***
SOE & MNE labour shares of 4-digit industries
Equation (1)
SOE 0.0042 0.0044 0.0562*** 0.0622***
MNE –0.1102*** –0.1111*** 0.0458*** 0.0465***
Equation (2)
SOE 0.0048 1.4417*** 0.0568*** 1.6568**
Minority–foreign MNE –0.1010*** –0.1084*** 0.1444*** 0.1103*** Majority–foreign MNE –0.1100*** –0.1031*** 0.0610*** 0.0601*** Heavily foreign MNE –0.1219*** –0.1294*** –0.0097 –0.0164
Wald equality test 0.63 1.26 8.38*** 8.88***
SOE & MNE output shares of 4-digit industries
Equation (1)
SOE –0.0100 –0.0100 0.0571*** 0.0659***
MNE –0.0857*** –0.0855*** 0.0518*** 0.0542***
Equation (2)
SOE –0.0040 1.3329** 0.0572*** 1.4836**
Minority–foreign MNE –0.1444*** –0.1431*** 0.1015*** 0.0791*** Majority–foreign MNE –0.0323*** –0.0269*** 0.0399*** 0.0342*** Heavily foreign MNE –0.0992*** -0.1005*** 0.0662*** 0.0649***
Wald equality test 22.20*** 29.05*** 7.15*** 7.94***
Note: SOE = state-owned enterprise. MNE = multinational enterprise. Wald tests address the hypothe-sis that MNE shares are equal for all MNE groups and associated p-values. For other slope coeficients and equation statistics, see Ramstetter and Narjoko (2013, appendix table 1).
* p < 0.1; ** p < 0.05; *** p < 0.01.
272 Eric D. Ramstetter and Dionisius Narjoko
among years, but converting Revision 2 to Revision 3, or vice versa, would intro-duce measurement errors and create misleading trends.20
For all local plants in the 12 highest-energy-consuming industries, coeficients on capital, labour, plant vintage, the quantity of electricity, and the share of work-ers with secondary education were always positive and signiicant at the 5% level or better (Ramstetter and Narjoko 2013, appendix table 1), whereas coeficients on other intermediate inputs were consistently negative and signiicant. In other words, capital and labour complemented purchased energy in production, while other intermediate consumption was a substitute. Older plants and plants with large shares of moderately skilled workers also tended to have relatively high energy intensities. The explanatory power of the equations was lower in 2006 than in 1996 (R-squared of 0.24–0.25 and 0.32–0.33, respectively), but the equa-tions performed more or less as expected.
Tests of the hypothesis that coeficients on heavily foreign, majority-foreign, and minority-foreign MNE shares were equal are rejected at the 5% level or bet-ter for all of the four MNE measures for 2006 and three of the four measures for 1996 (table 4), except when we measure labour shares at the four-digit level for 1996. The results of equation (1) for 1996 indicate that the presence of MNEs was negatively and signiicantly correlated with the energy intensities of local plants, but the results of equation (2) for 2006 indicate that minority-foreign and majority-foreign shares were positively and signiicantly correlated with energy intensities in private plants. The coeficient on the minority-foreign share was the largest; heavily foreign shares were not signiicantly correlated. The result was qualitatively similar for four-digit output shares, with all MNE shares negatively and signiicantly correlated in 1996, and positively and signiicantly correlated in 2006. In the four-digit results, the minority-foreign coeficient was largest in abso-lute value, followed by the heavily foreign coeficient and the majority-foreign coeficient. SOE shares were positively and signiicantly correlated in 2006 when using initial capital and in 1996 and 2006 when using year-end capital.
When we measure MNE and SOE shares at the three-digit level, the hypoth-esis that all MNE ownership groups have the same impact is rejected (table 4). The coeficient on majority-foreign shares is positive and signiicant in all 1996 estimates and the 2006 output share estimates, but not in the 2006 labour share estimates. The heavily foreign coeficient is negatively signiicant for both years, except when using output shares and year-end capital. The minority-foreign coef-icient is signiicantly negative in 1996 but positive in 2006, as in the four-digit regressions. The SOE coeficient is again positive and signiicant, except when using initial capital in 1996.
In short, the presence of SOEs was generally correlated with higher energy intensity in local plants—as was the presence of minority-foreign MNEs in 2006— but the presence of minority-foreign MNEs was negatively correlated in 1996. The presence of heavily foreign MNEs was negatively correlated in 1996, but 2006 cor-relations differed depending on the level of aggregation. Results for the presence of majority-foreign MNEs differed depending on the level of aggregation and the choice of labour or output shares.
20. Any conversion would need to split several of the most detailed categories in one
clas-siication among several of the most detailed categories in the other clasclas-siication, creating
measurement errors.
Ownership and Energy Eficiency in Indonesian Manufacturing 273
Spillover analyses often examine subsamples of homogenous industries, to ascertain patterns in the spillovers observed. Our primary concern here is whether spillovers differed between high-energy-consuming (and heavy-polluting) indus-tries and others. Thus, we estimate equations (3) and (4) in samples of the ive highest- and lowest-energy-consuming industries and the ive most and least energy-intensive industries (Ramstetter and Narjoko 2013, appendix tables 4a, 4b, 5a, 5b).21 In the ive highest-energy-consuming industries and the ive
most energy-intensive industries, the results resembled those of the combined 12-industry sample, partially because the samples were relatively large. The effect of MNE presence differed among ownership groups in both years, but the signs and signiicance of coeficients on SOE and MNE presence varied greatly depend-ing on the year, capital measure, level of aggregation, and measure of SOE or MNE presence (shares of labour or output). Results for the ive lowest-energy-consuming industries and the ive least energy-intensive industries were similar and generally relatively weak.
CONCLUSIONS
This article’s literature review highlighted the mixed results of previous studies of ownership-related productivity differentials and spillovers in manufacturing industries of developing economies like Indonesia. Studies of Indonesia suggest that MNEs are more productive than local plants and are the source of positive spillovers to local plants in most large samples, but the correlations between own-ership and productivity are much weaker in industry subsamples. We show that the relation between plant ownership and energy intensities (the inverse of aver-age energy productivity) in Indonesian manufacturing was weak in both 1996 and 2006. When ownership-related differentials in energy intensities were statistically signiicant, they varied greatly by year, industry, and measure of capital. We ind that ownership-related differentials in energy intensity were neither pronounced nor consistent. Results of spillover analysis were similarly inconsistent. In 1996, energy intensities in private plants were often positively correlated with the pres-ence of SOEs and majority-foreign MNEs but often negatively correlated with the presence of heavily foreign and minority-foreign MNEs. In 2006, however, spill-over coeficients often had the reverse sign and were sensitive to the sample exam-ined as well as to the measure of SOE or MNE presence and its level of aggregation. Our results suggest that plants of all types used energy with more or less the same eficiency in 1996 and 2006. Despite observing many signiicant spillover coeficients, the evidence yields no clear insights into the nature of energy-intensity spillovers in Indonesia. We are therefore cautious about drawing conclusions, but it does not seem meaningful for policymakers to focus on plant ownership if the desire is to promote energy eficiency in Indonesian manufacturing. In any case, promoting energy eficiency remains a low public policy priority in Indonesia.
21. For example, the ive highest-energy-consuming industries were wood and non-metallic
mineral products in 1996; chemicals and basic metals in 2006; and food and beverages,
textiles, and paper products in both years. The ive most energy-intensive industries were
paper products and basic metals in 1996; textiles and chemicals in 2006; and food and bev-erages, rubber and plastics, and non-metallic mineral products in both years.
274 Eric D. Ramstetter and Dionisius Narjoko
REFERENCES
Aharoni, Yair. 2000. ‘The Performance of State-Owned Enterprises’. In The Rise and Fall of State-Owned Enterprise in the Western World, edited by Pier Angelo Toninelli, 49–72.
Cambridge UK: Cambridge University Press.
Asian Development Bank. 2004. Key Indicators of Developing Asian and Paciic Countries 2004. Manila: Asian Development Bank.
———. 2011. Key Indicators for Asia and the Paciic 2011. Manila: Asian Development Bank.
Asia Paciic Energy Research Centre. 2009. Economy Reviews. Vol. 2. of APEC Energy Demand and Supply Outlook, 4th ed. Tokyo: Institute of Energy Economics.
Badan Pusat Statistik (BPS). 1990–2009. Statistik Industri [Industrial statistics]. Published volumes and underlying plant-level data. Jakarta: BPS.
Blalock, Garrick, and Paul J. Gertler. 2008. ‘Welfare Gains from Foreign Direct Investment
through Technology Transfer to Local Suppliers’. Journal of International Economics 74 (2): 402–21.
Blomström, Magnus, and Fredrik Sjöholm. 1999. ‘Technology Transfer and Spillovers: Does
Local Participation with Multinationals Matter?’. European Economic Review 43 (4–6): 915–23.
Brown, J. David, John S. Earle, and Álmos Telegdy. 2004. ‘Does Privatization Raise
Produc-tivity? Evidence from Comprehensive Panel Data on Manufacturing Firms in Hungary, Romania, Russia, and Ukraine’. CERT Discussion Paper 2004/10. Edinburgh: Centre
for Economic Reform and Transformation, Heriot-Watt University.
———. 2006. ‘The Productivity Effects of Privatization: Longitudinal Estimates from Hun-gary, Romania, Russia, and Ukraine’. Journal of Political Economy 114 (1): 61–99.
Caves, Richard E. 2007. Multinational Enterprise and Economic Analysis. Cambridge, UK:
Cambridge University Press.
Cole, Matthew A., Robert J. R. Elliott, and Kenichi Shimamoto. 2006. ‘Globalization, Firm-Level Characteristics and Environmental Management: A Study of Japan’. Ecological Economics 59 (2): 312–23.
Djankov, Simeon, and Peter Murrell. 2002. ‘Enterprise Restructuring in Transition: A Quan-titative Survey’. Journal of Economic Literature 60 (3): 739–92.
Dunning, John H. and Sarianna M. Lundan. 2008. Multinationals and the Global Economy,
2nd ed. Cheltenham, UK: Edward Elgar.
Earnhart, Dietrich, and Lubomir Lizal. 2006. ‘Effects of Ownership and Financial Perfor
-mance on Corporate Environmental Perfor-mance’. Journal of Comparative Economics 34 (1): 111–29.
Eskeland, Gunnar S. and Ann E. Harrison. 2003. ‘Moving to Greener Pastures? Multina-tionals and the Pollution Haven Hypothesis’. Journal of Development Economics 70 (1): 1-23.
Fan, Emma Xiaoqin. 2002. ‘Technological Spillovers from Foreign Direct Investment—A
Survey’, ERD Working Paper 33. Manila: Asian Development Bank.
Görg, Holger, and David Greenaway. 2004. ‘Much Ado about Nothing? Do Domestic Firms Really Beneit from Foreign Direct Investment?’. World Bank Research Observer 19 (2): 171–97.
Görg, Holger, and Eric Strobl. 2001. ‘Multinational Companies and Productivity Spillovers:
A Meta-Analysis’. The Economic Journal 111 (475): F723–39.
Haji Ahmad, Shahrazat Binti. 2010. ‘A Quantitative Study on the Productivity of the Manu-facturing Industry in Malaysia’, PhD diss., University of Kitakyushu.
Hartono, Djoni, Tony Irawan, and Noer Azam Achsani. 2011. ‘An Analysis of Energy Inten-sity in Indonesian Manufacturing’. International Research Journal of Finance and Econom-ics 62: 77–84.
He, Jie. 2006. ‘Pollution Haven Hypothesis and Environmental Impacts of Foreign Direct Investment: The Case of Industrial Emission of Sulfur Dioxide (SO2) in Chinese Prov -inces’. Ecological Economics 60 (1): 228–45.
Ownership and Energy Eficiency in Indonesian Manufacturing 275
Jefferson, Gary H., and Jian Su. 2006. ‘Privatization and Restructuring in China: Evidence
from Shareholding Ownership, 1995–2001’. Journal of Comparative Economics 34 (1): 146–66.
Khalifah, Noor Aini, and Radziah Adam. 2009. ‘Productivity Spillovers from FDI in Malay -sian Manufacturing: Evidence from Micro-panel Data’. A-sian Economic Journal 23 (2): 143–67.
Kohpaiboon, Archanun. 2006a. ‘Foreign Direct Investment and Technology Spillover: A Cross-Industry Analysis of Thai manufacturing’. World Development 34 (3): 541–56. ———. 2006b. Multinational Enterprises and Industrial Transformation: Evidence from
Thai-land. Cheltenham, UK: Edward Elgar.
———. 2009. ‘Vertical and Horizontal FDI Technology Spillovers: Evidence from Thai Manufacturing’. ERIA Discussion Paper 2009-08. Jakarta: Economic Research Institute of ASEAN and East Asia.
Le Quoc Hoi and Richard Pomfret. 2011. ‘Technology Spillovers from Foreign Direct Invest -ment in Vietnam: Horizontal or Vertical Spillovers’. Journal of the Asia Paciic Economy 16 (2): 183–201.
Lipsey, Robert E., and Fredrik Sjöholm. 2004. ‘FDI and Wage Spillovers in Indonesian Man -ufacturing,’ Review of World Economics 140 (2): 321–32.
———. 2005. ‘Host Country Impacts of Inward FDI: Why Such Different Answers?’. In Does Foreign Direct Investment Promote Development?, edited by Theodore H. Moran,
Edward M. Graham, and Magnus Blomstrom, 23–43. Washington DC: Institute for
International Economics.
———. 2006. ‘Foreign Multinationals and Wages in Indonesia’. In Multinationals in Indo-nesia and Thailand: Wages, Productivity and Exports, edited by Eric D. Ramstetter and
Fredrik Sjöholm, 35–53. Basingstoke: Palgrave Macmillan.
Markusen, James R. 1991. ‘The Theory of the Multinational Enterprise: A Common Ana
-lytical Framework’. In Direct Foreign Investment in Asia’s Developing Economies and
Struc-tural Change in the Asia-Paciic Region, edited by Eric D. Ramstetter, 11–32. Boulder, CO:
Westview Press.
———. 2002. Multinational Firms and the Theory of International Trade. Cambridge, MA: MIT Press.
Mebratie, Anagaw Derseh, and Peter A. G. van Bergeijk. 2013. ‘Firm Heterogeneity and Development: A Meta-analysis of FDI Productivity Spillovers’. The Journal of Interna-tional Trade & Economic Development 22 (1): 10–52.
Movshuk, Oleksandr, and Atsuko Matsuoka-Movshuk. 2006. ‘Multinationals and Wages in Thai Manufacturing’, in Multinationals in Indonesia and Thailand: Wages, Productivity and Exports, edited by Eric D. Ramstetter and Fredrik Sjöholm, 54–81. Basingstoke: Palgrave Macmillan.
Nguyen Ngoc Anh, Nguyen Thang, Le Dang Trung, Pham Quang Ngoc, Nguyen Dinh
Chuc, and Nguyen Duc Nhat. 2008. ‘Foreign Direct Investment in Vietnam: Is There Any Evidence of Technological Spillover Effects’. DEPOCEN Working Paper 2008/18. Hanoi: Development and Policies Research Center.
Nguyen Phi Lan. 2008. ‘Productivity Spillovers from Foreign Direct Investment: Evidence from Vietnamese Firm Data’. Working paper, School of Commerce, University of South
Australia.
Oguchi, Noriyoshi, Nor Aini Mohd Amdzah, Zainon Bakar, Rauzah Zainal Abidin, and
Mazlina Shaii. 2002. ‘Productivity of Foreign and Domestic Firms in the Malaysian
Manufacturing Industry’. Asian Economic Journal 16 (3): 215–28.
Pessoa, Argentino. 2007. ‘FDI and Host Country Productivity: A Review’. FEP Working
Paper 251. Porto: University of Porto.
Pham Xuan Kien. 2008. ‘The Impact of Foreign Direct Investment on the Labor Productiv
-ity in Host Countries: The Case of Vietnam’. VDF Working Paper 0814. Hanoi: Vietnam Development Forum.