See discussions, stats, and author profiles for this publication at: https://www.researchgate.net/publication/313126960
Effect of N-Doped Graphene for Properties of Pt/N-Doped Graphene Catalyst
Article in ChemistrySelect · January 2017
DOI: 10.1002/slct.201601561
CITATION
1
READS
36
4 authors, including:
Some of the authors of this publication are also working on these related projects:
Fuel cells and primary battery base on graphene andf N-grapheneView project Rikson Siburian
University of Sumatera Utara
19PUBLICATIONS 84CITATIONS SEE PROFILE
z
Materials Science inc. Nanomaterials
&
Polymers
Effect of N-Doped Graphene for Properties of Pt/N-Doped
Graphene Catalyst
Rikson Siburian,*
[a]Kerista Sebayang,*
[b]Minto Supeno,
[a]and Harlem Marpaung
[a]Nitrogen doping into graphene was carried out by heating Graphene Nano Sheets (GNS) in ammonia to produce N-doped graphene (N G). The N G was used as a support material for Pt catalyst as well as a catalyst itself for half-cell cathode reaction of hydrogen fuel cell (H2FC). It is found that the Oxygen
Reduction Reaction (ORR) electro catalytic activity for N G 900 (0.63 V versus RHE) is higher than GNS. It indicates that the incorporation of nitrogen in N G may affect the ORR activities.
XPS results exhibit the pyridinic N is the majority in N G, where the pyridinic N refers to N atom bonds with two C atoms at the edges or defects of graphene. Interestingly, the Pt subnano-clusters were formed on all of Pt/N G catalysts with Pt particle size (0.7–1.0 nm). It clearly indicates that the doping of nitrogen significantly influencep–d hybridization in terms of electronic structures.
Introduction
Graphene, a single layer of sp2-bonded carbon atoms arranged
in a honeycomb lattice, has been attracting much attention due to its fascinating properties,[1] such as high surface area
(2630 m2g 1),[2]high thermal conductivity (
~4840–5300 W m 1
K 1),[3]fast charged carrier mobility (200 000 cm2V–1s–1),[4]strong
Young’s modulus (1 TPa),[5]and high carrier mobility (104 cm2
V 1 s 1 at room temperature).[1] All these aspects make
graphene material promising for various applications, including energy conversion and storage, electro catalysis, sensors and electronics.[6]
However, the absence of a band gap in perfect graphene does not allow switching of graphene-based transistors with a high enough on–off ratios. Hence, graphene has to be modified even when making basic devices and, even more, for manufacturing sophisticated circuits. Therefore, the defect in graphene can be hoped to alter its properties. It is well known that defects are not always stationary and that their migration can have an important influence on the properties of a defective crystal. The migration is generally governed by an
activation barrier which depends on the defect type and increases exponentially with temperature. Defects can be done by using irradiation or chemical treatments. The chemical treatment, for instance chemical dopant may change the local electronic structure or inject charge into the electron system of sp2-bonded carbon materials.[7]
Aforementioned, the chemical doping is an important way to modulate the properties of graphene sheets. There are two means to chemically dope graphene: (i) the adsorption of gas, metal, or organic molecules to the graphene surface and (ii) substitution doping, which introduces heteroatoms, such as nitrogen atoms or boron atoms, into the carbon lattice of graphene. Substitution doping, which replaces some of carbon atoms in sp2 network with foreign atoms such as nitrogen or
boron, is more favorable than molecular doping from the viewpoint of structural robustness.[8] Both of these methods
can modulate the electronic properties of graphene.[6]Doping
nitrogen on carbon material is usually fulfilled via treatment of carbons by gaseous ammonia (NH3), which it can enhance the
conductivity of graphene[9]and incorporating different types of
nitrogen into the carbon network would provide N-doped graphene (N G) with more functional groups for property design.[10]
The N G shows different properties compared with the pristine graphene. For instance, the N G exhibits high electro catalytic activities for the oxygen reduction reaction (ORR). A possible approach to enhancing ORR activity is to introduce abundant defects and functional groups onto graphene to increase the number of catalytic sites. This is caused the nitrogen doping introduces spin density to the graphene and changes the atomic charge distribution on it. Note that, the catalytic active sites on the N G have either high positive spin density or high positive atomic charge density.[11]That is why,
this kind of activated region can participate in catalytic reactions directly, such as the oxygen reduction reaction (ORR), or anchor the metal nanoparticles used in the catalytic reaction.[6] Among the nitrogen-doped structure, the pyridinic
[a] Dr. R. Siburian, Dr. M. Supeno, Prof. H. Marpaung
Chemistry Department
Faculty of Mathematic and Natural Science University of Sumatera Utara
Faculty of Mathematic and Natural Science University of Sumatera Utara
Medan, Indonesia, 20500 E-mail: [email protected]
N were reported to play an important role in the enhanced ORR activity in acidic solution[12] and alkaline solution.[13] The
computational study shows the graphene which contains nitrogen atoms at specific sites can exhibit metal-free catalytic activity.[14] Nevertheless, only a few of experimental studies
have been reported so far about synthesis N G, such as growth of N G on Pt(111) surface[8] and synthesis of N G by using
chemical vapor deposition (CVD) method, whereas a metal catalyst (Cu or Ni) is used as substrate, then at high temper-ature, a carbon source gas mixed with a nitrogen-containing gas is introduced.6Thus, fabrication of N G is strongly required.
The development of fuel cells as a clean-energy technology is largely limited by the prohibitive cost of the noble-metal catalysts which needed for catalyzing the oxygen reduction reaction (ORR) in fuel cells. The ORR taking place at the cathode of polymer-electrolyte-membrane fuel cells (PEMFC) has been attracting much attention because of the desire to elucidate its slow kinetics on electrocatalyst surfaces whereas this slow kinetics is one of the bottlenecks for achieving improved efficiencies in the fuel cell operation.[15]
Oxygen reduction reaction (ORR) catalysts based on pre-cious metals such as platinum (Pt) or its alloys are routinely used in fuel cells because of their high activity and may promote the chemical reaction. The Pt nanoparticles supported by carbon nanostructures are a popular catalyst/support combination for many reactions including electricity generation using fuel cells.[16]However, Pt is expensive and susceptible to
time-dependent drift and CO poisoning. Thus, developing inexpensive electrocatalysts with high catalytic activity will accelerate the process of fuel cell commercialization.[17]
A low reduction oxygen rate at the cathode is one of the major challenges to overcome.[18] Although some theoretical
work has been done on ORR pathways on N G,[11, 19]the role of
N G for ORR activity remains unclear.[17] There are two
strategies in order to improve the cathode long-term activity, namely enhancement of interaction between Pt and support materials and development of corrosion support material.[20–22]
Therefore, the innovation to invent the high ORR catalytic activity is needed because it is recognized be able to improve catalyst stabilities and reducing Pt usage.
In this paper, we prepared the N G by the heat-treatment of graphene nano sheets (GNS) under ammonia, and studied the effect of nitrogen doping on the structure of graphene systematically. We also reported the role of graphene and N G annealing temperature in NH3on Pt/GNS and Pt/N G for ORR
activity. We focus on the electrochemical performance of N G and Pt nanoparticles supported on N G because this subject has not been studied yet in detail. Here, The N G and Pt/N G were characterized by X-ray photoelectron spectroscopy (XPS), X-ray diffraction (XRD), and oxygen reduction reaction (ORR) measurement, respectively.
Results and discussion
ORR of N-doped graphene
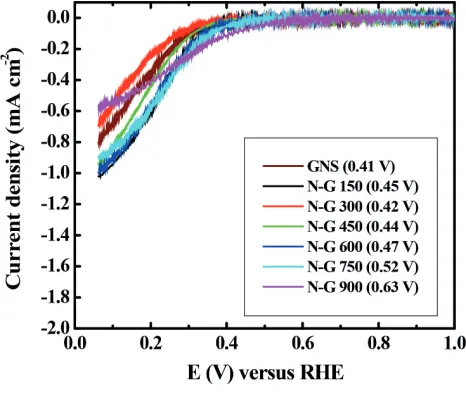
The ORR at the cathode of fuel cells plays a key role in controlling the performance of a fuel cell, and efficient ORR electrocatalysts are essential for practical applications of the fuel cells.[24] We performed the rotating ring disk electrode
(RRDE) measurements to investigate ORR activity of GNS and NG 150–900 in oxygen saturated 0.1 M HClO4.
Figure 1 shows the onset potentials of GNS (0.41 V) and around 0.42–0.63 V versus RHE for N G 150–900, respectively. It
shows that the ORR activity of GNS is not significant different with N G 150–600, however, the ORR electrocatalytic activity for N G 750 and 900 is higher among GNS and N G 150–600. It indicates that the pristine GNS has a poor ORR activity whereas N G 900 exhibits significantly enhanced ORR activity. Thereby, the ORR activities of N G 150–900 are affected by annealing temperature in ammonia.
XRD of N-doped graphene
Figure 2 shows the XRD patterns for graphite, GNS and N G 150–900, respectively. The C(002) peaks appear at 26.68, 24.48, and around 25–268 (2q) which correspond to the interlayer distances (d) 3.34, 3.64, 3.4–3.5 for graphite, GNS, and N G 150–900, respectively. The broad peak and slight shifts of C (002) peaks from 26.6 8 to 24.4 8, indicate that the graphene sheets are formed. Note that, some graphitic species still remain with graphene sheets. It means a stacking of graphene. In the case of N G 150–900, the C(002) peaks slightly shift compared to that of GNS. It means d of N G is smaller than that of GNS. This data indicates that the nitrogen atoms are present in N G. Furthermore, the d values of N G tend to decrease with increasing annealing temperature in ammonia. It
Figure 1.
missing caption
indicates that interlayer space for N G is influenced by the heating temperature in ammonia.
XPS of N-doped graphene
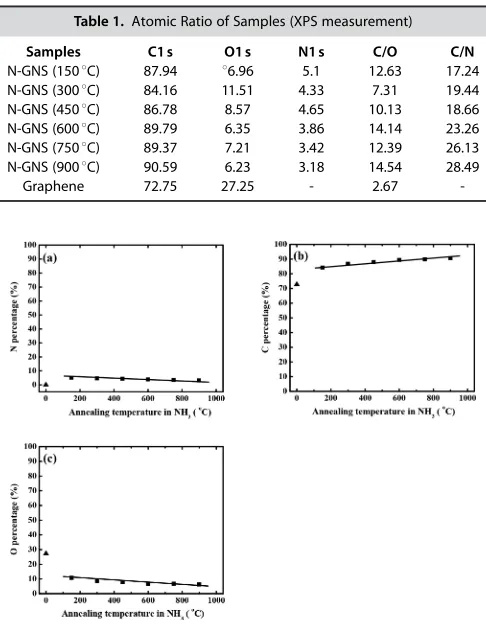
XPS measurements were carried out to probe the presence of nitrogen atoms in the N G structure. As shown in Figure 3, the
N 1 s peaks appear at 400 eV for N G 150–900. It indicates that nitrogen atoms exist on N G structure. The N levels in N G
150–900 are in a range of 3–5% (Table 1), with 1508C annealing affording the highest N-doping level (5%) (Figure 4a).
Moreover, the XPS spectra of C 1 s peaks of N G 150–900 shift to lower binding energy than that of GNS (Figure 5). This is probably due to the removal some functional groups in the pristine GNS by ammonia. It suggests that an incorporation C N. This result is consistent with XPS spectra of N 1 s (Figure 6). The N 1 s peaks at 397–399 eV, correspond to that of pyridinic N. The pyridinic N refers to N atom bonds with two C atoms at the edges or defects of graphene and contributes one pelectron to thepsystem.[9, 25]It indicates that nitrogen atoms
of ammonia have been incorporated into the graphene hexagon rings to form C N bonds and afford N G.[13]The high
resolution C 1 s and N 1 s XPS spectra of N G 150–9008C can be seen in Supporting Information (Figure 3S and 4S). It indicates that pyridinic N is majority including in N G.
ORR of Pt/GNS, Pt/ N-G 150–900, and Pt/CB (commercial) catalysts
Figure 7 shows the polarization curves for the ORR on 20 wt % Pt/GNS, Pt/N G 150–900, and Pt/CB commercial catalysts. It can be seen that the diffusion-limiting currents were obtained in the potential region below 0.4 V versus RHE. Both of the Pt/
Figure 2.
missing caption
Figure 3.
missing caption
Table 1.Atomic Ratio of Samples (XPS measurement)
Samples C1 s O1 s N1 s C/O C/N
N-GNS (1508C) 87.94 86.96 5.1 12.63 17.24
N-GNS (3008C) 84.16 11.51 4.33 7.31 19.44
N-GNS (4508C) 86.78 8.57 4.65 10.13 18.66
N-GNS (6008C) 89.79 6.35 3.86 14.14 23.26
N-GNS (7508C) 89.37 7.21 3.42 12.39 26.13
N-GNS (9008C) 90.59 6.23 3.18 14.54 28.49
Graphene 72.75 27.25 - 2.67
GNS and Pt/N G catalysts show smaller limiting current in ORR than Pt/CB. It indicates that the diffusion limiting currents are affected by the structure of the catalyst supporting material.[26]
The 20 wt % Pt/GNS exhibits the highest ORR activity from its onset potential (0.99 V versus RHE) and half wave potential (E1/2
0.88 V versus RHE) among the other catalysts. In the case of
20 wt % Pt/NG 150–600, the ORR activities tend to decrease with increasing heating temperature in ammonia. Their onset potentials are decreased from 0.95 to 0.86 V versus RHE for 20 wt % Pt/N G 150 to Pt/N G 600. Then, the onset potentials are increased from 0.92 to 0.94 V versus RHE for 20 wt % Pt/N G 750 to 900. It indicates that the ORR activity of N G is higher than N G 300–750, but it is slight lower than N G 150. The current density was measured at 0.9 V versus RHE are 0.99 and
0.97 mA cm 2 for 20 wt % Pt/CB commercial and Pt/GNS
catalysts, respectively (Figure 8). On the other hand, the current
densities are 0.6, 0.4, 0.1, 0.02, 0.2, and 0.7 mA cm 2for 20 wt %
Pt/N G 150–900 catalysts, respectively. The current density results of 20 wt % Pt/NG 150–900 are also consistent with their ORR data. The current densities are decreased with increasing heating temperature ammonia for 20 wt % Pt/N G 150–600. Then, their current densities increase with increasing heating temperature ammonia for 20 wt % Pt/N G 750–900. These data indicate that heating temperature in ammonia affects the ORR activity for 20 wt % Pt/N G 150–900 catalysts. However, the ORR activity of Pt/GNS is higher than that of Pt/N G with its
Figure 5.
missing caption
Figure 6.
missing caption
Figure 7.
missing caption
Figure 8.
missing caption
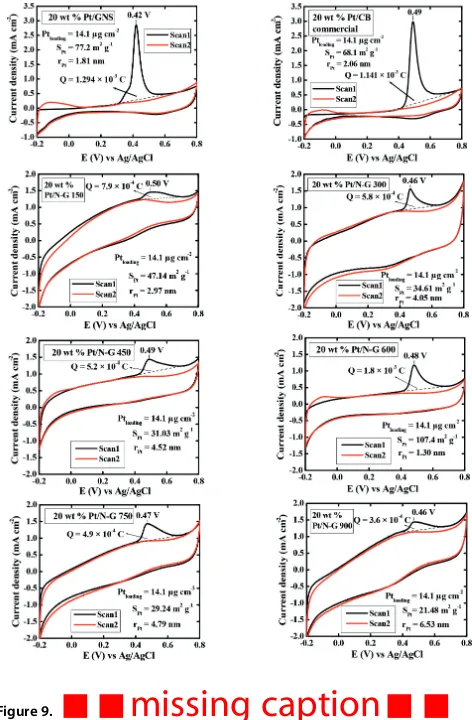
onset potential 0.99 to 0.86–0.95 V versus RHE for Pt/GNS and Pt/N G catalysts, respectively. This is accordance with the lowest oxidation potential peak of 20 wt % Pt/GNS among the Pt/N G 150–900 and Pt/CB commercial catalysts as shown in CO-stripping data (Figure 9). The oxidation potential peaks are
0.42, 0.50, 0.46, 0.49, 0.48, 0.47, 0.46, and 0.49 V versus Ag/AgCl for 20 wt % Pt/GNS, Pt/N G 150–900, and Pt/CB commercial catalysts, respectively. The oxidation potential peaks of Pt/N G 150–900 are slight difference with Pt/CB. In contrast, Pt/GNS oxidation potential peak is significant shifted to lower potentials compared to Pt/N G 150–900, and Pt/CB. These results are also consistent with the threshold voltages of the oxidation peaks (Figure 10). It indicates that Pt/GNS shows the highest catalytic activity among the others. This is because the CO is more readily oxidized on Pt/GNS among those of Pt/N G 150–900 and Pt/CB. It is believed that GNS as a support material plays the most important role in improving CO oxidation.
TEM of Pt/GNS, Pt/ N-G 150–900, and Pt/CB (commercial) catalysts
In order to further know effect of support material and heating temperature in ammonia based on Pt particle size for Pt/GNS, Pt/N G 150–900, and Pt/CB catalysts, we carried out TEM measurements. Figure 11 shows the TEM images with histo-grams of Pt particle size distributions by analyzing random chosen areas containing 600 particles in magnified TEM images for 20 wt % Pt/GNS, Pt/N G 150–900, and Pt/CB commercial catalysts. Notice that the Pt particle size is estimated as<5 nm. The high dispersion of Pt particles on GNS, N G 150–900, and carbon black are clear as shown by TEM images. It is found that Pt subnano-clusters were formed on GNS and N G 150–900. It should be noted that Pt subnano-clusters are not formed on carbon black. Thereby, GNS and N G 150–900 play important role for Pt subnano-clusters formation. The average Pt particle size as a function of heating temperature in ammonia estimated by TEM are shown in Figure 12. It shows that the average size of Pt particle on N-doped graphene is smaller among those of GNS and CB. It indicates that the support material has important role to affect the Pt particle size. In the case of Pt/N G catalysts, the average size of Pt tends to decrease with increasing heating temperature ammonia from 150–6008C for, and then it gradually increases with increasing heating temperature ammonia from 750 and 9008C. It means Pt particle size of Pt/N G catalyst is affected by heating temperature in ammonia.
XRD of Pt/GNS, Pt/ N-G 150–900, and Pt/CB (commercial) catalysts
Figure 13 shows XRD patterns for 20 wt% Pt/N G, Pt/GNS, and Pt/CB commercial catalyst. The 2qBragg angle peaks appear at around 25 and 398which corresponding to C(002) and Pt(111). The C(002) peaks of Pt/GNS and Pt/N G 150–900 catalysts are sharp and broad. The C(002) peaks of Pt/N G catalysts are
Figure 9.
missing caption
slightly shifted to higher 2q Bragg angle (lower lattice parameters) than C(002) peak of Pt/GNS catalysts. It indicates that nitrogen atoms are incorporate in graphene. The Pt(111) peaks of Pt/GNS and Pt/N G 150–900 are relatively smaller in intensity compared to Pt/CB. It suggests that the crystallinity of Pt is smaller than Pt/CB. On the other hand, all of the Pt(111) peaks for Pt/N G and Pt/GNS are weak and broad. The weak
and broad peaks indicate that Pt subnano-clusters were formed.[25]In the case of Pt/N G, the Pt(111) peaks of Pt/N G
150 and 300 are very weak and broad, and then gradually become sharper with increasing heating temperature in ammonia for Pt/N G 450–900. It indicates that the particle sizes are different with heating temperature in ammonia. Therefore, we estimated the Pt particle size by using Scherrer equation.[27]
Figure 11.
missing caption
As shown in Figure 14, the Pt particle size tends to increase with increasing heating temperature in ammonia for 20 wt % Pt/N G 150–900. The Pt particle size is around 2–6 nm for Pt/ N G. However, the Pt particle size is similar with those of Pt/ GNS and Pt/CB for 20 wt % Pt/N G 150 and 300 and the Pt particle size of Pt/N G 450–900 is larger than that of Pt/N G 150 and 300. It indicates that the Pt particle size is affected by heating temperature in ammonia.
XPS of Pt/GNS, Pt/ N-G 150–900, and Pt/CB (commercial) catalysts
The Pt 4 f XPS spectra for 20 wt % Pt/N G 150–900, Pt/GNS, and Pt/CB commercial catalyst are shown in Figure 15. The
binding energy (BE) of Pt/CB is 71.4 eV. It is close to the BE of bulk Pt (71.2 eV).[28]It indicates that interaction between Pt and
CB is weak. In contrast, the BE of Pt/N G and Pt/GNS shift to higher BE than Pt/CB. The BE shifts to higher BE should be related with the Pt electronic state. That is, a strong interaction between Pt and GNS and N G. In the case of 20 wt % Pt/N G, it is found that the Pt 4 f peaks shift to lower BE with increasing heating temperature in ammonia. The Figure 16 shows the tendency of Pt 4 f binding energy with heating temperature in ammonia. It clearly shows that the maxima BE of Pt 4 f (72.0 eV) is shifted to lower BE with increasing heating temperature in ammonia. This is possible due to the Pt particle size effect on NG. The atomic ratio of Pt to C estimated by XPS for 20 wt %
Figure 12.
missing caption
Figure 13.
missing caption
Figure 14.
missing caption
Pt/N G 150–900, Pt/GNS, and Pt/CB commercial catalyst are summarized in Table 1S (Supporting Information). In the case of 20 wt % Pt/N G 150–900, it shows that the atomic ratio of N to C slightly decreases with increasing heating temperature in ammonia. It indicates that the amount of N on N G is affected by heating temperature. However, the atomic ratio of Pt to C is not significant decreasing with increases heating temperature in ammonia.
Conclusions
Nitrogen doping into graphene was carried out by heating GNS in ammonia to produce N-doped graphene (N G). The N G was used as a support material for Pt catalyst as well as a catalyst itself for half-cell cathode reaction of hydrogen fuel cell (H2FC). It is found that the ORR electrocatalytic activity for N G
900 (0.63 V versus RHE) is higher than GNS. It indicates that the incorporation of nitrogen in N G may affect the ORR activities. XPS results exhibit the pyridinic N is the majority in N G, where the pyridinic N refers to N atom bonds with two C atoms at the edges or defects of graphene. Interestingly, the Pt subnano-clusters were formed on all of Pt/N G catalysts with Pt particle size (0.7–1.0 nm). It clearly indicates that the doping of nitrogen significantly influencep–d hybridization in terms of electronic structures.
SUPPORTING INFORMATION SUMMARY PARAGRAPH
The experimental section may be seen in Supporting Informa-tion. It consists of Preparation of graphene, N-graphene, Pt/ GNS and Pt/N-doped graphene catalysts; Electrochemical measurement; TEM images of N-doped Graphene; TG/DTA thermograms of 20 wt % Pt/GNS, Pt/N G 150–900, and Pt/CB commercial catalysts; High resolution of C 1 s XPS spectra for GNS and N G 150–900; and High resolution of N 1 s XPS
spectra for N–G 150–900. Therefore, we may understand well about N-doping on graphene and properties of Pt/N G.
ACKNOWLEDGMENTS
This work was partially supported by the Indonesia Ministry of research technology and higher education. Analysis TEM, XRD and XRF were carried our in Tsukuba University-Japan.
Conflict of Interest
The authors declare no conflict of interest.
Keywords: Graphene nanosheet· N- doped graphene·ORR ·
Pt subnano-clusters
[1] K. S. Novoselov, A. Geim, S. V. Morozov, D. Jiang, Y. Zhang, S. V. Dubonos, I. V. Grigorieva, A. A. Firsov,Science.2004,306, 666–669.
[2] M. D. Stoller, S. Park, Y. Zhu, J. An, R. S. Ruoff,Nano Lett.2008,8, 3498– 3502.
[3] A. A. Balandin, S. Ghosh, W. Bao, I. Calizo, D. Teweldebrhan, F. Miao, C. N. Lau,Nano Lett.2008,8, 902–907.
[4] K. I. Bolotin, K. J. Sikes, Z. Jiang, M. Klima, G. Fudenberg, J. Hone, P. Kim, H. L. Stormer,Solid State Commun.2008,146, 351–355.
[5] C. Lee, X. Wei, J. W. Kysar, J. Hone,Science.2008,321, 385–388. [6] H. Wang, T. Maiyalagan, X. Wang,ACS Catal.2012,2, 781–794. [7] F. Banhart, J. Kotakoski, A. V. Krasheninnikov,ACS Nano2011,5, 26–41. [8] G. Imamura, K. Saiki,J. Phys. Chem. C.2011,115, 10000–10005. [9] L. S. Zhang, X. Q. Liang, W. G. Song, Z. Y. Wu,Phys. Chem. Chem. Phys.
2010,12, 12055–12059.
[10] X. Q. Wang, J. S. Lee, Q. Zhu, J. Liu, Y. Wang, S. Dai,Chem. Mater.2010,
[14] T. Ikeda, M. Boero, S. F. Huang, K. Terakura, M. Oshima, J. Ozaki,J. Phys. Chem. C.2008,112, 14706–14709.
[15] Y. Wang, P. B. Balbuena,J. Phys. Chem. B.2005,109, 14896–14907. [16] C. Wang, M. Waje, X. Wang, J. M. Tang, R. C. Haddon, Y. S. Yan,Nano Lett.
2004,4, 345–348.
[17] L. Zhang, J. Niu, L. Dai, Z. Xia,Langmuir.2012,28, 7542–7550.
[18] A. Kongkanand, S. Kuwabata, G. Girishkumar, P. Kamat,Langmuir.2006,
22, 2392–2396.
[19] L. Yu, X. Pan, X. Gao, P. Hu, X. Bao,J. Catal.2011,282, 183–190. [20] Y. Shao, S. Zhang, R. Kou, X. Wang, C. Wang, S. Dai, V. Viswanathan, J.
Liu, Y. Wang, Y. H. Lin,J. Power Sources.2010,195, 1805–1811.
[21] S. Donthu, M. Cai, M. Ruthkosky, I. Halalay,Chem. Commun.2009, 4203– 4205.
[22] Q. Zhu, S. Zhou, X. Wang, S. Dai,J. Power Sources.2009,193, 495–500. [23] W. S. Hummers, R. E. Offeman,J. Am. Chem. Soc.1958,80, 1339. [24] K. Gong, F. Du, Z. Xia, M. Durstock, L. Dai,Science.2009,323,760–764. [25] X. Li, H. Wang, J. T. Robinson, H. Sanchez, G. Diankov, H. Dai,J. Am.
Chem. Soc.2009,131, 15939–15944.
[26] D. He, K. Cheng, H. Li, T. Peng, F. Xu, S. Mu, M. Pan,Langmuir.2012,28, 3979–3986.
[27] A. Pozio, M. De Francesco, A. Cemmi, F. Cardellini, L. Giorgi,J. Power Sources.2002,105, 13–19.
[28] J. Moulder, W. F. Stickle, P. E. Sobol, K. D. Bomben, Handbook of X-ray Photoelectron Spectroscopy; Perkin Elmer Corporation: Minnesota, USA,
1992; p. 6, 8, 78.
Submitted: October 19, 2016 Accepted: January 10, 2017
Figure 16.
missing caption
FULL PAPERS
It can be seen that the diffusion-limiting currents were obtained in the potential region below 0.4 V versus RHE. The 20 wt % Pt/GNS exhibits the highest ORR activity from its onset potential (0.99 V versus RHE) and half wave potential (E1/2 0.88 V versus RHE) among the other catalysts. In the case of 20 wt % Pt/NG 150–600, the ORR activ-ities tend to decrease with increasing heating temperature in ammonia.
Dr. R. Siburian*, Dr. K. Sebayang*, Dr. M. Supeno, Prof. H. Marpaung
1 – 9