Service system structure
John A. Buzacott
*
Schulich School of Business, York University, Toronto, Ontario M3J 1P3, Canada
Received 22 April 1998; accepted 15 November 1999
Abstract
The structure of a service system should be matched to the requirements of customers. It is necessary to trade o!the ability to handle the variety and complexity of the needs of di!erent customers with the speed and e$ciency of performing the required tasks. This paper develops a categorization of service system structures based on an analysis of their relative performance and how this performance is a!ected by the nature of the tasks that have to be performed. The categorization has the same property as the Hayes}Wheelwright categorization of manufacturing systems in that"rms should aim at being near the diagonal of the matrix relating customer requirements and structural alternatives. The service system categorization also provides useful insight into the organization of manufacturing"rms. ( 2000 Elsevier Science B.V. All rights reserved.
Keywords: Service systems; Structure; Hierarchies; Requisite variety
1. Introduction
In developing and managing a service operation one of the critical decision areas is how to structure operations, i.e., how to divide up the tasks and assign them to people or machines. While there could be constraints of various types that restrict the set of available choices, there is usually con-siderable discretion. As compared to manufactur-ing operations, constraints which require a speci"c machine or type of machine to perform the task are usually less prevalent, so the range of choice is usually larger. Furthermore, there may be fewer constraints on the sequence in which operations are performed. Another key di!erence to manufactur-ing is that service operations are very frequently
*Fax: 416-7365-687.
E-mail address:[email protected] (J.A. Buzacott).
in direct contact with the customer. Given these di!erences, the ideas developed to understand how to divide up the tasks in manufacturing can rarely be applied to service operations without consider-able adaptation.
Given a particular service situation, it would be desirable to establish some general guidelines on what sort of structure is likely to be most appropri-ate. So the goal of this paper is to develop a frame-work for thinking about the appropriate structure for a service system. Such a framework should help managers describe, diagnose, improve and design service operations. The framework should help managers in understanding the broad options that are available to them. Desirably it gives them a mental model of what is involved in making decisions about structure and what the feasible alternatives are likely to be. Also, given a particular service operation, the framework should be such that it helps managers diagnose the reasons behind
their experience of the e!ectiveness of the opera-tion. It should be a guide for improving the system and suggest issues to look at more closely in order to make a particular structure perform e!ectively. It should identify those aspects of the operations that must be changed in order to make their selected structure appropriate. Lastly the frame-work should help designers choose the best struc-ture for the system.
2. Methods of classifying service systems
There have been a variety of taxonomies pro-posed for classifying service systems. An excellent overview is contained in [1]. They describe one, two and three-dimensional approaches. For one dimension they describe the classi"cation due to Chase [2] based on the extent of customer contact in service creation, while for two dimensions they describe the following:
f degree of tangibility vs. degree of technology,
f degree of tangibility vs. extent to which service provided to people or their possessions [3], f degree of customization vs. extent to which
ser-vice providers exercise judgement [3],
f customers either dominate or are dominating vs. participation is either active or passive.
Note that none of the above taxonomies directly relate to the structure of the service process.
Shostak [4] proposed a taxonomy that does consider the service process. She uses the two dimensions: degree of complexity of the service delivery structure, and the degree of divergence allowed at each process step. Another taxonomy that considers the service process is due to Wem-merlov [5]. He proposes using the two dimensions: degree of divergence (standardized or customized service) and degree of customer contact (none, in-direct, direct-no customer service worker interac-tion, direct-customer/service worker interaction). Another approach is the service design matrix of Chase and Aquilano [6] that relates sales oppor-tunity and production e$ciency to service delivery options, where service delivery options are ranked in terms of the richness of information transfer. Production e$ciency typically declines as the
rich-ness of information transfer increases, but on the other hand sales opportunity increases. This matrix enables production and marketing aspects to be traded o!.
The best-known classi"cation of service situ-ations is probably that due to Schmenner [7]. Schmenner uses the two dimensions: degree of labor intensity and degree of customization or interaction. Within this he categorizes service situ-ations into the four types: mass service (high labor intensity, low customization), service factories (low labor intensity, low customization), service shops (low labor intensity, high customization) and professional services (high labor intensity, high customization).
Another classi"cation that has begun to attract interest is that due to Silvestro et al. [8]. Their classi"cation has the two dimensions: number of customers processed per day and a factor related to balance between people and equipment, contact time, customization, discretion, front o$ce/back
o$ce balance, and relative emphasis on process
versus product. With this categorization they use empirical evidence to suggest that "rms typically cluster near the diagonal. Professional service"rms have low customers per day and high scores on the factor (e.g., high contact time, etc.), service shops are at a medium level on both dimensions and mass service has a high daily volume and a low score on the factor (i.e., low customization, etc.).
While all these taxonomies can provide useful insights on the issues to be considered in designing service systems, most of them do not have any underlying theory to justify the relevance and appropriateness of the classi"cation. While di! er-ent service processes are placed at di!erent points in the two-dimensional classi"cation, the classi" ca-tion provides no basis for saying whether one position is`betterathan another or whether a par-ticular position for a given"rm is indeed the appro-priate position given the processes used. The major exception is perhaps Chase's service design matrix where it is possible to begin to construct an argu-ment based on the amount and cost of information processing.
dimensions, product or market variety, ranging from high to low, and type of production system, ranging from job shop, through batch production,
#ow line to continuous process. In general, the
Hayes}Wheelwright model recommends that"rms position their choice of process so that it is near the diagonal. The Hayes Wheelwright model is sup-ported by evidence from "eld studies such as of Woodward [10] on the choice of process and the resulting performance of actual"rms. The Hayes-Wheelwright model also indicates how a "rm's production process must evolve over the life cycle of its products.
What seems to be lacking in services is a taxon-omy that is both descriptive and prescriptive in the
way that the Hayes}Wheelwright taxonomy is for
manufacturing. The purpose of this paper is to propose such a taxonomy for services. The basis for the taxonomy is a consideration of how di!erent structures are able to cope with variability and disturbances. Disturbances or variability can arise
either outside or inside the system. External
variabilitycan arise because it is not known what individual customers will want from the service providers until they are actually being served. Fur-ther, there can be changes in the level of demand, the requirements of di!erent customers, the timing of demands, or the mix of demands.Internal varia-bility can arise due to the nature of the tasks. As the cognitive demands of the task increase there can be increasing variability in the time to perform the task. But internal variability can also arise because of breakdowns of equipment, planned or unplanned absences of service personnel, and inad-equate training of people.
The service design problem is to develop a sys-tem that enables customers'demands to be met in an e!ective way. It is clear that as the complexity of the demands of customers increases, the complexity with which the service processes have to cope will increase. That is, the design of the system has to
conform to Ashby's law [11]: only variety can
destroy variety. In other words, the service system has to be capable of coping with the range and complexity of customer requirements and the un-certainty about the timing and level of customer demands. Also, the service system has to be tolerant of its internal variability and uncertainty. So the
approach used in this paper is to look at the match between the variability in demands from customers and the inherent capability in variability handling of the way in which the processes that meet cus-tomer demands are structured.
A system that is structured to provide e!ective handling of high levels of variability is likely to be inherently less e$cient and more costly than a sys-tem that only has to cope with limited variability. So it is always necessary to make tradeo!s in sys-tem design between the e!ectiveness in coping with variability and the e$ciency, speed and cost of providing the service. Di!erent service providers can make di!erent choices of where to operate and their choice will in#uence their market share and attractiveness to customers. However, it is likely that certain choices are likely to survive in the market better than others.
3. Structuring processes
In order to meet the demands of a given cus-tomer for service certain tasks will have to be per-formed. Not all these tasks may be evident before the customer arrives; indeed some of them will only become apparent as the service process proceeds. For example, diagnosis of the needed repairs on a piece of equipment is necessary before the actual repair can be carried out, and even after the initial diagnosis and repair have been performed other problems might surface which require further tasks to be done. So the service process might have to recognize such possibilities and it should be struc-tured appropriately to deal with such situations. Rather than providing the internal capability to deal with variation, the service process can also be designed and marketed to exclude customers whose needs do not "t within a given envelope. For
example, Starbucks Co!ee shops makes it well
dimension there are two aspects that need to be considered. The "rst is the range of customer de-mands with which the system is designed to cope, and the second is the extent to which the processing requirements of a given customer are known at the time when they make their initial contact with the service provider. The second aspect becomes increasingly important as the range of customer demands increases. When all customers require identical service then the requirements of the system design are less complex.
Given the nature of the customer demand and requirements and hence the tasks that might be required then an appropriate structure will have to be chosen for the service system. Two possible approaches can be used, one is to start with the desired attributes of the individual jobs, and another is to start with the overall pattern of rela-tionships that de"nes the structure of the system. It is useful to begin by discussing the options avail-able for individual jobs, and then look at the overall patterns that these options imply.
The relevant aspects of individual jobs are per-haps best described using the approach suggested by Rolfe [12]. She uses two attributes: technical complexity and discretion/prescription. Technical complexity means the complexity of the proced-ures, the knowledge required, and the number of steps or range and variety of tasks. Discretion re-lates to the judgement that the individual must exercise. This will be determined by the degree of uncertainty and the prescribed range over which discretion can be exercised.
If no discretion is required, i.e., tasks to be done are the same for all customers, then jobs could be designed to have either a low technical complexity or a high technical complexity. Achieving a low technical complexity will require giving each worker a small number of tasks. This in turn im-plies that a number of workers will be needed in order to perform all the tasks required by a given customer, and one possible way of structuring the system consistent with this is as a#ow line or series system. If jobs can have a high technical complexity then it might be possible to give to a worker the responsibility of doing all tasks required by a cus-tomer. This would then result in the system having a parallel structure with any of the workers capable
of doing all tasks for a customer and each cus-tomer's service being provided by only one worker.
Di!erent customers would deal with di!erent
workers.
If di!erent customers have di!erent
require-ments, and so di!erent customers would require
di!erent tasks, then the system has to be structured to deal with this. One approach is to o!er cus-tomers a menu so they choose the menu items that are closest to their needs. Each menu item de"nes a set of tasks that must be performed in order to deliver the service. The service provider is not called upon to decide what service to deliver to the customer, the choice of the item from the menu determines the service. Di!erent ways of designing the jobs are then possible.
(i) Specialization: One possibility is to have a worker specialize on the set of tasks required for a speci"c menu item so there would be di!erent workers for di!erent menu items. The worker is not then called upon to exercise any signi"cant discre-tion.
(ii) Parallel: Another possibility is to have any worker able to do all tasks for any customer, i.e., a parallel structure. This then requires the worker to exercise su$cient discretion to relate the cus-tomer's menu choice to the appropriate set of tasks. (iii) Series: If the di!erent menu items require essentially the same types of steps, although the speci"c details di!er between di!erent menu items, then a series structure can be used with multiple workers required in order to perform all required tasks for a given customer. Again each worker has to exercise su$cient discretion to do the tasks appropriate for the customer's menu choice.
Note that as well as greater discretion, parallel would require greater technical complexity than the specialized structure.
both alternatives there would be substantial tech-nical complexity and signi"cant discretion in the worker's tasks.
Because of the complexity of general purpose approaches, it might be desirable to simplify the set of tasks required of a worker. This can be done in several ways. One is to separate diagnosis from the tasks consequent on the diagnosis so a worker either does just diagnosis or just the tasks conse-quent on a particular diagnosis. Indeed, the com-plexity of diagnosis might be such that diagnosis
tasks are allocated to a number of di!erent
workers. This means that the diagnosis performed by a given worker sometimes simpli"es to making one choice out of a very small range of possible choices. Often, diagnosis proceeds hierarchically (or as a sieve) with the"rst worker performing some tests, and, if they do not identify the action required, then a second worker would perform more tests. The complexity of the diagnosis can either increase with successive steps or decrease with successive steps. If it increases, then the result-ing structure isbottom-up, while if it decreases then it istop-down.
As an example, suppose a customer wants to trade a convertible debenture through a telephone discount brokerage. First they will speak to an agent who will verify identity and"nd out what the customer wants. They will then be transferred to a representative who will recognize, unlike shares, that the debenture cannot be traded on the com-puter system. Lastly they, or the representative, will speak to the bond desk who will carry out the trade. On the other hand, if the same customer wants to do the same trade with a full service broker, the customer will speak to their broker, discuss the trade, and the broker will then probably arrange the trade and call the customer back when it is complete. The discount broker is using a bot-tom-up diagnosis structure while the full service broker is using a top-down structure.
There is a further aspect involved in comparing top-down and bottom-up hierarchies. The bot-tom-up structure has to be established prior to the arrival of a customer. It requires rules to be set up in advance limiting the discretion available at each diagnostic step. However, for top-down hierarchies, there is no essential need to de"ne in advance how
each customer requirements are to be met. Part of the role of the customer's initial contact (the top of the hierarchy) is to de"ne the process steps required by the customer and assign them to workers. So clearly this structure will be the one most capable of responding to variety in customer needs.
4. Models for comparing alternative systems
It is necessary to rank the alternative structures in terms of their ability to respond to variety. In a menu system, it is fairly clear that the specialized system has the greatest tolerance for variety. But it is possible to develop simple mathematical models that provide insight into the relative capability of the di!erent structural alternatives. These models are described elsewhere in detail [13] but it is useful to summarize their main results so that the implica-tions can be shown.
4.1. Basis of comparison
In comparing alternative systems it will be as-sumed that customers or jobs arrive according to a stationary process. The mean arrival rate is de-noted byjand the squared coe$cient of variation of the time between arrivals isC2!.
The performance measure that will be used is the average time required for providing service to a customer, or, equivalently, using Little's law, the average number of jobs or customers in process (WIP). Given WIP, it would also be possible to determine the costs incurred in providing service and compare systems on the basis of cost. Rather than using costs, comparisons between systems will be made assuming that all systems use the same number of workers or facilities. The di!erences between system structures arise from the way in which tasks are assigned to the workers.
4.2. Seriesvs. parallel
Suppose that when the work is organized in series there aremworkers and each worker has the
same amount of work. Let qbe the average time
of variation (scv) of this time. Now compare this with the parallel system withmworkers in parallel each of whom does all the required tasks for a given customer. Assuming that there is no loss of perfor-mance if a worker does all the required tasks, then the time a worker requires to do all the tasks will have meanmqand squared coe$cient of variation
C2S/m. Now when customers arrive at a ratejwith the squared coe$cient of variation of time between arrivals beingC2!, then they will have to queue for service at each worker. In the parallel case assume that the customers are allocated to workers at random. This means that the mean arrival rate at
a worker is j/m and the squared coe$cient of
variation of the interarrival time is
1!1/m#C2!/m. Using the queueing approxima-tions described in the appendix for the condition that the utilization of a workero"jq"(j/m)(mq) is close to 1, it can be shown that the total number of customers in process is given by the following formulae:
It is then easy to show that the WIP will be less for series if C2S(1/2. For other values of o it is possible to show that the requirement for series to be better than parallel is that both C2! andC2S be
small, e.g., for o small the condition becomes
C2!#C2
S(1. Series is only appropriate if there is very little variability in the time required by a worker to perform the required tasks and the variability of the time between arrivals is also fairly small.
Performance of parallel systems can be improved by using other rules to allocate customers to ser-vers. For example, allocating them cyclically: cus-tomer 1 to server 1, cuscus-tomer 2 to server 2, customer 3 to server 1, etc. will ensure that the parallel system is always better than the series sys-tem. But such an allocation requires resources to be used for such a control. Alternatively, if there is a single queue and if the customer at the head of the
queue goes to the next free server then the perfor-mance of the parallel system is further improved.
4.3. Parallelvs. specialized
A specialized system is only meaningful once di!erent customers require di!erent service. Sup-pose there are two types of customers. Letf
1be the
fraction of type 1 and f
2 the fraction of type 2
(f
1#f2"1) and let the total arrival rate of all customers bej. Assume for simplicity that arrivals are Poisson. Suppose the time to serve a type 1
customer has mean q
1 while the time to serve a type 2 customer has meanq
2. Suppose the squared coe$cient of variation of service time is the same for both types and equalsC2S. Then in the special-ized case, one server will be dedicated to type 1 while the other server will be dedicated to type 2.
The utilization of the type 1 server o
1"jf1q1, while the type 2 server will have utilization given by o
2"jf2q2. Then the queue length at server
i,i"1, 2, is given by
2(1!o
i)WIPi"o2i(1#C2S).
In the parallel case there are two parallel servers that serve either type of customer and work is allocated to the two servers so that their utilization is identical, i.e.o"(o
1#o2)/2.
The variance of the service time of an arbitrary customer will be given by
varS"(f
1q21#f2q22)C2S#f1f2(q1!q2)2.
It is then possible to determine the queue length as a function of the rule used for allocating customers to the parallel servers. To simplify the illustration,
assume o
1"o2"o, i.e., f1q1"f2q2. Then the
total WIP with specialized servers is
o2(1#C2
S)/(1!o). If customers are assigned to the parallel servers at random then the total WIP will be given by
(1!o)WIP
PAR"o2(1#(C2S#(f1!f2)2/4f1f2)). Note that the specialized system and the parallel
system have the same performance whenf
show that the parallel system will be better than specialized whenf
1is neither close to zero or one, i.e., whenq
1andq2are not too dissimilar. That is, parallel systems can, with fairly minimal control, outperform the specialized system when the service requirements of the di!erent customer types are not too di!erent.
4.4. Specializedvs. hierarchical
It is clear that the performance of a specialized system would deteriorate if the di!erent types of customers have di$culties in identifying the server appropriate to their needs. If the allocation of cus-tomers to servers is incorrect a server will end up having to serve a mix of di!erent types of cus-tomers. As the allocation errors increase, the spe-cialized servers would end up with a mix of work comparable to that which they would have if a parallel allocation were used.
There are several possible approaches to deal with this depending on how di$cult it is for a server to identify what service a customer requires. If diagnosis requires essentially zero time ( instan-taneous diagnosis) then one approach is to haveall
customers queue in front of servers specialized to short duration service. As soon as the customer reaches a server and the server identi"es that they require long service then they are immediately diverted to a server specialized to long duration service. If, however, the diagnosis requires a "nite time, then one server will specialize in diagnosis and allocate customers to either a server specialized to short duration service or to a server specialized to long duration service as appropriate (separate diagnosis).
4.4.1. Instantaneous diagnosis
The simplest case is that where there are two servers. Suppose short service requires a time
S
S while long service requires a time SL and the fraction of jobs requiring short service and long service is f
S and fL respectively (fS#fL"1). As-sume that the squared coe$cient of variation of short- and long-duration services is the same and equalsC2S. Also assume that the squared coe$cient of varation of arrivals to the system isC2!. Suppose the work load on the two servers is balanced so
f
LE[SL]"fSE[SS]. Then the service time at the
"rst server, the short-duration server, will consist of a mixture of zero duration services corresponding to the identi"cation of long duration service requirements and short duration services. Hence
C2SS, the squared coe$cient of variation of service at the short duration server will be given by
C2SS"(f
L#C2S)/fS.
At high tra$c the scv of departures from this server will beC2SSand a fractionf
Lwill be diverted to the long duration server. Using the results in the appendix for the splitting of customer streams the scv of arrivals at the long-duration server will be
given by 1!f
L#fLC2SS"(fS2#fL2#fLC2S)/fS. Hence, asoP1 the total queue length in the system will be given by to have the short duration server do the instan-taneous diagnosis. Also note that asf
Lincreases the queue length increases, i.e., it is least whenf
L"0. Now compare with two parallel servers who do both short and long services. In this caseC2SP, the scv of the service time at a server, will be given by
C2SP"M(f
S!fL)2#C2SN/4fSfL.
Assuming cyclic allocation of arriving jobs to ser-vers the total queue length asoP1 will be given by
2(1!o)WIP
PAR"C2!#2((fS!fL)2#C2S)/4fSfL. It can be seen that this will decrease asf
Lincreases from 0 to12. Forf
L less than about 0.2, the system with two parallel servers will be worse than the system with specialized servers and instantaneous diagnosis.
4.4.2. Separate diagnosis
For simplicity assume that there are three ser-vers. All customers require diagnosis which takes a time of d. A fraction f
L require long service of durations
L, while the remaining fractionfSrequire short-duration service of durations
S. Assume that these service times are deterministic and that
d"f
will be identical and equal to o. Then the scv of arrivals at the short-duration server will bef
L, while the scv of arrivals at the long-duration server will bef
S. Hence it follows that the total queue length in the system asoP1 will be given by
2(1!o)WIP
SD"C2!#1.
Now, in the alternative parallel system consisting of three servers, all service, including diagnosis, is undertaken by the same server. SoC2SP, the scv of the service time will be given by
C2SP"f
SfL((sL#d)!(sS#d))2/(d#fSsS#fLsL)2, which simpli"es to C2SP"(f
S!fL)2/(9fSfL). Hence it follows that if customers are assigned to the parallel servers cyclically that the arrangement with
separate diagnosis will be better if
(f
SBoth models can be modi!fL)2'3fSfL, i.e., iffL("0.173, ored to re#sect diL/sS'!erent4.73. relative utilization of the specialized servers. The general conclusion from both modes of diagnosis is that as the di!erence in the service times of the di!erent customer types increases the attractiveness of diagnosis and separation of the customer types increases.
4.5. Top-downvs. bottom-up diagnosis
As the complexity of diagnosis and the asso-ciated service increases it is necessary to consider how to structure the system. Typically, the process of diagnosis can be considered to involve a se-quence of tests. One server can perform all tests, or it may be split between a number of servers. If it is split, then the task of each server is simpler, and so they do not need to have the same level of skill as in the situation where all steps in the sequence are carried out by one server. If the tests performed by one server are simple, then it is often the case that for certain outcomes of the test the server will also carry out a service task, while for other outcomes the job will be passed on to another server for
further diagnosis and service. By `bottom-upa
diagnosis is meant the situation where the diag-nosis steps are split among a number of servers, with typically each step becoming more complex, while by`top-downais meant the situation where one server can do all diagnostic steps.
Suppose there are three possible outcomes of the diagnostic tests, outcomes 1, 2, 3, and outcome
iwill require a service of typei, performed by server
i. There are two tests that can be sequenced so that test 1 has two possible outcomes, service of type 1 is required or test 2 is required. Test 2 has the two outcomes, service of type 2 is required or service of type 3 is required. Then compare the two di!erent structures, `bottom-upa where there are two test servers, one specializing in the"rst test, the other specializing in the second test, and `top-downa where there are two test servers, each of which does both tests. Suppose that the time to perform the
"rst test isD
1, the time to perform the second test is
D
2, and the probability that the second test is needed isp. Assume that in the`bottom-upa alter-native the two test servers are equally loaded, i.e.,
E[D
1]"pE[D2], and assume that in the ` top-downaalternative arriving customers are allocated cyclically to the two test servers. This means that the utilization of all test servers in both alternatives will be identical and equal too. Suppose that the
scv of D
1 is the same as the scv of D2, i.e., var
D
1/D21"varD2/D22"C2S. Letp@be the probability that the second test reveals that service of type 2 is required and for simplicity assume that the various types of service are deterministic and result in the utilization of the servers all being equal to o. Let
C2! be the scv of arrivals at the system.
Bottom-up: With bottom-up the scv of the service time at either test server will be C2S. Arrivals at server 1 will have scv of 1!(1!p)#(1!p)C2S, arrivals at the second test server will have scv of 1!p#pC2
S, arrivals at server 2 have scv of
1!p@#p@C2
S, and arrivals at server 3 have scv of 1!(1!p@)#(1!p@)C2
S. Note that the total of the scv's of arrivals at all servers is thenC2!#2#2C2
S. Then the total queue length in the system asoP1, will be given by
2(1!o)WIP
B"C2!#2#4C2S.
Top-down: The scv of the service time at one of the parallel test serversC2P will be given by
C2P"M((E[D
1])2#p(E[D2])2)C2S #p(1!p)(E[D
The scv of the stream of customers going from one
test server to server 1 will be 1!(1!p)#
(1!p)C2P, while to server 2 it will be 1!p(1!p@)#
p(1!p@)C2P and to server 3 it will be
1!pp@#pp@C2P. Assuming that when the streams from the two test servers merge the asymptotic results for merging streams can be used, the arrivals at server 1 will have the same scv as the stream coming from a given server. It follows that the total queue length in this system asoP1 will be given by
2(1!o)WIP
T"C2!#2CP2#2#2C2P.
Comparison: It follows that WIP
T(WIPS if
C2P(C2S. This condition reduces to 1/p!1( C2S(3!1/p).
That is, if p(1
3 it is impossible for
WIP
T(WIPS while for p'13 the critical C2S de-creases, so when p"1, the criticalC2S"0. When
p"1
2, then the critical C2S"1. Typically a high
C2S is associated with complex decision making, so the conclusion is that `top-downa is preferable when it is likely that both test steps will be needed
and when decision making is complex. `
Bottom-upais preferable when one test can usually verify the problem, or when decision making is relatively simple.
It is possible to construct other models of this comparison. For example compare a situation where in`bottom-upathe service of typei,i"1, 2, is carried out in conjunction with the test step, while in `top-downathere are two servers, one of which does both test steps and the other does both services of types 1 and 2. Again, it is found that if a single test step is usually enough`bottom-upais better, but if most customers require both test steps then`top-downais better. For example, equipment repair usually uses a`bottom-upastructure. Many sources of failures are easy to identify and easy to
"x, so can be done by less skilled people. They will then pass on the harder to "nd and harder to"x problems to more skilled people. By contrast, professional services such as law tend to use a `top-downastructure where a customer sees a sen-ior lawyer "rst. There are usually many possible diagnoses that the senior lawyer considers. Once diagnosis has been made then the investigation and preparation of documents and briefs can be passed on to a junior.
5. Tradeo4s and diagonals
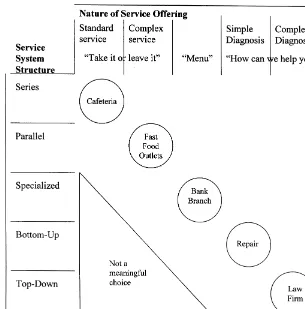
The insights from the above models enable the development of a matrix to describe the structure of service processes. The matrix has two dimensions (see Fig. 1). The"rst describes the variability and complexity of the tasks that have to be done in order to meet customer requirements. This plexity is determined by the two aspects, the com-plexity of diagnosis, and the variability of the actual service task. The second dimension relates to how the system is structured in order to cope with this complexity and variability. The simplest structures are those where all customers are treated in the same way, so essentially no diagnosis is needed and the service facilities or people have simple tasks, i.e., the service system has a series structure. Next, in order of complexity are those structures which also treat all customers the same way, but, because of the variability associated with individual tasks or the arrival of customers, it is preferable to use a parallel structure for the service system. The next step in complexity of structure occurs when the di!erences in service required by di!erent customer types becomes substantial, but it is easy for cus-tomers to recognize what type of service they need and choose the appropriate server. Facilities then specialize by customer type, and the time required for diagnosis is minimal. The next level of structural complexity arises when customers can no longer determine the type of service they need and the di!erences in service requirements between di! er-ent diagnoses become signi"cant enough that service delivery requires specialization. If diagnosis and service are usually simple and relatively rarely is more complex diagnosis and service required then bottom-up structures are appropriate. If, how-ever, many customers require most diagnostic steps, then a top-down structure is preferable.
Fig. 1. Classi"cation of service system structures.
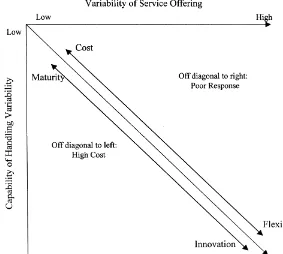
a service is "rst recognized it is likely to be struc-tured so that it is well down the diagonal, i.e., a complex structure is chosen for service delivery. With time (and increases in demand, simpli"cation of processes and education of customers) move-ment up the diagonal will occur (see Fig. 2).
5.1. Examples of placement of processes
To illustrate the placement of typical processes on the matrix consider the following examples.
Law ozce: Typically a top-down structure, how-ever, some of the store front law o$ces advertizing a small range of functions such as wills and property conveyancing are moving to a bottom-up structure.
Repair hotline: Computer hardware and software manufacturers typically use a bottom-up structure.
Many customer problems are frequent and can be dealt with by front-line agents with fairly limited breadth of training. More complex problems can be then passed on to technical specialists. The increasing use of voice response systems so that customers can do some self diagnosis of the problem (and at least separate out customers according to product line) indicates a movement towards a system with customer self diagnosis and specialization.
Fig. 2. Impact of choice of structure.
training needed to do this. This represents a move-ment towards parallel structures, enabled by the computer technology that simpli"es the task of selling CDs.
Fast food outlets: The typical way of organizing fast food outlets is McDonalds with parallel
gen-eral purpose queues. Given di!erent customers
vary in the complexity (and number of items) of their order, such a structure seems appropriate. However, some fast food outlets have moved towards more of a series structure with a single initial queue and several subsequent queues in series. This results in separation of the order taking task from the task of delivering the order to the customer and the task of getting drinks (indeed in some this task is transferred to the customer). Such structures seem to be more com-mon when orders are made up for each customer (rather than having a stock of product ready to dispense). Probably this means that the time re-quired for individual order preparation shows little variability.
6. Conclusions
6.1. Use for diagnosis and design
It is clear from the examples that the classi" ca-tion can be used for diagnosis and design. It sug-gests directions for improving processes, e.g., through using information technology to reduce task variability and hence permitting movement up the diagonal. It also suggests directions in which certain processes might evolve. For example, inter-net tools might enable signi"cant levels of self diag-nosis of health problems by patients, and hence a move of the medical system from its current predominately bottom-up structure to a system with specialized facilities selected by patients (rather than by referral by primary care doctors).
6.2. Implications for manufacturing
Generally in manufacturing the control activities are structured hierarchically, with the long-time horizon decisions made by people at the top of the hierarchy and the short-time horizon decisions made by people at the bottom of the hierarchy. The manufacturing process can be viewed as the ` cus-tomerawhose problems create demands for service by the control system. From this perspective it can be seen that if short-time horizon decisions are also quick to deal with or`servea, then manufacturing control is characterized by a `bottom-upa struc-ture. Increasing automation of control can be viewed as a movement towards a specialized struc-ture. But this could mean that the people involved in control are only left with di$cult and complex decisions for which a `top-downa structure might be more appropriate. This probably implies `#ata organizations and enhanced knowledge required by those involved in control.
Another set of tasks most manufacturing "rms have to deal with are those related to selling the product to its external customers. A `bottom-upa structure is appropriate if most orders are reason-ably standard so can be taken and dealt with by an order desk or professional sales sta!. A`top-downa structure (involving top management in the sales negotiation process) is appropriate if each product sold is fairly unique so there is a fair bit of discre-tion and a wide prescribed range covering the pos-sible products that can be made. The`diagnosisaof the best way of meeting a customer's requirements is then complex, and so the`top-downastructure is appropriate. Clearly, if a "rm makes a signi"cant number of`specialsa(involving a higher level of ex-pertize in sales and application engineering) as well as standard products (involving an order desk and a catalogue) then it is going to have problems in dealing with either e$ciently. Such a situation is likely to be best resolved by segregation or specialization.
It is of interest to note that the "rm's control structure has to deal with at least two types of `customersa, the external customers to whom it sells products, and the production processes that generate demands for service. Clearly, if the nature of the tasks are similar in duration at the points which these two control systems share in common, or if they can be segregated, then control will be easier. For example, if both use a bottom-up
struc-ture with the same individual at the top of both hierarchies then this individual will have similar duration tasks from both sources. This would be typical of consumer product"rms that use assem-bly lines to make the product. Both the sales and production control would be able to use a bottom up structure with top management at the top of both structures. It is clear that complexity of con-trol (and probably diminished performance) will occur if an individual's role in the two control systems results in the tasks for one control system being signi"cantly di!erent in duration to the tasks in the other. Another example would be a small
"rm making customized products using a job shop manufacturing organization might use a top-down structure for both production control and sales.
Acknowledgements
This research was supported by the Natural Sciences and Engineering Research Council of Canada under grant OGP 0138270.
Appendix A. Queuing approximations
The following results from queueing theory are used as the building blocks for analyzing the di! er-ent con"gurations.
A.1. Queue length and waiting time
Because there is no exact formula for the queue length or waiting time in a queue with general interarrival times and general service times (the G/G/1 queue) it is necessary to use an approxima-tion. Suppose that the arrival rate of customers is jand the squared coe$cient of variation of interar-rival times is C2!, while the service time has mean
sand squared coe$cient of variationC2S. Then the utilization of the server is o"js. Under heavy tra$c, i.e., asoP1, an appropriate approximation
for the mean queue length E[¸] is that due to
Harrison and Nguyen [15]:
lim
o?1
Because the server utilization is close to 1, the
squared coe$cient of variation of departures
C2$ will be equal toC2S.
A.2. Splitting and merging(see[14])
Consider a stream of customers where the time
between customers has mean 1/j and squared
coe$cient of variation C2. Then if customers are selected from the stream with probability p, then the time between selected customers will have mean 1/(pj) and squared coe$cient of variation 1!p#pC2.
Suppose there are two streams of customers such
that the time between customers have means 1/j1
and 1/j2 and squared coe$cient of variation
C21 and C22, respectively. Then if the streams are merged the mean time between customers in the merged stream is 1/j, with j"j
1#j2, and the squared coe$cient of variation,C
2, can be approxi-mated by
jC2"j
1C21#j2C22
References
[1] J. Haywood Farmer, J. Nollet, Services Plus: E!ective Services Management, Morin, Montreal, 1991.
[2] R.B. Chase, Where does the customer "t in a service operation? Harvard Business Review 56 (6) (1978) 137}142.
[3] C.H. Lovelock, Classifying services to gain strategic marketing insights, Journal of Marketing 47 (3) (1983) 9}20.
[4] G.L. Shostak, Service positioning through structural change, Journal of Marketing 51 (1) (1987) 34}43. [5] U. Wemmerlov, A taxonomy for service processes and its
implications for systems design, International Journal of Services Industry Management 1 (3) (1990) 13}27. [6] R.B. Chase, N.J. Aquilano, Production and operations
management: A life cycle approach, R.D. Irwin, Home-wood Il, 1992.
[7] R.W. Schmenner, How can services businesses survive and prosper? Sloan Management Review 27 (3) (1986) 21}32.
[8] R. Silvestro, L. Fitzgerald, R. Johnston, C. Voss, Towards a classi"cation of service processes, International Journal of Service Industry Management 3 (3) (1992) 62}75. [9] R.H. Hayes, S.C. Wheelwright, Link manufacturing
processes and product life cycles, Harvard Business Re-view 57 (1) (1979) 133}140.
[10] J. Woodward, Industrial organization: Theory and prac-tice, Oxford University Press, London, 1965.
[11] W.R. Ashby, An introduction to cybernetics, Chapman & Hall, London, 1956.
[12] H. Rolfe, In the name of progress? Skill and attitudes towards technological change, New Technology, Work and Employment 5 (2) (1990) 107}121.
[13] J.A. Buzacott, Commonalities in reengineered business processes: Models and issues, Management Science 42 (5) (1996) 768}782.
[14] J.A. Buzacott, J.G. Shanthikumar, Stochastic models of manufacturing systems, Prentice-Hall, Englewood Cli!s, NJ, 1993.