REFERENCE
1. BOYDAK, M. 1977. Eskisehir-Catacik Mintikasi Ormanlannda Sancarn (Pinus syl-vestris L.)'in Tohum Verimi Uzerine Arastinnalar. I.U. Onnan Fakultesi Yaym No: 230. Istanbul.
2. EREL, M. 1967. Oman Agaci Tohumlan. O.G.M. TeknikHaberler Bulteni Sayi 23. Eyiul. 3. JNRA, (1981). Le Metre. Paris.
4. MATHEWS, J.D. 1967. a) Orman Agaclanmn Tohum Verimini Etkileyen Faktorler. Or. Muh. Dergisi. Sayi: 10.
5. MATHEWS, J.D. 1967. b) Orman Agaclanmn Tohum Verimini Etkileyen Faktorler. Or. Muh. Dergisi.Sayi:12
6. MESCH1NTEV, V. G. 1984. Fructification of beech in reserved forest of the Crimea State University of Simferopol.
7. OSWALD, H. 1981. Le Hetre, Regeneration Naturelle Page 207-216. INRA. Paris. 8. SAATCIOGLU, F. 1970. Belgrad Ormanında Kayının Buyfik Maktali Siper Me-todu ile Tabii Olarak Genclestirilmesi Uzerine Arastirmalar. I.U. Or. Fak. Der. Seri A. Sayi 2.
9. SUNER, A. 1982. Duzce, Cide Ve Akkus Mmtikalannda Saf Dogu Kayim Mescerel- erinin Dogal Genclestirme Sorunlan Uzerine Arastinnalar. 0. A. E. Teknik Bui. Serisi-No: 107. ANKARA
10. TACON, F., L-LOUARN, H-ENGLER, J. M. 1982. Kaymm Dogal Yolla Gen-clestirilmesinde
11. Kuslann ve Kemiricilerin Etkileri. 0. A. E. Dergisi. No: 107. ANFCARA.
12. TOSUN, S., GULCAN, E. 1985. Dogu Kaymimn Yapay Yolla Genclestirilmesi Olanaklan Uzerine Arastinnalar. Or. Aras. Ens. Teknik Bui. No: 133.
13. TOSUN, S. 1986. Dogu Kaymmda Cicek-Meyve Diskisi ve Pratik Bir Gozlem Oner-isi. Or. Aras. Ens.Dergisi. Sayi: 2.
STATISTICAL QUALITY CONTROL IN FOREST PRODUCT INDUSTRY: A CASE STUDY
Alper AYTEKIN, Selman KARAYILMAZLAR, Erdogan G AVCAR, Sukru OZSAHIN
Zonguldak Karaelmas University, Faculty of Forestry, BARTIN, TURKIYE; Mugla Uni-versity, Faculty of Business and Administration, MUGLA, TURKIYE Introduction
In the economic system that mostly depends on rivalry, the management has to develop the quality of the goods and service continuously. High quality production is so much beneficial for the productivity, the pleasure of doing the job in the best way, ac quired time by doing the job once accurately.
The globalization of the industry has changed the behavior for the consumers. The quality of the good is much more important than in which country it is produced. This rapid change in market forced the producers to adapt to the specific quality & standards of ISO (International Standard Organization).
Some techniques have been used in quality control to provide the consumers' qual ity demands. The most common of them are sampling plans.
A computer program (by using Delphi v3.0) was coded for the application. The data provided in this study were given as input and assessment was done according to the outcomes. As material parquets were selected that have been produced in Ardesen Tim-ber Plant. Ardesen TimTim-ber Plant produces timTim-ber and parquet in Ardesen, Rize. Annual timber production capacity is 30.000 m3 and also 50.000 m parquet. During the process at first parquet drafts are prepared after that they are dried to the moisture content kiln dry. After drying process parquet drafts are processed in the tonguing and grooving ma-chine packaged and they are ready to put up for sale. For the study at first, parquet (30 days-a hundred items for each day) was selected at random. And the samples were sub-ject to total (100%) inspection. The result in this period is as follows; 4 days-1 defected
item, 9 days-2 defected items, 12 days-3 defected items, 3 days-4 defected items and 2 days-5 defected items. According to the results, the permitted defected item number for Single Sampling Plan (SSP); c=3, the permitted defected item numbers for Double Sam-pling Plan (DSP); (ci=3, C2=5) was accepted.
Then by using single and double sampling, the quality control was done. This was achieved by following steps and formulas in the chart below. At the same time Operating Characteristics (OC), Average Outgoing Quality (AOQ), Average Sample Size (ASS) and Average Total Inspection (ATI) curve were drawn. Binom, Hipergeometric and Pois-son distributions are used in the single and double sampling plans. These distributions are likely for the results. Here, for the application convenience Poisson distribution is se-lected during the preparation of the computer program. As known, Poisson distribution is formulated as follows;
N : Main group, n : Sample group, d : The number of defected items of the sample N. Main group, n1 : First sample group, n2 : Second sample group, d1 : The number of de-fected items of the first sample group, C1 : Permitted defected item number, d2 : The number of defected items of the second sample group, c2: Permitted defected item num-ber;
In order to meet the need of finding four different curves for SSP and DSP, a pro-gram was created using Delphi. For the selected N=1000, n=100, c=3 plan, when what quality of parties with the probability of being accepted and/or rejected is observed (this plan is suppose to be sifter nature), according to the plan since the permitted defected item number is c=3 on n=100 sample and for the total P probability low, the probability of the acceptance of the incoming N=1000 is to be P=Po+Pi+P2+P3. Here for the n=l00 itemized sample group, PO shows the probability of not having any defected parquets (d=0), PI is for d=l, P2 for d=2 and finally P3 for d=3. Probabilities varies according to the rate of P defected items in the delivered party.
When the prepared program is started up, the plan, which is going to be applied first, has to be selected from the main menu (SSP and DSP). After the selection of the plan in SSP, N=1000 (main group), n=100 (sample group), and c=3 (permitted defected item number) and also in DSP, N=1000, ni=100, n;=150, Ci=3 and c;=5 values are input.
with regard of these values are drawn with the help of function keys (F2=OC, F3=AOQ, F4=ASS, F5=ATI).
As seen in graphic 1 for p'=0.01, the probability of acceptability of parquets in Ardesen Timber Plant is Pa(p')=0.981. The accepted probabilities for p' values are given under the graphics. According to graphic 2, Average Outgoing Quality Limit (AOQL) for parquets is p'=0.03 and AOQ is found as 0.019. For SSP, ASS is constant and is equal to 100 (See graphic 3). Graphic 4 shows the (p') of ATI number change due to party quali ties. At the beginning as ATI curve raises at a low-pace, it shows a high-pace from p'=0.02 to 0.06 and after that until 1000 a low-pace.
As the program is started up and the data for DSP is input, the values of OC, AOQ, ASS and ATI are found for different p' values. After that in every situation the graphics with regard of these values are drawn with the help of function keys (F2=OC, F3=AOQ, F4=ASS, F5=ATI).
As seen in graphic 5 for p'=0.01, the probability of acceptability of parquets is Pa(p')=0.990. The accepted probabilities for p' values are given under the graphics. Ac cording to graphic 6, Average Outgoing Quality Limit (AOQL) for parquets is p'=0.026 and AOQ is found as 0.020. For DSP, ASS is maximum (=153) for p'=0.04 and 0.05 (See graphic 7). Graphic 8 shows the (p') of ATI number change due to party qualities. At the beginning as ATI curve raises at a low-pace, it shows a high-pace from p'=0.02 to 0.07 and after that until 1000 a low-pace.
References
1. AKUN, F., Istatistik ve Kalite Kontrolu, Istanbul Teknik Universitesi Yayin No : 923, Istanbul, 1973.
2. ÇUBUKÇU, F., Turbo Pascal 6.0 Programlama Dili, Turkmen Kitabevi Yayin No : 14, II. Baski, Istanbul, 1993.
3. ESEN, O., Programlamaya Giri§ ve Basic, Evrim Basim Yayim Dagitim, II. Baski, Istanbul, 1990.
4. IDIL, O., Isletmeciler icin Genel Istatistik, Cilt 1, Istanbul Universitesi isletme Fa-kultesi yayin No : 207, Isletme Iktisadi Enstitusu yayin No : 103, II. Baski, Istanbul, 1989.
5. KOBU, B., Endustriyel Kalite Kontrolu, Istanbul Universitesi Yayin No : 3425, Isletme Fakultesi Yayin No: 182, İşletme İktisadi Enstitusu Yayin No: 84, II Baski, Istanbul, 1987. 5. ANS., TSE-ISO 9000 Kalite Brosiiru, 1996, Ankara.
6. ANS., Standard, Yil: 36, Sayi: 430, Ekim, 1997, Ankara.
yflK 633.33
THE EFFECT OFMOLIBDEN AND 6-BENZILAMINOPURIN IN NACI MEDIUM ON THE ACTIVITY OF VIGNA SINENSIS NITRATE
REDUCTASE ENZYME
Gadimov, A.G., Safaraliev, P.M., Allahverdiev, S.R., Nafisi, S. Azerbaijan Academy of Sciences, Institute of Botany, Baku, Azerbaijan; Zonguldak
Karaelmas University, Bartin Faculty of Forestry, Turkey Introduction:
One of the problems for researchers in agricultural studies in these days and near future, is to reduce the cost of manuring by nitrogen fertilizers without any decrease in agricultural rates The increase in the cost of fertilizers and also the aim of minimizing
Raif Copur IMPORTANCE OF BIRDS IN BIOLOGICAL CONTROL OF
HARMFUL FOREST INSECTS 161
Suat TOSUN RESEARCHES ON SEED ABUNDANCE OF ORIENTAL
BEECH (Fagus orientalis Lipsky.) FORESTS OF BOLU REGION IN TURKEY.. 163
Alper AYTEKIN, Selman KARAYILMAZLAR, Erdogan GAVCAR, Sukru OZSAHIN STATISTICAL QUALITY CONTROL IN FOREST PRODUCT
INDUSTRY: A CASE STUDY 165
Gadimov, A.G., Safaraliev, P.M., Allahverdiev, S.R., Nafisi, S. THE EFFECT
OFMOLIBDEN AND 6-BENZILAMINOPURIN IN NACI MEDIUM ON THE
ACTIVITY OF VIGNA SINENSIS NITRATE REDUCTASE ENZYME 167
Tagi HUSEYNOV, Surhay ALLAHVERDIEV, Erol KIRDAR THE EFFECT
ATMOSPHERIC FLUORINE-CONTAINNING POLLUTANTS ON THE PHOTOSYNTHETIC PIGMENTS, PROTEINS AND NUCLEIC ACIDS IN THE
LEAVES OF SOME TREES AND SHIRUBS SPECIES 169
Pinar DEMIRCIOGLU, Surhay ALLAHVERDIEV INFLUENCE OF SOME
PHYTOHORMONES ON SEED GERMINATION AND ANNUAL SEEDLING GROWTH
OF ACACIA (ROBINTA PSEUDOACACIAL.) 173
Surhay ALLAHVERDIEV, Valentina GINS THE RESPONSES OF
PHOTOSYSTEM II IN TREE SEEDLINGS ON THE SALT STRESS AND
EXOGENOUS HORMONES 174
Azize TOPER, R. Oktay OZKAZANC THE BIOLOGY AND DAMAGE OF
PITYOKTEINES CURVIDENS (GERM.) (COLEOPTERA, SCOLYTIDAE) LIVING ON ABIES BORNMULLERJANA MATTF. IN BART1N AND
KARABUK FORESTS IN THE WESTERN BLACKSEA REGION 177
Hale YILMAZ, Bülent YILMAZ SOME PLANT SPECIES OF BARTIN
REGION FLORA HAVING RHIZOMES, CORMS, BULBS OR TUBERS AND
THEIR IMPORTANCE FOR LANDSCAPE UTILIZATION 179
Serife SERTKAYA THE AID OF BARTIN FORESTRY FACULTY
ARBORETUM TO THE INTRODUCTION OF NEW PLANTS IN WEST OF
BLACK SEA REGION 181
Mukerrem ARSLAN, Hayran CELEM, M. Emin BARIS EXOTIC TREES
AND SHRUBS OF ANKARA 183
Oguz YILMAZ AN INVESTIGATION FOR NATURAL GEOPHYTES IN VAN
ENVIRONS IN TERMS OF THEIR LANDSCAPE ARCHITECTURE 186
Sevcihan BARUTCU, Surhay ALLAHVERDIEV THE EFFECT OF
F I T O H O R M O N E S ON THE GROWTH OF BEECH YOUNG PLANTS (FAGUS
ORIENTALIS LIPSKY) 189
Huseyin Atilla ATIK, Surhay ALLAHVERDIEV CONTROL OF SEED
GERMINATION IN PINUS NIGRA ARNOLD 190
Orhan DOGAN, Guner SAYGILI, Haluk DSTIJN THE PROBLEM IN
TURKEY AND SOME STUDIES AGAINST THE DESERTIFICATION 192
STATI STI CAL QUALI TY CONTROL
I N FOREST PRODUCT I NDUSTRY: A CASE STUDY
Alper AYTEKİN*, Selman KARAYILMAZLAR*, Erdoğan GAVCAR**, Şükrü ÖZŞAHİN*
* Zonguldak Karaelmas University, Faculty of Forest, BARTI N, TURKI YE * * Mugla University, Faculty of Business and Administration, MUGLA, TURKI YE
I ntroduction
I n the economic system that mostly depends on rivalry, the management had to develop the quality of the goods and service continuously. High quality production is so much beneficial for the productivity, the pleasure of doing job in t he best way, acquired time by doing t he job once accurately.
The globalization of the industry has changed the behavior for the consumers. The quality of t he good is much more important than in which country it is produced. This rapid change in market forced the producers to adapt t o the specific quality & standards of I SO (I nternational Standard Organization).
Some techniques have been used in quality control to provide t he consumers’ quality demands. The most common of t hem is sampling plans.
I n this study, single and double sampling plans and a sample statistical quality control application was done at the parquet unit of Ardeşen timber factory.
A computer program (by using Delphi v3.0) was coded for t he application. The data provided in t his st udy were given as input and assessment was done according to the outcomes. As material parquets were selected that have been produced in Ardeşen Timber Factory. Ardeşen Timber Factory produces timber and parquet in Ardeşen, Rize. Annual timber product ion capacity is 30.000 m3 and also 50.000 m3 parquet. During the process, at firs parquet drafts are prepared after that they are dried to the moisture content kiln dry. After drying process parquet drafts are processed in t he tonguing and grooving machine packaged and they are ready to put up for sale. For the st udy at first parquet (30 days-a hundred items for each day) was selected at random. And the samples were subject t o total (100% ) inspection. The result in this period is as follows; 4 days-1 defected item, 9 days-2 defected items, 12 days-3 defected item, 3 days-4 defected item and 2 days-5 defected item. According to t he results, the permitted defected item number for Single Sampling Plan (SSP); c= 3, t he permitted defected item numbers for Double Sampling Plan (DSP); (c1= 3, c2= 5) was accepted.
Then by using single and double sampling t he qualit y control was done. This was achieved by following steps and formulas in the chart below. At the same time Operating Characteristics (OC), Average Outgoing Quality (AOQ), Average Sample Size (ASS) and Average Total I nspection (ATI ) curve were drawn. Binom, Hipergeometric and Poisson distributions are used in the single and double sampling plans. These dist ributions are likely for the results. Here, for the application convenience Poisson distribution is selected during the preparation of the computer program. As known, Poisson distribut ion is formulated as follows;
d ≤ c then “YES”, The probability of defected item among parquets (N-n) wit h spesific defected rate quarantee is given.
d > c then “NO” or (N-n) parquets are inspected. The defected parquets are replaced with the new ones. N : Main group, n : Sample group, d : The number of defected items of t he sample group, c : Permitted defected item number.
d1 ≤ c1 Then YES I . STAGE d1 > c2 Then NO
c1 < d1≤ c2 then I I . SAMPLE I I . STAGE d1+ d2 ≤ c2 then YES (accepted)
d1+ d2 > c2 then NO (rejected)
!
.
x
e
P
x
λ
λ
N: Main group, n1 : First sample group, n2 : Second sample group, d1 : The number of defected items of the
first sample group, c1 : Permitted defected item number, d2 : The number of defected items of t he second sample
group, c2 : Permitted defect ed item number;
Operating Characteristics
Average Outgoing
Quality
Average Sample Size Average Total I nspection
Single Pa(p´ ) p´×Pa(p´ ) n Pa(p´ )×n+ (1-Pa(p´ )×N)
Double Pa(p´ ) p´×Pa(p´ ) n1+ n2× P(2.sample)) ASS+ (N-n1)×P(d> c1)+ (N-n1-n2)×(1-Pa(p’)-P(d> c2))
Results and Evaluation
I n order to meet the need of finding four different curves for SSP and DSP, a program was created using Delphi. For the selected N= 1000, n= 100, c= 3 plan, when what quality of parties with the probability of being accepted and/ or rejected is observed (this plan is suppose to be sifter nature), according to the plan since the permitted defected item number is c= 3 on n= 100 sample and for t he total P probability low, the probability of t he acceptance of the incoming N= 1000 is to be P= P0+ P1+ P2+ P3. Here for the n= 100 itemized sample group, P0 shows the probability of not having
any defected parquets (d= 0), P1 is for d= 1, P2 for d= 2 and finally P3 for d= 3. Probabilities varies according to t he rate of P defected items in the delivered party.
When t he prepared program is started up, the plan, which is going to be applied first, has to be selected from the main menu (SSP and DSP). After the selection of t he plan in SSP, N= 1000 (main group), n= 100 (sample group), and c= 3 (permitted defected item number) and also in DSP, N= 1000, n1= 100, n2= 150, c1= 3 and c2= 5 values are
input.
AOQ : Average Outgoing Qualit y ASS : Average Sample Size ATI : Average Total I nspection
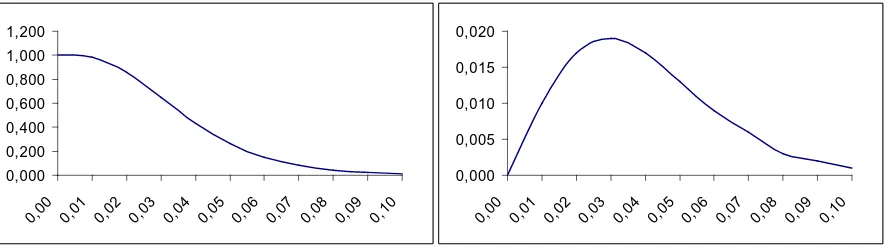
Figure 1. Single Sampling Plan Results
Graph 1. Operating Characteristic Curve Graph 2. Average Outgoing Quality Curve
0,000 0,200 0,400 0,600 0,800 1,000 1,200
0,00 0,01 0,02 0,03 0,04 0,05 0,06 0,07 0,08 0,09 0,10
0,000 0,005 0,010 0,015 0,020
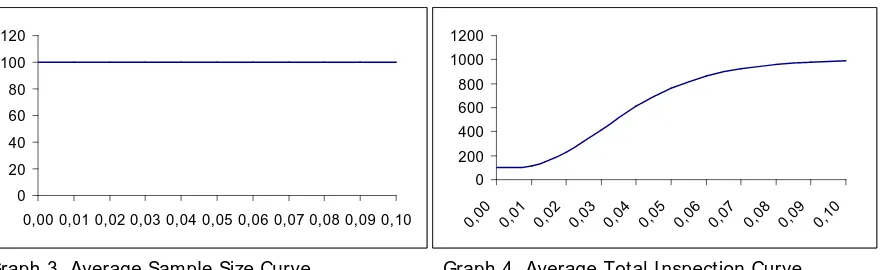
Graph 3. Average Sample Size Curve Graph 4. Average Total I nspection Curve
As the program is started up and the data for SSP is input, the values of OC, AOQ, ASS and ATI are found for different p´ values. After t hat in every sit uation the graphics with regard of these values are drawn with the help of function keys (F2= OC, F3= AOQ, F4= ASS, F5= ATI ).
As seen in graphic 1 for p´ = 0.01, the probability of acceptability of parquets in Ardesen Timber Management is Pa(p´ )= 0.981. The accepted probabilities for p´ values are given under the graphics. According to graphic 2, Average Outgoing Quality Limit (AOQL) for parquets is p´ = 0.03 and AOQ is found as 0.019. For SSP, ASS is constant and is equal to 100 (See graphic 3). Graphic 4 shows t he (p´ ) of ATI number change due to party qualities. At the beginning as ATI curve raises at a low-pace, it shows a high-pace from p´ = 0.02 to 0.06 and after that until 1000 a low-pace.
AOQ : Average Outgoing Qualit y ASS : Average Sample Size ATI : Average Total I nspection
Figure 2. Double Sampling Plan Results
As the program is started up and the data for DSP is input, the values of OC, AOQ, ASS and ATI are found for different p´ values. After t hat in every sit uation the graphics with regard of these values are drawn with the help of function keys (F2= OC, F3= AOQ, F4= ASS, F5= ATI ).
Graph 5. Operating Characteristic Curve Graph 6. Average Outgoing Quality Curve
0 20 40 60 80 100 120
0,00 0,01 0,02 0,03 0,04 0,05 0,06 0,07 0,08 0,09 0,10
0 200 400 600 800 1000 1200
0,00 0,01 0,02 0,03 0,04 0,05 0,06 0,07 0,08 0,09 0,10
0,000 0,200 0,400 0,600 0,800 1,000 1,200
0,00 0,01 0,02 0,03 0,04 0,05 0,06 0,07 0,08 0,09 0,10
0,000 0,005 0,010 0,015 0,020 0,025
Graph 7. Average Sample Size Curve Graph 8. Average Total I nspection Curve
As seen in graphic 5 for p´ = 0.01, the probability of acceptability of parquets is Pa(p´ )= 0.990. The accepted probabilities for p´ values are given under t he graphics. According to graphic 6, Average Outgoing Qualit y Limit (AOQL) for parquets is p´ = 0.026 and AOQ is found as 0.020. For DSP, ASS is maximum (= 153) for p´ = 0.04 and 0.05 (See graphic 7). Graphic 8 shows the (p´ ) of ATI number change due to party qualities. At the beginning as ATI curve raises at a low-pace, it shows a high-pace from p´ = 0.02 to 0.07 and after that until 1000 a low-pace.
References
AKÜN, F., İstatistik ve Kalite Kontrolü, İstanbul Teknik Üniversitesi Yayın No : 923, İstanbul ,1973.
ÇUBUKÇU, F., Turbo Pascal 6.0 Programlama Dili, Türkmen Kitabevi Yayın No : 14, II. Baskı, İstanbul, 1993. ESEN, Ö., Programlamaya Giriş ve Basic, Evrim Basım Yayım Dağıtım, II. Baskı, İstanbul, 1990.
İDİL, O., İşletmeciler için Genel İstatistik, Cilt 1, İstanbul Üniversitesi İşletme Fakültesi yayın No : 207, İşletme
İktisadi Enstitüsü yayın No : 103, II. Baskı, İstanbul, 1989.
KOBU, B., Endüstriyel Kalite Kontrolü, İstanbul Üniversitesi Yayın No :3425, İşletme Fakültesi Yayın No : 182, İşletme
İktisadi Enstitüsü Yayın No : 84, II. Baskı, İstanbul, 1987.
ANS., TSE-ISO 9000 Kalite Broşürü, 1996, Ankara. ANS., Standard, Yıl: 36, Sayı : 430, Ekim, 1997, Ankara.
0 200 400 600 800 1000 1200
0,00 0,01 0,02 0,03 0,04 0,05 0,06 0,07 0,08 0,09 0,10 0
50 100 150 200