* Corresponding author. Tel/Fax : +62-380-8853461
SEDIMENTS AND NUTRIENT DYNAMICS IN THE LAKE MARKERMEER,
THE NETHERLANDS
Philiphi de Rozari
Department of Chemistry Faculty Science and Engineering Nusa Cendana University Kampus Penfui UNDANA Jl. Adisucipto Kupang NTT
Received October 28, 2008; Accepted March 3, 2009
ABSTRACT
Lake Markermeer is a large fresh water lake in the centre of the Netherlands. Since Lake Markermeer is categorised as a shallow lake, it is very susceptible for sediment resuspension. The general objective of this study is to investigate sediment and nutrient dynamics in Lake Markermeer sediments. This research was carried out in a 5 months period from November 2007 until March 2008 using sediment trap methods. Sampling sites for sediment traps are located at the two fixed sites in which each sampling site had duplicates bottom and half-depth traps. The collection of the sediment traps samples was conducted every two weeks. The parameter measured in sediment traps were: sediment trap yields, Loss on ignition (LOI), total N and total P. Statistical t test analysis was utilised to compare the value of each parameter between two sampling stations as well as between bottom and half depth at the same stations.The results for the sediment trap activities showed that at the two fixed sampling stations, the sediment trap yields in the bottom part tend to be higher than half depth. This difference between bottom and half-way traps is statistically significant. Also, a significant difference was found between STA and STB, both for bottom and half-depth traps. A similar result was found for LOI. For total N and P the results showed that there were no significant differences between bottom and half-depth at the two fixed sampling stations.
Keywords: Lake Markermeer, resuspension, sediment trap
INTRODUCTION
Sediments and sediment-water exchange can have an important role in ecological dynamics of lakes. The distribution of sediment in lakes is a complex process resulting from interaction between various factors such as bathymetry, size, and shape of river basin; forcing function such as wind and currents and differential response of particles of various sizes and suspended load concentration [1]. Hence, a thorough understanding of the processes of sediment-water interaction, supported by the availability of mathematical models capable of predicting the origin, fate and quantities of sediment in lakes, will be extremely useful in lake management [12]. This management is required for improving water quality as well as preserving ecological functions in the water bodies of the lakes.
Lake Markermeer is a large freshwater lake in the centre of the Netherlands. In this lake water quality problems are often related to sediment composition and transport [12]. With the increase of stress upon Lake Markermeer due to increasing human/urban population and industrial activities in the upstream, water quality studies for predicting the fate of pollutants and assessment of these pollutants in Lake Markermeer water body have become more important. According to Meybeck et al [7] water quality is affected by a wide range of natural and human influences. There are three major components for studying water body
characterization; these are: hydrodynamics, physico-chemistry, and biology [8]. Traditionally, these characteristics of a water body are specified through intensive water quality monitoring programmes upon the water body involving measurement of various parameters.
Hydrodynamics (water motion and transport) and sediment dynamics of materials affecting the water quality has long been recognised as the crucial component of any water quality study [6]. As mentioned by Sloff [11] sediment dynamics, hydrodynamics and morphological processes in reservoirs are very complex and irregular, and many phenomena are poorly understood and described. In most water quality monitoring programmes for water bodies (with stagnant water), detailed measurement of sediment dynamics and hydrodynamics is hardly included. The emphasis is mainly upon general physico-chemical parameters due to their ease of measurement [9].
In Lake Markermeer, the actual problem is high turbidity in which this phenomena is induced by the amount of silt in the water column. The sources of the silts contributing to this lake are original marine sediment overlain by muddy settled sediment (0-20 cm), mostly in the eastern part of the lake, as well as peat clay erosion which come from the western part of the lake (North sediment particles. This holds especially for areas with large wind fetches. According to Kelderman [4] sediment-water exchange is highly dependent on the sediment typology and further is determined by environmental factors such as water temperature, oxygen concentration in the upper sediment layer, pH, currents and waves upon the sediment bed and bioturbation of benthic fauna. Furthermore, resuspended processes of sediment particles also are function of effective fetch, wind speed and water depth. In this lake, the knowledge of the dynamic sediment especially in the upper 3-10 cm is poorly understood.
Due to resuspension processes, photosynthesis does not occur effectively whereas this lake has enough nutrients ( [P]tot around 0.1 mg P/l; [N]tot around 1.5 mg
N/l [12] within the water body. Since turbidity in this lake is very high, the water is not transparent so the light is not enough to penetrate the water column. This phenomenon results into low primary production in this water column and absence of rooting water plants.
In order to understand interrelated processes ongoing in the aquatic ecosystem of Lake Markermeer, research about sediment dynamics and nutrient dynamics in the sediment should be conducted to contribute to the holistic picture of this lake. This information is very valuable for management of the lake.
EXPERIMENTAL SECTION
The research was carried out in a 5 months period from November 2007 until March 2008. The fieldwork was conducted in Lake Markermeer and all the experimental and analysis works were carried out in the UNESCO-IHE Delft Laboratory.
Description of the region
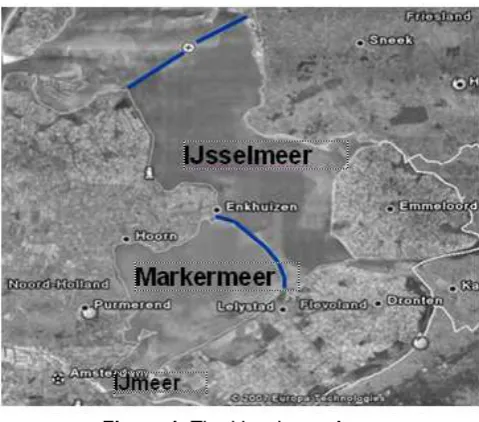
Lake Markermeer, a large artificial shallow fresh water lake, is located in the centre of the Netherlands. This lake is separated from the larger IJsselmeer lake by a dike between Enkhuizen and Lelystad (Figure 1). The southern part of the lake is called IJmeer. Until 1976, the Markemeer used to be part of the IJsselmeer which was formed by the realization of the ZuiderZee project. Until 1932, The Zuiderzee had open connection with the
Wad-Figure 1. The IJsselmeer Area.
denzee, which is connected to Noordzee. Hence, the water was saline.
Development of Lake Markemeer is designed for some purposes such as ecological function, social function, agricultural water supply, recreation, fishery and shipping. This lake is categorized as a large open, shallow (average depth 3.5 m) area with a limited the two fixed sites (figure 2). Collection of the sediment trap samples were conducted every two weeks, in the period 4 December 2007 until 26 February 2008.
Procedure
Constructions and Sampling Techniques
Figure 2. Location of the sediment trap sampling sites
Figure 3. The position of the two fixed stations STA and STB
Explanation A : Depth (STA = 4.2 m, STB = 3.2 m) B : ½ Depth
Figure 4. Sediment traps design.
sediments both in the bottom and in the “half-depth” of the lake (see figure 4). The traps were 4.5 cm internal diameter and 50 cm long; the aspect ratio of the traps was thus equal to 11, in accordance with an accepted value > 3 [2]. Each trap set consisted of two cylinders (for one tier trap) vertically clamped onto an iron rod driven into the bottom with adjustable length. The top and the bottom trap suspension rings were kept perpendicular to each other. The openings of the bottom and half-depth traps were thus at: 4.0 and 2.0 (STA) and 3.0 and 1.5 m (STB), respectively.
The sediment traps were in this way attached to the fixed stations STA and STB and kept here for, generally two weeks intervals. After two weeks, the filled sediment traps were collected and transported to the UNESCO-IHE lab whereas the new trap sets were placed at the two fixed stations.
The collected traps were transported to a cooling room (5 °C) in the UNESCO-IHE Delft laboratory. Subsequent analysis took place generally within 3 days.
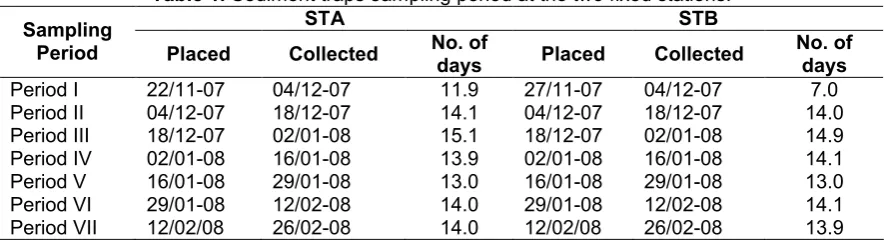
A mentioned before, collection of the sediment trap samples took place in the period 4 December 2007 until 26 February 2008. Information regarding to period of sediment traps sampling activities is given in Table 1.
Measurement and Analysis
To empty the traps, each wet sediment trap sample with some supernatant water in the polyethylene traps was quantitatively transferred to labelled, pre-dried (520 °C), pre-weighed Al-cups [5]. Then the wet sediment samples were dried at 70 °C until constant weight. After this, dried sediment samples were weighed on an analytical balance for determination of the dried weight collected per trap (g/m2/d). Representative dried sediment samples were sieved on a 2 mm diameter sieve to separate particles > 2 mm from other particles. Sediment > 2 mm was discarded whereas the fraction < 2 mm was utilized for further treatment and analysis for Loss on ignition (LOI), total N and total P.
Determination of LOI, total N-NH4, and total-P Apparatus
Heating block and destruction tubes, spectrophotometer, pH meter, water bath, acid-washed glassware.
Reagen
H2SO4, H2O2 30%, Se powder, salicylic acid,
dichloroisocyanurate reagent, salicylate reagent, standard NH4Cl, methyl-red indicator, potassium
antymonyl tartrate, ammonium heptamolibdate, ascorbic acid, standard P solution (KH2PO4 5 mg/L),
Table 1. Sediment traps sampling period at the two fixed stations.
Period I 22/11-07 04/12-07 11.9 27/11-07 04/12-07 7.0
Period II 04/12-07 18/12-07 14.1 04/12-07 18/12-07 14.0 Period III 18/12-07 02/01-08 15.1 18/12-07 02/01-08 14.9 Period IV 02/01-08 16/01-08 13.9 02/01-08 16/01-08 14.1 Period V 16/01-08 29/01-08 13.0 16/01-08 29/01-08 13.0 Period VI 29/01-08 12/02-08 14.0 29/01-08 12/02-08 14.1 Period VII 12/02/08 26/02-08 14.0 12/02/08 26/02-08 13.9
Procedures
Loss on ignition analysis. Loss of ignition (LOI) was determined by igniting the dried samples in a furnace at 520 °C for 4 hours, in pre-ignited Al cups [2]. LOI was
Analysis of total N-NH4 and total-P in the sediments was
started with digestion of sediment samples [5].
Digestion of sediments. Weight about 0.3 g with accuracy of 0.001 g of dried sediment material and transfer quantitatively to the destruction tube. Add 2.5 ml digestion mixture (dissolve 7.2 g salicylic acid in 100 ml H2SO4), swirl carefully until all the sediment material is diluted with about 15 ml of water, add about five pumice grains, boil and after cooling made up to 50 ml in a volumetric flask. Mix well and let particles settle for 24 hours before analysis. These solutions are ready for analysis total N-NH4 and total P.
Total N-NH4 analysis. Calibration: make a series demineralised water and mix. Determine the absorbance at 655 nm between 1 – 3 hours. Sample determination: bring digested sediment samples at room temperature and neutralize if necessary. Neutralize digested sediment samples with NaOH and use methyl-red indicator. Pipet 5 ml of samples in a 50 ml volumetric flask. Add respectively 4.00 ml of salicylate reagent and
dichloroisocynurate and mix. Fill up to the mark with demineralised water and mix. Measure the absorbance at 655 nm between 1 – 3 hours.
Total P analysis. Calibration: transfer the following amount of standard P (5 mg/L) to 100 ml volumetric flasks: 0; 2.00; 3.00; 5.00; 10.00; and 15.00 ml. add 16 ml combined reagent (125 sulfuric acid 2.5 M + 12.5 ml potassium antymonyl tartrate + 7.5ml ammonium heptamolibdate + 75 ml ascorbic acid). Fill up to the mark and mix. Measure the absorbance between 10 – 30 min at 880 nm. Plot the absorbance against concentration and determine mathematical expression of the calibration line.Sample determination: Pipet 5 ml digested sediment samples to a 100 ml volumetric flask, add 1 drop phenolpthaleine indicator. If a red colour develops add dropwise 2.5 M H2SO4 to just discharge the colour. Add 16 ml combined reagent, fill up to the mark and mix. Measure the absorbance at 880 nm between 10 – 30 min.
RESULT AND DISCUSSION
Sediment trap yields in Lake Markermeer
In general, differences between duplicates were ranging from 0.0075% - 19.3%, with an average difference of 3.61%. Omollo [10] had found similar results in which the differences between duplicates ranging within 2–10%. Since in Lake Markermeer the influence of wind speeds are very considerable, the differences in sediment rates during sampling period were notably induced by the variation of wind speeds.
Comparison of sediment trap yields between bottom part and half depth of two fixed sampling sites (STA and STB)
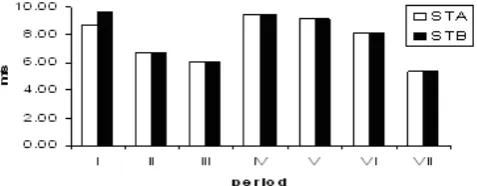
Figure 5 a/b. Average sediment trap yields at stations STA and STB over the whole monitoring period (See Fig. 2) STA1 and STB1 stand for the yields in the bottom traps; STA2 and STB2 for the yields in the traps at half-depth. The vertical error bars indicate the standard deviations between duplicate traps.
Figure 6. Mean of wind speed during sampling period. These figures show that the pattern of sediment yields at the two stations are quite similar. Also the sediment trap yields in the half-depth traps in STA and STB were as follows; 24.5% – 46.6% (on average. 36.2%) and 46.5% - 66.7% (on average 54.1%) lower than in the bottom traps. This trend must be due to a re-settling of the resuspended sediment between the bottom and half-water depth. Using a t-test [13] this difference between bottom and half-way traps is statistically significant (p< 0.05). According to Omollo [10] the bottom traps will have collected both settled and resuspended materials whereas the top traps will virtually only have collected settled materials.
Figure 5 a and b show that the sediment trap yields observed for samples collected on period IV, V and VI were high at both sampling sites. On the other hand, the sediment yields for samples collected on period III and VII are lower compared with other collection sampling periods. The fluctuations of sediment trap yields were remarkably induced by the intensity of wind speed. As a mention by Van Duin [12] when she conducted the research in Lake Markermeer, wind speed provided and impact to the average of sedimentation flux. The graph (figure 6) shows the mean wind speed during period research period.
In order to identify the influence of wind speed on sediment trap yields, statistical correlation was applied. The result show that there is a strong correlation between wind speed and sediment trap yields for both
fixed sampling sites. Correlation coefficients r were as follows: STA1: 0.840; STA2: 0.901; STB1: 0.681; STB2: 0.900. This makes the correlations significant (p< 0.05).
Comparison of sediment trap yields between the two fixed sampling stations (STA and STB)
Looking further to the bottom and half depth sediment traps at the two fixed stations, figures 5 shows that the pattern of sediment trap yields in the bottom traps at STB are more fluctuate than that at STA whereas in the half dept traps, the pattern of sediment trap yields at STA and STB are quite similar. These figures also show that the average trap yields at STB tend to be higher than at STA. This was also tested using a t-test. Indeed a significant difference was found between STA and STB with the average bottom trap yields at STA and STB as 1258 and 2585 g/m2/d respectively. The half depth trap yields STA and STB were found to be 766 and 1180 g/m2/day respectively. The differences between STA and STB can be probably ascribed to differences in the type of sediment in this two sampling sites.
Organic matter content of the trapped sediment
Figure 7 shows the averages for loss on ignition (LOI) for the duplicate sediment of bottom and half depth traps at the two fixed sampling sites. The LOI for all the trapped samples in STA were > 10% whereas the LOI for all the trapped samples in STB ranged from 7.5 to 12.3%. According Håkanson and Jonsson [2], the particulate organic content (POC) can be estimated as LOI/2. Based on this estimation, the POC value in STA ranged from 6.10 to 8.21% and the value in STB between 3.74 and 6.16%.
respec-Figure 7 a/b. Average LOI at stations STA and STB over the whole monitoring period.
Figure 8 a/b. Average tot-N at stations STA and STB over the whole monitoring period. tively). Again using a t-test, this difference between STA
and STB showed to be significantly different (p< 0.05). This was probably due to differences in sediment types at the two fixed sampling sites. The variations of LOI along bottom traps in STA and STB were 12.2 – 15.8% and 9.9 – 12.3%, respectively. The same phenomena also occurred in the half depth- traps where the average LOI at STA was significantly (p< 0.05) higher than that at STB. Result from the t-test (95% confidence) also showed that in STA there is no significant different between bottom and half depth whereas in STB there is significantly different between bottom and half depth.
If we look further to the mean differences between the bottom and half depth traps at the two fixed sampling sites, there were no significant differences in LOI here. This indicates that the source of organic matter in trap yields is mostly from resuspension processes. The source from settled materials can be neglected.
Total N of trapped sediment
The average in the sediments trap yields for the bottom traps and half depth traps at the two fixed sampling stations are indicated in figure 8.
This figures show that the average of total N collected for the bottom traps at STA during the sampling period tend to be quite similar to the half-depth values. On the other hand, for STB, the average of total
N in the bottom traps were higher than that at half depth. The variations of total N in both fixed sampling sites are as follows: STA1 (bottom) 5.0 – 9.1 mg/g, STA2 (half depth) 4.9 – 8.2 mg/g, STB 1 ; for half-depth: 2.7 – 5.7 mg/g (STA) and 1.7 – 4.6 mg/g (STB). The averages for the trap yields were as follows: STA1: 6.0 mg/g; STA2: 6.0 mg/g; STB1: 3.8 mg/g; STB2: 2.9 mg/g. If we statistically analyse using a t-test (95% confidence), there are no significant differences between bottom and half depth in the two fixed sampling stations. The figures also show that total N collected in STA is relatively higher that total N in STB. Comparison of total N in the bottom part between STA and STB as well as in half depth using t test (p< 0.05) show that in the bottom part, total N in STA is significantly higher than total N in STB. This phenomenon also occurred in the half-depth traps. It can be induced by differences of sediment types between STA and STB.
Total P of trapped sediment
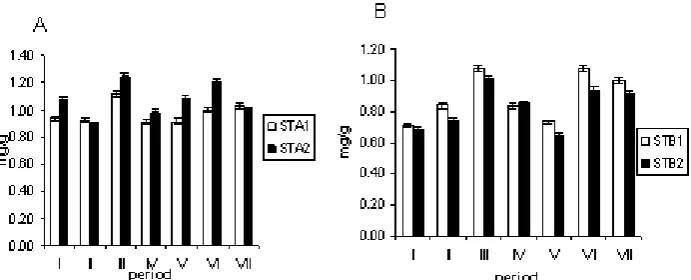
The result of total P at two fixed sampling sites over the whole monitoring period (4 December 2007 until 26 February 2007) are illustrated in figure 9.
Figure 9 a/b. Average total P for bottom and half depth of sediment traps in two fixed sampling sites. of total P in both fixed sampling sites are explained as
follows: STA 1 (bottom part) 0.911 – 1.113 mg/g, STA 2 (half depth) 0.891 – 1.242 mg/g, STB 1 (bottom part) 0.709 – 1.079 mg/g and STB2 (half depth) 0.645 – 1.008 mg/g. The means of each part in the two sampling sites were as follows: STA1: 0.974 mg/g; STA2: 1.070 mg/g; STB1: 0.895 mg/g; STB2: 0.826 mg/g. The statistical analysis result using t-test (95% confidence) showed that there are no significant differences between bottom and half depth for the two fixed sampling stations. This research also tried to compare the bottom part as well as half depth between two fixed stations. Result from a t-test (95% confidence) showed that in bottom part there is no significant difference between STA and STB whereas in half depth the concentration of total P is significantly different between STA and STB.
CONCLUSION
The results showed that at the two fixed sampling stations the sediment trap yields in the bottom part are significantly higher than half depth. This trend is due to a re-settling of the resuspended sediment between the bottom and half-water depth. The results also show that there is a strong correlation between wind speed and sediment trap yields for both fixed sampling sites. Moreover a significant difference was found also between STA and STB for both bottom and half-depth traps. The differences between STA and STB can be probably ascribed to differences in the type of sediment at the two sampling sites. Total N and P results show that there are no significantly differences between bottom and half depth at the two fixed sampling stations. The results also show that in the half-depth traps, total N and P collected at STA are relatively higher than at STB, These phenomena were induced by differences of sediment types between STA and STB.
ACKNOWLEDGEMENT
This research is funded by Lake Markemeer project in which collaboration between UNESCO-IHE Delft and
WL Delft Hydraulics, The Netherlands. The author would like to thank to Dr. Peter Kelderman (UNESCO-IHE Delft) and M. Kuijper, M.Sc (DELTARES) for guidence the autor during research period and valuable discussion during writing period.
REFERENCES
1. Azza, N., 2006, The Dynamics of Shoreline Wetlands and Sediments of Northern Lake Victoria,
PhD thesis, UNESCO-IHE Institute for Water Education, Deflt The Netherlands. p 21-55.
2. Håkanson, L. and Jansson, M., 1983, Principles of Lake Sedimentology, Springer Verlag, Berlin, p. 15-80.
3. Kelderman, P., Kassie, D.B., Bijlsma, M., Okonkwo, L.C., and Doppenberg, A.A.T., 1998,
Water Science and Technology, 37(6-7), 63-70. 4. Kelderman, P., Nieuwenhuize, J., Meerman-van De
Repe, A.M., and van Liere, J,M., 1984, Netherlands Journal of Sea Research, 18(3/4) 273-284).
5. Kruis, F., 2007, Environmental Chemistry; selected methods for water quality Analysis, Laboratory Manual LN0168/07/1, UNESCO-IHE, The Netherlands, p.10–75.
6. Martin, J.L. and McCutcheon, S.C., 1999, Hydrodynamics and Transport for Water Quality Modeling, Lewish Publisher, Athens, GA, p. 38-50. 7. Meybeck, M. and Helmer, R., 1996, An Introduction
to Water Quality. In Chapman, D (ed) Water quality Assessments: A guide to the use of biota, sediments and water in the environmental monitoring, London: Spon Press, p. 1–21.
8. Meybeck, M., Kuusisto, E., Makela A., and Malkki, E., 1992, Water Quality in J. Bartman and R. Ballance (Ed.) Water Quality Monitoring-A Practical Guide to the Design and Implementation of Freshwater Quality Studies and Monitoring Programmes E&FN Spon Press, London, p. 69-99. 9. Muniina, K., 2006, A Hydrodinamic
Yongdam Reservoir. Unpublished Master Thesis, UNESCO-IHE, Institute for Water Education, Delft. 10. Omollo, A.O., 2005, Sediment and Nutrient
Dynamics in the Kirinya west-Wetland (Uganda), Unpublished Master Thesis (WM 05.07), UNESCO-IHE, Institute for Water Education, Delft. p. 5-51. 11. Sloff, C.J., 1997, Sedimentation in Reservoirs, PhD
thesis, Faculty of Civil Engineering, Delft University of Technology, Delft p. 31-50.
12. Van Duin, E.H.S., 1992, Sediment transport, light and algal growth in the Markermeer, PhD thesis, Agricultural University Wageningen, Department of Natural Conservation, The Netherlands, p. 30-115. 13. Wheater, C.P. and Cook, P.A., 2000, Using