271
Decomposing Gender and Ethnic
Earnings Gaps in Seven Cities
in West Africa
Christophe J. Nordman, Anne-Sophie Robilliard,
and François Roubaud
Women and certain ethnic groups oft en face unequal treatment in labor mar-kets, in both developed and developing countries. Many studies examine ethnic and gender wage gaps in developed countries (Altonji and Blank 1999; Blau and Kahn 2000). In contrast, only 3 percent of the studies on the gender wage gap draw on African data (Weichselbaumer and Winter-Ebmer 2005). As a result, little is known about inequalities in labor market outcomes in Africa.
Enhancing the literature on the gender and ethnic gap in the poorest coun-tries is important for several reasons. First, there are manifest shortcomings of studies on African countries, particularly because of the thinness of the data (Bennell 1996). Second, gender and ethnic inequalities are likely to be greater where markets do not function effi ciently and the state lacks the resources to introduce corrective policies. Th ird, understanding the roots of gender and ethnic inequalities and narrowing these gaps could help policy makers design poverty-reduction policies.
Under the Poverty Reduction Strategy Paper (PRSP) initiative, which con-cerns more than 60 of the world’s poorest countries, policies designed to counter gender discrimination are among the recommended solutions to reduce poverty.1 Goal 3 of the Millennium Development Goals (MDGs) is specifi cally aimed at reducing gender inequalities. In order to put this recommendation into practice, policy makers need to understand whether diff erences in labor outcomes stem from diff erences in individual characteristics or diff erences in the returns to these characteristics. Diff erent sets of policies are called for in each case.
Th e literature on gender gaps confi rms the presence of gender inequali-ties for both wage-earners and self-employed workers. In Guinea, diff erences in individual characteristics account for only 45 percent of the gender gap in
272 URBAN LABOR MARKETS IN SUB-SAHARAN AFRICA
earnings from self-employment and 25 percent of the diff erences in earnings from public sector employment; in the private sector, women earn more than men (Glick and Sahn 1997). Armitage and Sabot (1991) fi nd gender inequal-ity in the public sector of Tanzania; they fi nd no evidence of gender discrimi-nation in Kenya’s labor market. Glewwe (1990) fi nds no wage discrimidiscrimi-nation against women in Ghana. On the contrary, women in the public sector seem to earn more than men.2 Siphambe and Th okweng-Bakwena (2001) show that in the public sector of Botswana, most of the wage gap refl ects diff erences in individual characteristics between men and women rather than discrimination. In contrast, most of the wage gap in the private sector refl ects discrimination. Appleton, Hoddinott, and Krishnan (1999) fi nd evidence that the public sector of Côte d’Ivoire and Uganda practices less wage discrimination than the pri-vate sector. Nordman and Roubaud (2009) fi nd a similar result for Madagascar, where a gender gap in the public sector favors women.
Th e magnitude of gender wage gaps in the public and private sectors var-ies across countrvar-ies. However, the main reason for this diversity may be in the heterogeneity of the data sources used by diff erent authors (labor force or household surveys undertaken for purposes other than studying the labor market), in the period they consider, and in the methodology they implement. Concerning the ethnic wage gap, the literature is even scarcer. Barr and Oduro (2000) fi nd that standard observed diff erences in workers’ characteris-tics explain much of the earnings diff erentials across ethnic groups in Ghana. Th e role of ethnolinguistic fractionalization in development has received much more attention. Easterly and Levine (1997) conclude that “Africa’s growth trag-edy” is in part related to its high level of ethnic diversity, resulting in poor insti-tutional functioning.
Th is chapter casts light on these issues by using the set of 1-2-3 surveys con-ducted in the capital cities of the seven French-speaking countries of the West African Economic and Monetary Union (WAEMU) (for a description of these surveys, see box O.1 in the overview). Th is approach is important for two reasons. First, the data used were collected using the same sampling method and virtually identical questionnaires in each city in the same period of time (2001–02), mak-ing for totally comparable results. Second, the chapter analyzes both gender and ethnic gap issues using the same methodological approach for each city.
Th e chapter is organized as follows. Th e fi rst section discusses the data, con-cepts, and econometric methods used. Th e second section analyzes the results. Th e last section summarizes the main fi ndings and draws conclusions.
Data, Concepts, and Methodology
Th is section presents the data and concepts used. It then discusses the meth-odology of earnings decompositions, an essential aspect of the investigation.
Data and Concepts
Th e data are taken from Phase 1 of the 1-2-3 surveys conducted in the seven French-speaking capitals of the WAEMU countries. Th e sample surveyed in Phase 1 included 93,213 individuals (17,841 households). All respondents were asked about their ethnic group. Th e nonresponse rate was very low, with just 665 respondents failing to identify their ethnic group.
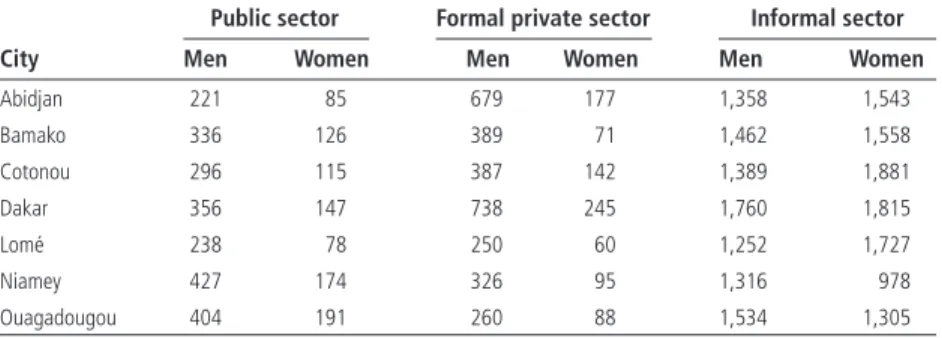
When restricted to working individuals with nonzero earnings, on whom our estimations are based, the sample size is reduced to 20,878 observations (table 9.1), with a minimum of 2,294 observations in Niamey and a maximum of 3,575 observations in Dakar. Th is sample is still large enough to allow disag-gregation of the data by sector (public sector, formal private sector, and infor-mal sector) and gender.
Th e number of ethnic groups listed in the questionnaire ranged from 9 in Benin and Niger to 40 in Togo. In order to harmonize the data and the number of categories considered, we collapsed the 40 Togolese groups and 18 Ivorian groups into 6 groups.
Wage Gap Decomposition Techniques
Traditional gender earnings decompositions rely on estimations of Mincer-type earnings functions for men and women of the form
lnwi = axi + εi (9.1)
where lnwi is the natural logarithm of the observed hourly earnings for
indi-vidual i;xi is a vector of observed individual characteristics; ais a vector of
coef-fi cients; and εi is a disturbance term with an expected value of zero. Earnings
Table 9.1 Number of Working Individuals in Sample with Nonzero Earnings in Seven Cities in West Africa, by Sector and Gender
Public sector Formal private sector Informal sector
City Men Women Men Women Men Women
Abidjan 221 85 679 177 1,358 1,543 Bamako 336 126 389 71 1,462 1,558 Cotonou 296 115 387 142 1,389 1,881 Dakar 356 147 738 245 1,760 1,815 Lomé 238 78 250 60 1,252 1,727 Niamey 427 174 326 95 1,316 978 Ouagadougou 404 191 260 88 1,534 1,305
Sources: Based on Phase 1 of the 1-2-3 surveys of selected countries in the West African Economic and Monetary Union (WAEMU) conducted in 2001/02 by the Observatoire économique et statistique d’Afrique Subsaharienne (AFRISTAT); Développement, Institutions et Mondialisation (DIAL); and national statistics institutes.
274 URBAN LABOR MARKETS IN SUB-SAHARAN AFRICA
functions are fi rst estimated separately for men and women and for the diff erent sectors.
Th ere is no universally accepted set of conditioning variables that should be included in describing the causes of gender diff erentials, although the consensus seems to be that controls for productivity-related factors such as education, labor market experience, and marital status should be included. It is debatable whether job characteristics, occupation, and industry should be taken into account: if employers diff erentiate between men and women by tending to hire into certain occupations, then occupational assignment is an outcome of employer practices rather than an outcome of individual choice or productivity diff erences.3
It was not possible to account for workers’ actual experience in the labor market; potential experience, which can be viewed as refl ecting the “gross” time individuals have spent while in the labor force (measured as age minus years of schooling minus six, the legal age at school entry), was therefore used. Use of potential rather than actual experience represents a possible limitation of the study, because diff erences in labor force attachment by gender are important in explaining the size of the gender wage gap. Indeed, measures of women’s work experience are particularly prone to errors given the discontinuity of women’s labor market participation (women oft en leave the labor force to bear and raise children, for instance). Using proxy measures such as potential experience may thus overestimate experience for women; it may be a good approximation of experience for men with greater labor force attachment
(Nordman and Roubaud 2009).4
Concerns arise over possible sample selection biases in the estimations. One source is the fact that earnings are observed only when people work, and not everyone is working. Th e second source is the selective decision to work in the public sector rather than the private or informal sectors.
We address both issues using Lee’s two-stage approach to take account of the possible eff ect of endogenous paid-work participation and sector allocation on earnings (Lee 1983).5 In the fi rst stage, multinomial logit models of individual
i’s participation for pay in sector j are used to compute the correction terms kij
from the predicted probabilities Pij. Th e sectors considered in the multinomial
logit are the public sector, the formal private sector, and the informal sector. Th e reference category includes all other working-age individuals (inactive, unem-ployed, and unpaid workers).
A potential problem is that the multinomial logit may suff er from the inde-pendence of irrelevant alternatives (IIA) assumption, which in most cases is questionable. Hausman-type tests (Hausman and McFadden 1984) for each city and sector provide massive evidence that the IIA assumption is not violated, except in the informal sector of Bamako. In Lee’s procedure, identifi cation is achieved by including additional individual variables in the fi rst-stage selec-tion equaselec-tions that are omitted in the second-stage earnings regressions: a set
of dummies indicating relationship to the household head, the dependency ratio (number of non-working-age individuals divided by the total number of individuals in the household), and the household size.6 We assume that these variables do not infl uence earnings.
Oaxaca and Neumark’s traditional earnings decompositions. Th e most com-mon approach to identifying sources of gender wage gaps is the Oaxaca-Blinder decomposition (based on the seminal work of Oaxaca 1973 and Blinder 1973). In this approach, two separate standard Mincerian log earnings equations are estimated for men and women:
lnwm− lnwf = am (xm−xf) + (am−af)xf (9.2)
where wm and wf are the means of earnings by men and by women; xm and xf are
vectors containing the means of the independent variables for men and women; and am and af are the estimated coeffi cients. Th e fi rst term on the right-hand
side captures the earnings diff erential caused by diff erences in the individual characteristics of men and women. Th e second term is the earnings gap attrib-utable to diff erent returns to those characteristics or coeffi cients.
It can be argued that, under discrimination, men are paid competitive wages and women are underpaid. If this is the case, the coeffi cients for men should be taken as the nondiscriminatory wage structure, as in equation (9.2). Conversely, if employers pay women competitive wages but pay men more, then the women’s coeffi cients should be used as the nondiscriminatory wage structure. Th e issue is thus how to determine the wage structure a* that would prevail in the absence of discrimination. Th is choice poses the well-known index number problem. A priorineither appears preferable, but the decomposition can be quite sensitive to the selection made. Th e literature proposes diff erent weighting schemes to deal with the underlying index problem (Neumark 1988). We rely on the general decomposition proposed by Neumark, which can be written as follows:
lnwm− lnwf = a* (xm−xf) + [(am−a*)xm + (a*−af) xf]. (9.3)
Th is decomposition can be reduced to Oaxaca’s two special cases if it is assumed that there is no discrimination in the wage structure for men (that is, a* = am) or
for women (a* = af). Neumark shows that a*can be estimated using the weighted
average of the wage structures of men and women and advocates using the pooled sample to estimate a*. Th e fi rst term is the gender wage gap attributable to diff
er-ences in individual characteristics. Th e second and third terms capture the diff er-ence between the actual and pooled returns for men and women.
Earnings decompositions with sample selectivity. Neuman and Oaxaca (2004) show that sample selection complicates the interpretation of earnings decom-positions. Th ey off er several alternative decompositions, each based on diff er-ent assumptions and objectives. We use one of them that considers selectivity as a separate component. Th is technique has the advantage of not calling for
276 URBAN LABOR MARKETS IN SUB-SAHARAN AFRICA
any prior hypothesis regarding the links between individual characteristics and selectivity. An additional term in the decomposition measures the contribution of selection eff ects to the observed gender earnings gap, qmlm − qflf , where
l and q denote the mean correction term (generalized Mills ratio) and its esti-mated coeffi cient from each regression by gender. Hence, in the full sectoral decomposition that follows, when trying to account for sample selectivity, we consider the decomposition of off ered instead of actual earnings (that is, earn-ings net of the selection eff ects ql) (see Reimers 1983).
Full sectoral decomposition. Although the improvement proposed by
Neumark’s decomposition is attractive, it is not immune from criticisms of decomposition methods in general. One of them is that without evidence that employers care only about the proportion of each type of labor employed, it is not clear that the pooled coeffi cient is a good estimator of the nondiscrimina-tory wage structure. Th e full sectoral decomposition of Appleton, Hoddinott, and Krishnan (1999) takes into account diff erences in sectoral structures by gender by using an approach similar to Neumark’s and decomposing the gender earnings gap into three components.
Let W—m and W —
f be the means of the natural logs of men’s and women’s
earn-ings and pmj and pfj the sample proportions of men and women in sector j. Earn-ings can be written as the sum of sectoral earnEarn-ings weighted by the proportion of workers in each sector:
Wm W pmj mj j = =
∑
31 (9.4) Wf W pfj fj j = =∑
31 (9.5)One can decompose the diff erence in mean earnings into intrasectoral earn-ings diff erences and diff erences in proportions employed in the diff erent sectors. In order to overcome the index problem, Appleton, Hoddinott, and Krishnan (1999) assume the sectoral structure that would prevail in the absence of gender diff erences in the impact of individual characteristics on sectoral choice.
Let p*j be the proportion of workers in sector j under this assumption. Appleton,
Hoddinott, and Krishnan decompose the diff erence in mean earnings as follows:
Wm Wf p Wj W W p p W p p j mj fj mj mj j fj j fj j j − = − + − + − = = =
∑
* *∑
* ( ) ( ) ( ) 1 3 1 3 1 3∑
∑
(9.6)Th e fi rst term can be decomposed using the Neumark decomposition pre-sented earlier. Th e second and third terms can be decomposed further, in order to distinguish diff erences arising from diff erences in individual characteristics from diff erences arising from diff erences in returns to these characteristics. One can derive the average probability of being employed in a given sector for men and women from the estimation of pooled and separate multinomial logit models for each gender. Th ese mean probabilities are denoted by p*mj and p*fj .
Embedding the self-selection process in equation (9.6) allows the full decom-position to be written as follows:
Wm Wf p xj mj xfj j p x p x j j mj mj j j j fj j − = − + − + = =
∑
* *∑
* * * * ( )b (b b ) (b 1 3 1 3 −− + − + − + − = = =∑
∑
∑
bfj j mj mj j fj j fj j j mj mj W p p W p p W p ) ( * *) ( * *) ( 1 3 1 3 1 3 pp W p p mj j fj fj fj j * * ) ( ) = =∑
∑
+ − 1 3 1 3 (9.7) Th e fi rst three terms are similar to Neumark’s decompositions of within-sector earnings gaps. Th e fourth and fi fth terms measure the diff erence in earn-ings caused by diff erences in the distribution of men and women in diff erent sectors. Th e last two terms account for diff erences in earnings resulting from the deviations between predicted and actual sectoral compositions of men and women not accounted for by diff erences in individual characteristics.Earnings gap decomposition for ethnic groups. Extending decomposition methods developed and traditionally used to analyze possible discrimination against women to the study of earnings diff erentials between ethnic groups is not straightforward. One of the main problems is related to the defi nition and measurement of ethnicity: what defi nes an ethnic group? In developed countries, there exist confl icting views and diff erent traditions regarding the collection of data on ethnic origin. Anglo-Saxon societies are accustomed to measuring and analyzing data on so-called racial and ethnic groups; many other countries refuse to categorize individuals using ethnic or racial criteria and, as a result, do not collect statistical data on ethnic origin.7
In Africa, the notion of ethnicity also raises a number of questions that social scientists have debated extensively (Bayart 1989). Anthropologists have shown that ethnic groups are not characterized by genetic homogeneity. Depending on coun-tries and contexts, the constitution of ethnic groups appears to be more or less recent and their defi nition malleable. Some groups have their origin in a common myth or ancestor; others share only a language and culture. Some “ethnic groups” have been constructed by other groups, following migration, invasion, or colonization.
Th ese various origins notwithstanding, ethnicity plays an important role in social relations in many African countries. Th ere is, for instance, strong evi-dence of high levels of endogamy (marriage within a specifi c group, as required by custom or law), not only in rural areas, where ethnic homogeneity is oft en observed, but also in urban areas, where diff erent ethnic groups cohabit. In recent years, economists have examined the importance of ethnicity to develop-ment and growth. Th e seminal paper is the study by Easterly and Levine (1997), who conclude that “Africa’s growth tragedy” is in part related to its high level of ethnic diversity, which results in poor institutional functioning. Th is conclusion remains a subject of debate (see Bossuroy 2007 for a discussion).
278 URBAN LABOR MARKETS IN SUB-SAHARAN AFRICA
Th is chapter focuses on the impact of ethnicity on labor market outcomes mea-sured through earnings. To apply the methods developed for the analysis of the gender earnings gap, one is inclined to construct a dichotomous variable identify-ing either a possibly favored or discriminated-against ethnic group. Data collec-tion on ethnicity at the household or individual level is common in Africa: most household and employment surveys include a variable indicating ethnic group. However, given the diversity of national contexts, two diffi culties arise. Th e fi rst is related to identifying a priori a discriminated-against ethnic group. Should one consider the majority ethnic group as favored? Or should one consider instead the group to which the head of state belongs? Th e second diffi culty arises because of our comparative framework. How does belonging to diff erent groups compare across countries? For instance, is being a Mossi in Ouagadougou (77 percent of the population) comparable to being a Bambara in Bamako (34 percent of the popu-lation). We consider various aspects of possible ethnic discrimination on urban labor markets while keeping in mind the diff erent national contexts.
Results
We now turn to the presentation and analysis of results obtained using the dif-ferent approaches presented above.
Neumark Decomposition of Gender and Ethnic Earnings Gaps
Th is section analyzes gender and ethnic earnings gaps using traditional
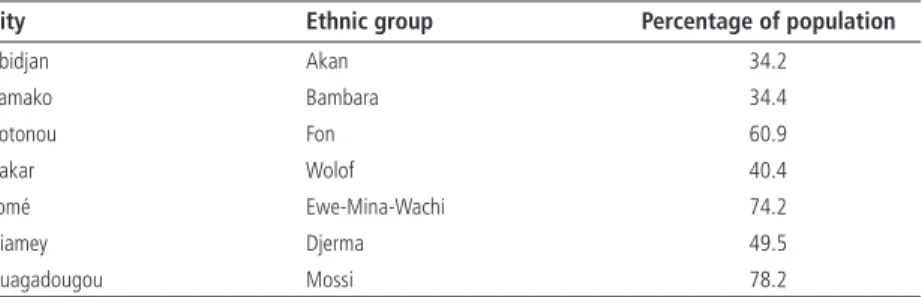
decomposition approaches. We identify the largest ethnic group in each city (table 9.2). Th ese groups represent a majority of the population in three of seven cities (Cotonou, Lomé, and Ouagadougou; see the annex for details).
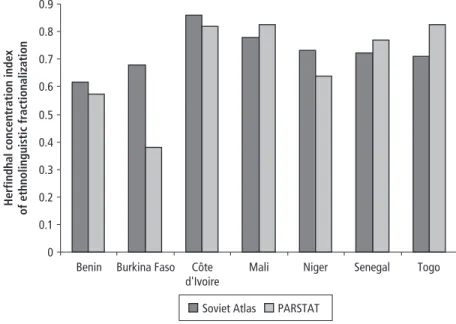
In six of the seven cities, the largest ethnic group corresponds to the majority group at the national level. Th e sole exception is Niamey, where the Djerma are the largest ethnic group but the Haoussa represent 54 percent of the population of Niger. Figure 9.1 reports two Herfi ndhal concentration indices for ethnolinguistic fractionalization (ELF) in each country.8 Th e fi rst is computed at the national Table 9.2 Largest Ethnic Group in Seven Cities in West Africa, 2001/02
City Ethnic group Percentage of population
Abidjan Akan 34.2 Bamako Bambara 34.4 Cotonou Fon 60.9 Dakar Wolof 40.4 Lomé Ewe-Mina-Wachi 74.2 Niamey Djerma 49.5 Ouagadougou Mossi 78.2
level; the second is computed for the seven cities, using the 1-2-3 survey data. Levels are similar across all countries except Burkina Faso, where the ELF index appears to be much lower in the capital than at the country level. Th is diff erence stems from the fact that the ethnic majority group (Mossi) represents 78 percent of the population in Ouagadougou and only 50 percent at the national level.
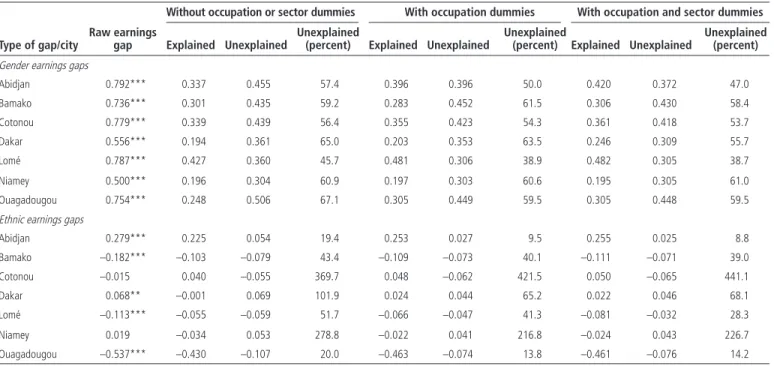
Table 9.3 reports the decomposition of earnings gaps based on Neumark’s approach. A number of results are worth emphasizing. Raw gender earnings gaps are large and signifi cant, and they range widely across cities (from 50.0 in Niamey to 79.2 in Abidjan). Th ese fi gures indicate that, on average, women’s earnings in Abidjan are 20.8 percent of men’s earnings. Raw gender earnings gaps are positive by construction, because they are computed as the diff erence between a “high group” and a “low group.” In the sample of countries, women always correspond to the low group. In contrast, the largest ethnic group cor-responds to the high group in Abidjan, Dakar, and Niamey and to the low group
in Bamako, Cotonou, Lomé, and Ouagadougou.9
Figure 9.1 Herfindhal Concentration Indices of Ethnolinguistic Fractionalization in Seven Countries in West Africa, 2001/02
Sources: Soviet Atlas data are from Fearon 2003; survey data are from Phase 1 of the 1-2-3 surveys of selected countries (see table 9.1 for details).
Note: The ELF measure, available for 129 countries, captures the likelihood that two people chosen at random will be from different ethnic groups. It is calculated using a simple Herfindahl concentration index. The Herfind-ahl concentration formula is ELF si
n = − = ∑ 1 2 1 1
, where si is the share of group i (i = 1, . . . , n). The Soviet Atlas data
were compiled by Soviet ethnographers in the early 1960s and published in the Atlas Narodov Mira in 1964. ELF = ethnolinguistic fractionalization; PARSTAT = Programme d'Appui Régional à la Statistique.
0 0.1 0.2 0.3 0.4 0.5 0.6
Herfindhal concentration index
of ethnolinguistic fractionalization
0.7 0.8 0.9
Benin Burkina Faso Côte d'Ivoire
Mali Niger Senegal Togo
280
Table 9.3 Neumark Decompositions of Gender and Ethnic Earnings Gaps in Seven Cities in West Africa, 2001/02
Without occupation or sector dummies With occupation dummies With occupation and sector dummies Type of gap/city
Raw earnings
gap Explained Unexplained
Unexplained
(percent) Explained Unexplained
Unexplained
(percent) Explained Unexplained
Unexplained (percent)
Gender earnings gaps
Abidjan 0.792*** 0.337 0.455 57.4 0.396 0.396 50.0 0.420 0.372 47.0 Bamako 0.736*** 0.301 0.435 59.2 0.283 0.452 61.5 0.306 0.430 58.4 Cotonou 0.779*** 0.339 0.439 56.4 0.355 0.423 54.3 0.361 0.418 53.7 Dakar 0.556*** 0.194 0.361 65.0 0.203 0.353 63.5 0.246 0.309 55.7 Lomé 0.787*** 0.427 0.360 45.7 0.481 0.306 38.9 0.482 0.305 38.7 Niamey 0.500*** 0.196 0.304 60.9 0.197 0.303 60.6 0.195 0.305 61.0 Ouagadougou 0.754*** 0.248 0.506 67.1 0.305 0.449 59.5 0.305 0.448 59.5
Ethnic earnings gaps
Abidjan 0.279*** 0.225 0.054 19.4 0.253 0.027 9.5 0.255 0.025 8.8 Bamako –0.182*** –0.103 –0.079 43.4 –0.109 –0.073 40.1 –0.111 –0.071 39.0 Cotonou –0.015 0.040 –0.055 369.7 0.048 –0.062 421.5 0.050 –0.065 441.1 Dakar 0.068** –0.001 0.069 101.9 0.024 0.044 65.2 0.022 0.046 68.1 Lomé –0.113*** –0.055 –0.059 51.7 –0.066 –0.047 41.3 –0.081 –0.032 28.3 Niamey 0.019 –0.034 0.053 278.8 –0.022 0.041 216.8 –0.024 0.043 226.7 Ouagadougou –0.537*** –0.430 –0.107 20.0 –0.463 –0.074 13.8 –0.461 –0.076 14.2
Sources: Based on Phase 1 of the 1-2-3 surveys of selected countries (see table 9.1 for details).
Gender diff erences in the distribution of individual characteristics related to productivity—such as education and experience—explain less than half of the raw gender gap in six of the seven cities. Lomé is an exception, with diff erences in individual characteristics explaining almost 55 percent of the gap. Including variables related to the type of occupation decreases somewhat the unexplained share of the raw gender gap. Th is decrease appears to be substantial in Abidjan, Lomé, and Ouagadougou.
Men are systematically favored over women in all cities in the sample. In contrast, the largest ethnic groups do not appear to have a systematically favor-able position in the urban labor markets. Only in Abidjan and Dakar is the gap both signifi cant and favorable for the largest ethnic group (in Abidjan, the Akan earn 28 percent more than other ethnic groups; in Dakar, the Wolof earn 7 percent more than other ethnic groups). In Bamako, Lomé, and Ouagadou-gou, members of the largest ethnic group earn signifi cantly less than members of other ethnic groups. In Ouagadougou, lower average earnings by the Mossi could be related to their spatial distribution: they represent 78 percent of the population of the capital city but just 50 percent of the population of Burkina Faso. It could be that only better-performing non-Mossi migrate to the capital. Th e decomposition of ethnic earnings gaps reveals markedly diff erent results across cities. In Abidjan, diff erences in the distribution of individual characteris-tics explain more than 85 percent of the gap, leaving little room for discrimination (the unexplained share). In Bamako, the unexplained share of the gap is 43 percent (39 percent once occupational and sector dummies are included in the regres-sions). In Dakar, 100 percent of the gap is left unexplained until job characteris-tics related to occupation and sector are introduced. In Ouagadougou, where the majority ethnic group (Mossi) earns less than other groups, the gap is also in large part explained by diff erences in the distribution of individual characteristics, such as education and experience; just 20 percent of the diff erential is unexplained.
Full Decomposition of Gender Earnings Gap
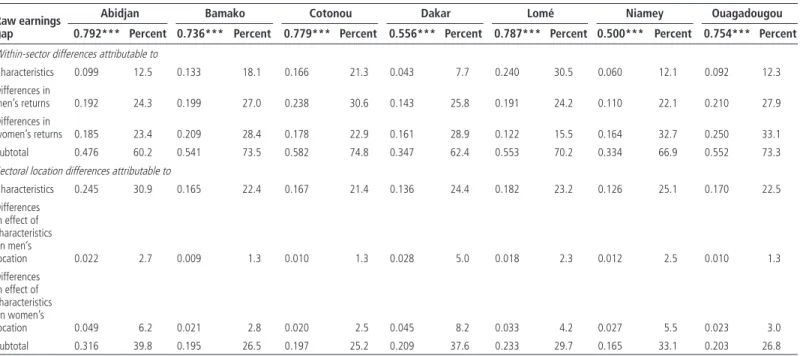
Th ere are at least four types of labor markets in most developing countries: rural (or agricultural), public, formal private, and informal. Each of these markets has its own characteristics, such as job seasonality, uncertainty of demand, the nature of contracts, and the structure of wages and earnings. As a result, gender and ethnic labor allocation across these sectors can be expected to contribute to earnings gaps. Following Appleton, Hoddinott, and Krishnan (1999) and Nordman and Roubaud (2009), we provide comparable estimates of the size and determinants of gender earnings gaps using the full decomposition method described previ-ously. Given that we are analyzing urban labor markets, only three types of labor markets are examined: public, formal private, and informal. Th e results are reported without (table 9.4) and with (table 9.5) correction for selectivity of participation and sectoral allocation.
282
Table 9.4 Full Decomposition of Gender Earnings Gap in Seven Cities in West Africa without Correction for Selectivity, 2001/02 Raw earnings
gap
Abidjan Bamako Cotonou Dakar Lomé Niamey Ouagadougou 0.792*** Percent 0.736*** Percent 0.779*** Percent 0.556*** Percent 0.787*** Percent 0.500*** Percent 0.754*** Percent
Within-sector differences attributable to
Characteristics 0.099 12.5 0.133 18.1 0.166 21.3 0.043 7.7 0.240 30.5 0.060 12.1 0.092 12.3 Differences in men’s returns 0.192 24.3 0.199 27.0 0.238 30.6 0.143 25.8 0.191 24.2 0.110 22.1 0.210 27.9 Differences in women’s returns 0.185 23.4 0.209 28.4 0.178 22.9 0.161 28.9 0.122 15.5 0.164 32.7 0.250 33.1 Subtotal 0.476 60.2 0.541 73.5 0.582 74.8 0.347 62.4 0.553 70.2 0.334 66.9 0.552 73.3
Sectoral location differences attributable to
Characteristics 0.245 30.9 0.165 22.4 0.167 21.4 0.136 24.4 0.182 23.2 0.126 25.1 0.170 22.5 Differences in effect of characteristics on men’s location 0.022 2.7 0.009 1.3 0.010 1.3 0.028 5.0 0.018 2.3 0.012 2.5 0.010 1.3 Differences in effect of characteristics on women’s location 0.049 6.2 0.021 2.8 0.020 2.5 0.045 8.2 0.033 4.2 0.027 5.5 0.023 3.0 Subtotal 0.316 39.8 0.195 26.5 0.197 25.2 0.209 37.6 0.233 29.7 0.165 33.1 0.203 26.8
Sources: Based on Phase 1 of the 1-2-3 surveys of selected countries (see table 9.1 for details).
Note: The raw earnings gap is defined as log(men’s earnings) – log(women’s earnings).
283
gap 0.970*** Percent 2.050*** Percent 1.060*** Percent 1.361*** Percent 361*** Percent 0.885*** Percent 1.237*** Percent
Within-sector differences in earnings attributable to
Characteristics 0.107 11.1 0.198 9.7 0.205 19.3 0.053 3.9 0.250 29.2 0.074 8.4 0.144 11.7 Differences in men’s returns 0.204 21.0 0.729 35.6 0.343 32.3 0.408 30.0 0.163 19.0 0.245 27.6 0.423 34.2 Differences in women’s returns 0.235 24.2 0.956 46.6 0.334 31.5 0.547 40.2 0.009 1.0 0.355 40.2 0.490 39.6 Subtotal 0.546 56.3 1.883 91.9 0.882 83.1 1.008 74.1 0.422 49.2 0.674 76.2 1.057 85.5 Differences between sectoral locations attributable to
Characteristics 0.319 32.9 0.150 7.3 0.154 14.5 0.212 15.6 0.331 38.6 0.162 18.3 0.151 12.2 Differences in effect of characteristics on men’s location 0.042 4.4 0.015 0.7 0.012 1.1 0.065 4.8 0.032 3.8 0.013 1.5 0.004 0.3 Differences in effect of characteristics on women’s location 0.062 6.4 0.002 0.1 0.013 1.3 0.076 5.6 0.072 8.4 0.036 4.1 0.024 2.0 Subtotal 0.423 43.7 0.167 8.1 0.179 16.9 0.353 26.0 0.435 50.8 0.211 23.9 0.179 14.5 Sources: Based on Phase 1 of the 1-2-3 surveys of selected countries (see table 9.1 for details).
Note: The earnings gap is defined as log(men’s earnings) – log(women’s earnings). Decomposition is based on observed earnings.
284 URBAN LABOR MARKETS IN SUB-SAHARAN AFRICA
Within-sector diff erences in earnings account for the largest share of the gen-der gap, with contributions ranging from 60 percent in Abidjan to 75 percent in Cotonou. Th e remaining diff erence can be attributed to gender diff erences in the proportions of workers in each sector. Th e positive sum of these three terms for all cities implies that the diff erences in sectoral locations favor men. For instance, the gender earnings gap would have been 40 percent smaller in Abidjan if men and women had been equally distributed across the three sectors, because fewer women work in the higher-paying sectors.
Diff erences attributable to individual characteristics account for a relatively small share of within-sector diff erences in earnings, ranging from 10 percent in Dakar to 41 percent in Lomé (not shown in the table). Diff erences attributable to individual characteristics account for a very large share of the sectoral loca-tion diff erences between men and women, ranging from 65 percent in Dakar to 85 percent in Bamako and Cotonou.
Diff erences attributable to diff erences in the returns of men and women are of the same order of magnitude, indicating that both “discrimination” against women and “nepotism” in favor of men contribute to the gender earnings gap. Both fac-tors also contribute to diff erences in sectoral location but at a much lower level.
Taking into account selectivity leads to analyzing the decomposition not of actual earnings but of off ered earnings, computed using the coeffi cients of the selection term in the earnings equations. Th e results in table 9.5 show that off ered earnings gaps are much higher in Cotonou, Bamako, and Dakar and lower in the other cities. Higher earnings gaps when sectoral selectivity is accounted for are not systematically associated with a larger contribution of sectoral location diff erences, however; except in Niamey, within-sector earnings diff erences remain the main contributor to gender gaps.
Ethnic Earnings Diff erentials
Concerning ethnic earnings gaps, the results in table 9.6 (without correcting for selectivity) indicate that the contribution of sectoral location to explaining the gap varies markedly between cities. In Abidjan, diff erences in sectoral location explain 86 percent of the gap, of which 75 percent is accounted for by diff erences in individual characteristics. In Bamako, within-sector diff erences in earnings account for 77 percent of the earnings gap, of which 33 percent is attribut-able to diff erences in individual characteristics; both nepotism (16 percent) and discrimination (28 percent) signifi cantly contribute to the gap through their contribution to within-sector diff erences in earnings. In Ouagadougou, the gap can be attributed almost evenly to diff erences in sectoral location (53 percent) and within-sector earnings (47 percent).
Sectoral location diff erences are almost entirely explained by diff erences in individual characteristics. In Lomé, in contrast to Bamako, the deviation in the eff ect of individual characteristics on location explains a large share of sec-toral location diff erences. In contrast to the results obtained for gender, where
285
gap 0.279*** Percent –0.182*** Percent –0.015 Percent 0.068** Percent –0.113*** Percent 0.019 Percent –0.537*** Percent Within-sector differences in earnings attributable to
Characteristics 0.004 1.5 –0.061 33.3 0.014 –96.0 0.021 31.6 0.009 –8.0 –0.049 –258.9 –0.156 29.0 Differences in majority group returns 0.011 3.9 –0.029 15.9 –0.039 262.9 0.034 49.9 –0.023 19.9 0.019 102.8 –0.076 14.2 Differences in minority group returns 0.024 8.5 –0.051 28.2 –0.027 179.3 0.051 75.3 –0.009 7.8 0.024 125.1 –0.019 3.5 Subtotal 0.039 13.9 –0.141 77.4 –0.052 346.2 0.106 156.8 –0.023 19.7 –0.006 –31.0 –0.251 46.7
Differences between sectoral location attributable to
Characteristics 0.181 64.7 –0.050 27.4 0.018 –120.0 –0.009 –13.7 –0.015 13.2 –0.008 –41.8 –0.250 46.5 Differences in effect of characteristics on majority group location 0.017 5.9 0.003 –1.7 0.012 –78.1 –0.012 –17.0 –0.053 47.2 0.017 88.0 –0.028 5.2 Differences in effect of characteristics on minority group location 0.043 15.5 0.006 –3.1 0.007 –48.2 –0.018 –26.0 –0.022 19.8 0.016 84.9 –0.008 1.5 Subtotal 0.241 86.1 –0.041 22.6 0.037 –246.3 –0.039 –56.7 –0.090 80.2 0.025 131.1 –0.286 53.2
Sources: Based on Phase 1 of the 1-2-3 surveys of selected countries (see table 9.1 for details).
Note: The earnings gap is defined as log(majority group earnings) – log(minority group earnings). Decomposition is based on observed earnings.
286 URBAN LABOR MARKETS IN SUB-SAHARAN AFRICA
sectoral location systematically increases the gap in favor of men, in some cities sectoral location plays a compensating role in observed earnings gaps.
Taking selectivity into account changes some measures of the gaps (table 9.7). Th e gap decreases in Abidjan, Dakar, and Ouagadougou and increases in Bamako. In Lomé, the gap is actually reversed, possibly indicating that on average the off ered earnings of the largest ethnic group are higher than they are for other ethnic groups. Th is puzzling result requires further investigation (for instance, in order to understand the features of earnings negotiations, one would need to know the ethnic group of the employer).
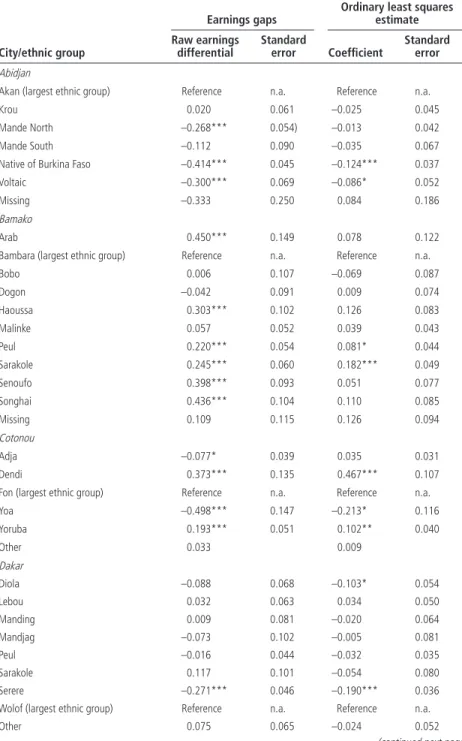
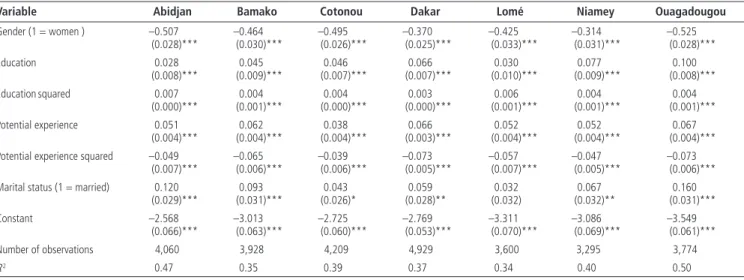
Th e largest number of ethnic groups is in Bamako and Ouagadougou (10), fol-lowed by Dakar (9); Lomé and Niamey (7); and Abidjan and Cotonou (6) (table 9A.2). Table 9.8 reports the coeffi cients of the dummies indicating each ethnic group in regressions of city-level earnings equations. In the fi rst column, ethnic group dummies are the only regressors. A set of usual controls is introduced in the specifi cation reported in the second column (table 9.9 reports the coeffi cients for these variables).
Two results are evident from these regressions. First, there is at least one signifi cant coeffi cient on ethnic dummies in all cities, indicating diff erences in average earnings of diff erent ethnic groups.10 Second, most of these diff erences diminish—and in some cases vanish—once other individual characteristics are controlled for. Overall, dominant ethnic groups do not seem to be favored on the labor market once one controls for productivity-related individual charac-teristics. On the contrary, in Benin, Burkina Faso, and Mali, some nondomi-nant groups have higher earnings than the dominondomi-nant group aft er controlling for other factors. Moreover, none of the favored groups seems to be related to the ethnicity of the head of state at the time of the survey.11
Conclusion
Th e fi ndings in this chapter are important for two main reasons. First, interna-tional comparisons of earnings gaps are still rare in Africa. Th e 1-2-3 surveys used here rely on identical methodologies and virtually identical questionnaires in each city, making for totally comparable results.
Second, we address the issue of sample selectivity associated with endog-enous sector choices, because gender and ethnic labor allocation between these sectors can be expected to contribute to earnings gaps. Following Appleton, Hoddinott, and Krishnan (1999), we then provide comparable estimates of the size and determinants of gender and ethnic earnings gaps using decomposition methods that address the sectoral allocation issue.
Th e results show that gender earnings gaps are large in all seven cities in our sample and that gender diff erences in the distribution of individual character-istics usually explain less than half of the raw gender gap. In contrast, dominant
287
gap 0.254*** Percent –0.224*** Percent 0.021 Percent 0.048 Percent 0.127*** Percent –0.003 Percent –0.403*** Percent Within-sector differences in earnings attributable to
Characteristics 0.020 –7.8 –0.042 18.8 0.013 64.1 0.022 45.9 0.021 16.6 –0.043 1335.8 –0.091 22.7 Differences in majority group returns 0.016 –6.3 –0.042 18.5 –0.036 –169.6 0.020 42.5 0.110 86.9 0.000 14.2 –0.029 7.1 Differences in minority group returns 0.001 –0.4 –0.078 34.6 –0.024 –113.4 0.042 88.3 0.090 70.8 –0.012 376.7 0.021 –5.1 Subtotal 0.037 –14.5 –0.162 71.9 –0.047 –218.9 0.084 176.7 0.221 174.3 –0.055 1726.7 –0.099 24.7
Sectoral location differences attributable to
Characteristics 0.213 84.2 –0.080 35.8 0.029 140.8 –0.009 –19.0 –0.010 –7.9 –0.016 492.6 –0.266 66.1 Differences in effect of characteristics on majority group location 0.027 10.6 0.004 –2.0 0.023 109.6 –0.007 –15.2 –0.030 –23.5 0.025 –770.0 –0.028 6.9 Differences in effect of characteristics on minority group location 0.050 19.8 0.013 –5.7 0.014 68.6 –0.020 –42.5 –0.055 –42.9 0.043 –1349.2 –0.010 2.4 Subtotal 0.290 114.6 –0.063 28.1 0.066 319.0 –0.036 –76.7 –0.095 –74.3 0.052 –1626.6 –0.304 75.4
Sources: Based on Phase 1 of the 1-2-3 surveys of selected countries (see table 9.1 for details).
Note: The earnings gap is defined as log(majority group earnings) – log(minority group earnings). Decomposition is based on observed earnings.
288 URBAN LABOR MARKETS IN SUB-SAHARAN AFRICA
Table 9.8 Ethnic Earnings Differentials in Seven Cities in West Africa, 2001/02
City/ethnic group
Earnings gaps
Ordinary least squares estimate Raw earnings
differential
Standard
error Coeffi cient
Standard error Abidjan
Akan (largest ethnic group) Reference n.a. Reference n.a.
Krou 0.020 0.061 –0.025 0.045
Mande North –0.268*** 0.054) –0.013 0.042
Mande South –0.112 0.090 –0.035 0.067
Native of Burkina Faso –0.414*** 0.045 –0.124*** 0.037
Voltaic –0.300*** 0.069 –0.086* 0.052
Missing –0.333 0.250 0.084 0.186
Bamako
Arab 0.450*** 0.149 0.078 0.122
Bambara (largest ethnic group) Reference n.a. Reference n.a.
Bobo 0.006 0.107 –0.069 0.087 Dogon –0.042 0.091 0.009 0.074 Haoussa 0.303*** 0.102 0.126 0.083 Malinke 0.057 0.052 0.039 0.043 Peul 0.220*** 0.054 0.081* 0.044 Sarakole 0.245*** 0.060 0.182*** 0.049 Senoufo 0.398*** 0.093 0.051 0.077 Songhai 0.436*** 0.104 0.110 0.085 Missing 0.109 0.115 0.126 0.094 Cotonou Adja –0.077* 0.039 0.035 0.031 Dendi 0.373*** 0.135 0.467*** 0.107
Fon (largest ethnic group) Reference n.a. Reference n.a.
Yoa –0.498*** 0.147 –0.213* 0.116 Yoruba 0.193*** 0.051 0.102** 0.040 Other 0.033 0.009 Dakar Diola –0.088 0.068 –0.103* 0.054 Lebou 0.032 0.063 0.034 0.050 Manding 0.009 0.081 –0.020 0.064 Mandjag –0.073 0.102 –0.005 0.081 Peul –0.016 0.044 –0.032 0.035 Sarakole 0.117 0.101 –0.054 0.080 Serere –0.271*** 0.046 –0.190*** 0.036 Wolof (largest ethnic group) Reference n.a. Reference n.a.
Other 0.075 0.065 –0.024 0.052
Lomé
Akposso-Akebou 0.121 0.136 –0.003 0.111
Ana-Ife 0.126 0.107 0.005 0.087
Ewe-Mina-Wachi (largest ethnic group) Reference n.a. Reference n.a.
Kabye-Tem 0.058 0.055 0.001 0.045
Para-Gourma-Akan 0.068 0.092 0.028 0.075 Other Togolese –0.042 0.191 0.062 0.156 Other non-Togolese 0.297*** 0.081 0.276 0.066
Niamey
Djerma (largest ethnic group) Reference n.a. Reference n.a.
Gourma 0.542* 0.285 0.240 0.223 Haoussa –0.004 0.044 –0.068* 0.035 Peul 0.167** 0.083 0.041 0.065 Touareg –0.237*** 0.089 –0.102 0.070 Other –0.143* 0.075 –0.046 0.059 Missing –0.259 0.199 –0.075 0.156 Ouagadougou Bissa 0.379*** 0.095 0.093 0.070 Bobo 0.561*** 0.165 0.168 0.120 Dagari 0.474*** 0.155 0.083 0.113 Gourmantche 0.781*** 0.178 0.197 0.130 Gurunsi 0.613*** 0.099 0.073*** 0.099
Mossi (largest ethnic group) Reference n.a. Reference n.a. Other Manding 0.555*** 0.092 0.136** 0.068
Peul 0.552*** 0.137 0.161 0.100
Senoufo 1.335*** 0.203 0.370** 0.149
Other 0.498*** 0.117 0.109 0.086
Missing –0.141 0.209 –0.130 0.152
Sources: Based on Phase 1 of the 1-2-3 surveys of selected countries (see table 9.1 for details).
Note: n.a. = Not applicable.
* significant at the 10 percent level, ** significant at the 5 percent level, *** significant at the 1 percent level. Table 9.8 (continued)
Earnings gaps
Ordinary least squares estimate City/ethnic group
Raw earnings differential
Standard
error Coeffi cient
Standard error
ethnic groups do not appear to have a systematically favorable position in the urban labor markets in our sample, and observed gaps are small relative to gen-der gaps. Moreover, “favored” minority groups do not seem to be related to the ethnicity of the head of state at the time of the survey.
Whatever the sign of the gap, the contribution of diff erences in the distri-bution of individual characteristics varies markedly across cities. Taking into
290
Table 9.9 Control Variables for Ethnic Earnings Differentials in Seven Cities in West Africa, 2001/02
Variable Abidjan Bamako Cotonou Dakar Lomé Niamey Ouagadougou
Gender (1 = women ) –0.507 –0.464 –0.495 –0.370 –0.425 –0.314 –0.525 (0.028)*** (0.030)*** (0.026)*** (0.025)*** (0.033)*** (0.031)*** (0.028)*** Education 0.028 0.045 0.046 0.066 0.030 0.077 0.100 (0.008)*** (0.009)*** (0.007)*** (0.007)*** (0.010)*** (0.009)*** (0.008)*** Educationsquared 0.007 0.004 0.004 0.003 0.006 0.004 0.004 (0.000)*** (0.001)*** (0.000)*** (0.000)*** (0.001)*** (0.001)*** (0.001)*** Potential experience 0.051 0.062 0.038 0.066 0.052 0.052 0.067 (0.004)*** (0.004)*** (0.004)*** (0.003)*** (0.004)*** (0.004)*** (0.004)***
Potential experience squared –0.049 –0.065 –0.039 –0.073 –0.057 –0.047 –0.073
(0.007)*** (0.006)*** (0.006)*** (0.005)*** (0.007)*** (0.005)*** (0.006)***
Marital status (1 = married) 0.120 0.093 0.043 0.059 0.032 0.067 0.160
(0.029)*** (0.031)*** (0.026)* (0.028)** (0.032) (0.032)** (0.031)***
Constant –2.568 –3.013 –2.725 –2.769 –3.311 –3.086 –3.549
(0.066)*** (0.063)*** (0.060)*** (0.053)*** (0.070)*** (0.069)*** (0.061)***
Number of observations 4,060 3,928 4,209 4,929 3,600 3,295 3,774
R2 0.47 0.35 0.39 0.37 0.34 0.40 0.50
Sources: Based on Phase 1 of the 1-2-3 surveys of selected countries (see table 9.1 for details).
Note: Figures in parentheses are standard errors.
account diff erences in sectoral locations in the decomposition of gender earn-ings gaps provides evidence that within-sector diff erences in earnearn-ings account for the largest share of the gender gap and that diff erences in sectoral locations are always more favorable to men than to women. In contrast, full decomposi-tion of ethnic earnings gaps indicates that sectoral locadecomposi-tion sometimes plays a “compensating” role. Looking at fi ner levels of ethnic disaggregation con-fi rms that ethnic earnings diff erentials are systematically smaller than gender diff erentials.
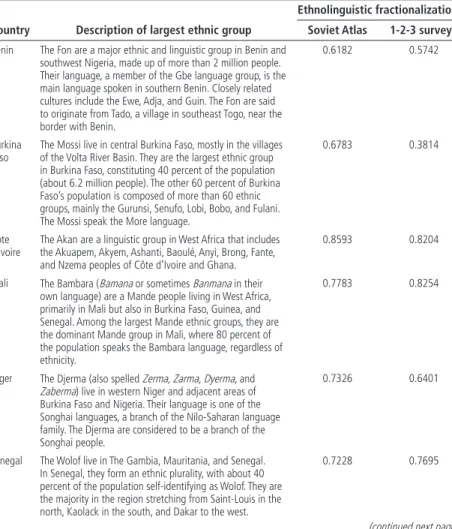
Annex: Ethnicity in Seven West African Countries
Table 9A.1 Ethnolinguistic Fractionalization in Seven Countries in West AfricaCountry
Ethnolinguistic fractionalization Description of largest ethnic group Soviet Atlas 1-2-3 surveys
Benin The Fon are a major ethnic and linguistic group in Benin and southwest Nigeria, made up of more than 2 million people. Their language, a member of the Gbe language group, is the main language spoken in southern Benin. Closely related cultures include the Ewe, Adja, and Guin. The Fon are said to originate from Tado, a village in southeast Togo, near the border with Benin.
0.6182 0.5742
Burkina Faso
The Mossi live in central Burkina Faso, mostly in the villages of the Volta River Basin. They are the largest ethnic group in Burkina Faso, constituting 40 percent of the population (about 6.2 million people). The other 60 percent of Burkina Faso’s population is composed of more than 60 ethnic groups, mainly the Gurunsi, Senufo, Lobi, Bobo, and Fulani. The Mossi speak the More language.
0.6783 0.3814
Côte d’Ivoire
The Akan are a linguistic group in West Africa that includes the Akuapem, Akyem, Ashanti, Baoulé, Anyi, Brong, Fante, and Nzema peoples of Côte d’Ivoire and Ghana.
0.8593 0.8204
Mali The Bambara (Bamana or sometimes Banmana in their own language) are a Mande people living in West Africa, primarily in Mali but also in Burkina Faso, Guinea, and Senegal. Among the largest Mande ethnic groups, they are the dominant Mande group in Mali, where 80 percent of the population speaks the Bambara language, regardless of ethnicity.
0.7783 0.8254
Niger The Djerma (also spelled Zerma, Zarma, Dyerma, and
Zaberma) live in western Niger and adjacent areas of Burkina Faso and Nigeria. Their language is one of the Songhai languages, a branch of the Nilo-Saharan language family. The Djerma are considered to be a branch of the Songhai people.
0.7326 0.6401
Senegal The Wolof live in The Gambia, Mauritania, and Senegal. In Senegal, they form an ethnic plurality, with about 40 percent of the population self-identifying as Wolof. They are the majority in the region stretching from Saint-Louis in the north, Kaolack in the south, and Dakar to the west.
0.7228 0.7695
292 URBAN LABOR MARKETS IN SUB-SAHARAN AFRICA
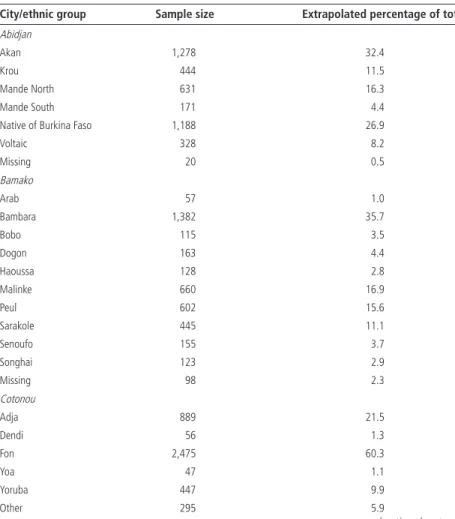
Table 9A.2 Ethnic Composition of Sample in Seven Cities in West Africa, 2001/02
City/ethnic group Sample size Extrapolated percentage of total
Abidjan
Akan 1,278 32.4
Krou 444 11.5
Mande North 631 16.3
Mande South 171 4.4
Native of Burkina Faso 1,188 26.9
Voltaic 328 8.2 Missing 20 0.5 Bamako Arab 57 1.0 Bambara 1,382 35.7 Bobo 115 3.5 Dogon 163 4.4 Haoussa 128 2.8 Malinke 660 16.9 Peul 602 15.6 Sarakole 445 11.1 Senoufo 155 3.7 Songhai 123 2.9 Missing 98 2.3 Cotonou Adja 889 21.5 Dendi 56 1.3 Fon 2,475 60.3 Yoa 47 1.1 Yoruba 447 9.9 Other 295 5.9
(continued next page)
Togo The Ewe live in southeastern Benin, Ghana, and Togo. They speak the Ewe language and are related to other speakers of Gbe languages, including the Fon and the Adja of Benin and Togo. Their original homeland is Oyo, in western Nigeria.
0.7107 0.8254
Sources: Soviet Atlas data are from Fearon 2003; survey data are from Phase 1 of the 1-2-3 surveys of selected countries (see table 9.1 for details).
Note: The ELF measure, available for 129 countries, captures the likelihood that two people chosen at random will be from different ethnic groups. It is calculated using a simple Herfindahl concentration index. The Herfindahl concentration formula is ELF si
n = − = ∑ 1 2 1 1
, where si is the share of group i (i = 1, . . . , n). The Soviet Atlas data
were compiled by Soviet ethnographers in the early 1960s and published in the Atlas Narodov Mira in 1964. ELF = ethnolinguistic fractionlization.
Table 9A.1 (continued)
Country
Ethnolinguistic fractionalization Description of largest ethnic group Soviet Atlas 1-2-3 surveys
Dakar Diola 278 5.8 Lebou 337 9.1 Manding 191 3.9 Mandjag 115 2.3 Peul 822 16.0 Sarakole 118 2.4 Serere 747 16.0 Wolof 2,008 38.1 Other 313 6.3 Lomé Akposso-Akebou 66 1.8 Ana-Ife 109 3.1 Ewe-Mina-Wachi 2,582 71.8 Kabye-Tem 467 13.1 Para-Gourma-Akan 148 4.2 Other Togolese 33 0.8 Other non-Togolese 195 5.2 Niamey Djerma 1,542 46.6 Gourma 15 0.5 Haoussa 1,044 32.1 Kanouri 41 1.2 Peul 199 6.1 Touareg 170 5.4 Other 253 7.2 Missing 31 1.0 Ouagadougou Bissa 155 4.1 Bobo 50 1.0 Dagari 57 1.4 Gourmantche 43 1.2 Gurunsi 142 4.1 Mossi 2,921 77.2 Other Manding 168 4.2 Peul 73 1.8 Senoufo 33 0.8 Other 101 3.1 Missing 31 1.4
Sources: Based on Phase 1 of the 1-2-3 surveys of selected countries (see table 9.1 for details). Table 9A.2 (continued)
294 URBAN LABOR MARKETS IN SUB-SAHARAN AFRICA
Notes
1. Poverty Reduction Strategy Papers (PRSPs) are documents required before
low-income countries can receive aid from most major donors and lenders. Th e PRSP
process encourages countries to develop more poverty-focused policies and to own their own strategies by developing the plan in close consultation with the population.
2. See Siphambe and Th okweng-Bakwena (2001) on Botswana; Lachaud (1997) on
Burkina Faso and Cameroon; Appleton, Hoddinott, and Krishnan (1999) on Côte d’Ivoire, Ethiopia, and Uganda; Kolev and Suarez Robles (2007) and Temesgen (2006) on Ethiopia; Glewwe (1990) on Ghana; Glick and Sahn (1997) on Guinea; Kabubo-Mariara (2003), Milne and Neitzert (1994), and Agesa (1999) on Kenya; Armitage and Sabot (1991) on Kenya and Tanzania; Nordman and Roubaud (2009) and Nordman, Rakotomanana, and Robilliard (2010) on Madagascar; Nordman and Wolff (2009b) on Morocco; Nordman and Wolff (2009a) on the formal sectors of Madagascar and Mauritius; Isemonger and Roberts (1999) on South Africa; and Cohen and House (1993) on Sudan.
3. Conversely, one can argue that analyses that omit occupation and industry may underestimate the importance of background and choice-based characteristics on labor market outcomes (Altonji and Blank 1999).
4. Regan and Oaxaca (2006) show that using potential versus actual experience in earnings models is best viewed as a model misspecifi cation problem rather than a classical errors-in-variable framework. Instrumental variable techniques are the traditional approach used to correct classical measurement error. In the absence of actual experience measures, instrumenting potential experience does not solve the model specifi cation problem, as Regan and Oaxaca (2006) emphasize.
5. Following Tunali (1986), an alternative approach would be to employ a sequen-tial selection rule (nested multinomial logit) rather than a combined one. Doing so would mean controlling for self-selection into the paid-work group and then
dif-ferent endogenous choices of the public, formal private, and informal sectors. Th is
technique requires fi nding at least one variable aff ecting the decision to enter the paid-work group but not the sector choice in order to achieve identifi cation through the use of exclusion restrictions. It was impossible to fi nd variables that could be used in the fi rst-stage selection equation and arguably excluded from a second selec-tion equaselec-tion of sector allocaselec-tion.
6. In the context of a two-step sectoral selection correction, Appleton, Hoddinott, and Krishnan (1999) use the proportion of children in the household as an identifying instrument.
7. In France, the collection of data on ethnic origin is subject to authorization by a government body and is not granted systematically.
8. Easterly and Levine (1997) and Collier and Hoeffl er (1998) defi ne ethnolinguistic
fractionalization (ELF) as the probability of two randomly drawn individuals from the same country belonging to diff erent ethnic groups.
9. Nordman, Robilliard, and Roubaud (2011) explore the factors likely to explain
dif-ferences in gender gaps across cities. Th eir fi ndings suggest that cities with large
gender earnings gaps are characterized by high levels of female labor market par-ticipation, large gender education gaps, and large shares of self-employment.
diff erences in access to capital and the low productivity of activities engaged in by self-employed women may explain this fi nding.
10. In some cities, the groups considered represent very small shares of the population (see annex table 9A.2). For this reason, we did not implement decomposition meth-ods at this level of ethnic disaggregation.
11. Data on the ethnicity of the head of state at the time of the survey are provided in the data set put together by Fearon, Kasara, and Laitin (2007).
References
Agesa, R. U. 1999. “Th e Urban Gender Wage Gap in an African Country: Findings from
Kenya.” Canadian Journal of Development Studies 20 (1): 59–76.
Altonji, J. G., and R. M. Blank. 1999. “Race and Gender in the Labor Market.” In
Handbook of Labor Economics, vol. 3C, ed. O. Ashenfelter and D. Card, 3143–257.
Amsterdam: North Holland.
Appleton, S., J. Hoddinott, and P. Krishnan. 1999. “The Gender Wage Gap in
Th ree African Countries.” Economic Development and Cultural Change 47 (2):
289–312.
Armitage, J., and R. Sabot. 1991. “Discrimination in East African’s Urban Labor Market.”
In Unfair Advantage: Labor Market Discrimination in Developing Countries, ed.
N. Birdsall and R. Sabot. Washington, DC: World Bank.
Barr, A., and A. Oduro. 2000. “Ethnicity and Wage Determination in Ghana.” Policy Research Working Paper 2506, World Bank, Washington, DC.
Bayart, J.-F. 1989. “Le théâtre d’ombres de l’ethnicité.” In L’état en Afrique: la politique du
ventre, 65–86. Paris: Fayard.
Bennell, P. 1996. “Rates of Return on Education: Does the Conventional Pattern Prevail
in Sub-Saharan Africa?” World Development 24 (1): 183–99.
Blau, F., and L. Kahn. 2000. “Gender Diff erences in Pay.” Journal of Economic
Perspec-tives 14 (4): 75–99.
Blinder, A. S. 1973. “Wage Discrimination: Reduced Form and Structural Estimates.”
Journal of Human Resources 8 (4): 436–55.
Bossuroy, T. 2007. “Ethnicity as a Resource in Social Capital.” Développement, Institu-tions et Mondialisation (DIAL), Paris.
Cohen, B., and W. J. House. 1993. “Women’s Urban Labour Market Status in Developing
Countries: How Well Do Th ey Fare in Khartoum, Sudan?” Journal of Development
Studies 29 (3): 461–83.
Collier, P., and A. Hoeffl er. 1998. “On Economic Causes of Civil War,” Oxford Economic
Papers. 50: 563–73.
Easterly, W., and R. Levine. 1997. “Africa’s Growth Tragedy: Policies, and Ethnic
Divi-sions.” Quarterly Journal of Economics 111 (4): 1203–50.
Fearon, J. D. 2003. “Ethnic and Cultural Diversity by Country.” Journal of Economic
Growth 8 (2): 195–222.
Fearon, J., K. Kasara, and D. Laitin. 2007. “Ethnic Minority Rule and Civil War Onset.”
296 URBAN LABOR MARKETS IN SUB-SAHARAN AFRICA
Glewwe, P. 1990. “Schooling, Skills, and the Return to Education: An Econometric Exploration Using Data from Ghana.” Living Standards Measurement Working Paper 76, World Bank, Washington, DC.
Glick, P., and D. E. Sahn. 1997. “Gender and Education Impacts on Employment and
Earnings in West Africa: Evidence from Guinea.” Economic Development and Cultural
Change 45 (4): 793–823.
Hausman, J. A., and D. McFadden. 1984. “Specifi cation Tests for the Multinomial Logit
Model.” Econometrica 52 (5): 1219–40.
Isemonger, A. G., and N. Roberts. 1999. “Post-Entry Gender Discrimination in the South
African Labour Market.” Journal for Studies in Economics, and Econometrics 23 (2):
1–25.
Kabubo-Mariara, J. 2003. “Wage Determination and the Gender Wage Gap in Kenya: Any Evidence of Gender Discrimination?” Research Paper 132, African Economic Research Consortium, Nairobi.
Kolev, A., and P. Suarez Robles. 2007. “Addressing the Gender Pay Gap in Ethiopia: How Crucial Is the Quest for Education Parity?” Agence Française de Développement, Paris, and World Bank, Washington, DC.
Lachaud, J.-P. 1997. Les femmes et le marché du travail urbain en Afrique subsaharienne.
Paris: Editions l’Harmattan.
Lee, L.-F. 1983. “Generalized Econometric Models with Selectivity.” Econometrica
51 (2): 507–12.
Milne, W., and M. Neitzert. 1994. “Kenya.” In LaborMarkets in an Era of Adjustment,
ed. S. Horton, R. Kanbur, and D. Mazumdar, 405–57. EDI Development Studies. Washington, DC: World Bank.
Neuman, S., and R. Oaxaca. 2004. “Wage Decompositions with Selectivity-Corrected
Wage Equations: A Methodological Note.” Journal of Economic Inequality 2 (1): 3–10.
Neumark, D. 1988. “Employers’ Discriminatory Behavior and the Estimation of Wage
Discrimination.” Journal of Human Resources 23 (3): 279–95.
Nordman, C. J., F. Rakotomanana, and A.-S. Robilliard. 2010. “Gender Disparities in
the Malagasy Labor Market.” In Gender Disparities in Africa’s Labor Markets, ed. J. S.
Arbache, A. Kolev, and E. Filipiak, 87–153. Washington, DC: World Bank.
Nordman, C. J., A.-S. Robilliard, and F. Roubaud. 2011. “Gender and Ethnic Earnings
Gaps in Seven West African Cities.” Labour Economics 18: S132–S145.
Nordman, C. J., and F. Roubaud. 2009. “Reassessing the Gender Wage Gap in
Mada-gascar: Does Labour Force Attachment Really Matter?” Economic Development and
Cultural Change 57 (4): 785–808.
Nordman, C. J., and F.-C. Wolff . 2009a. “Islands through the Glass Ceiling? Evidence of
Gender Wage Gaps in Madagascar, and Mauritius.” In LaborMarkets and Economic
Development, ed. R. Kanbur and J. Svejnar, 521–44. London: Routledge.
———. 2009b. “Is Th ere a Glass Ceiling in Morocco? Evidence from Matched
Worker-Firm Data.” Journal of African Economies 18 (4): 592–633.
Oaxaca, R. 1973. “Male-Female Wage Diff erentials in Urban Labor Markets.”
Regan, T. L., and R. L. Oaxaca. 2006. “Work Experience as a Source of Specifi cation Error in Earnings Models: Implications for Gender Wage Decompositions.” IZA Discussion Paper 1920, Institute for the Study of Labor, Bonn, Germany.
Reimers, C. W. 1983. “Labour Market Discrimination against Hispanic and Black Men.”
Review of Economics and Statistics 65 (4): 570–79.
Siphambe, H. K., and M. Th okweng-Bakwena. 2001. “Th e Wage Gap between Men and
Women in Botswana’s Formal Labour Market.” Journal of African Economies 10 (2):
127–42.
Temesgen, T. 2006. “Decomposing Gender Wage Diff erentials in Urban Ethiopia:
Evi-dence from Linked Employer-Employee (LEE) Manufacturing Survey Data.” Global
Economic Review 35 (1): 43–66.
Tunali, I. 1986. “A General Structure for Models of Double-Selection and an
Applica-tion to a Joint MigraApplica-tion/Earnings Process with RemigraApplica-tion.” In Research in Labor
Economics, ed. R. G. Ehrenberg, 235–84. Greenwich, CT: JAI Press.
Weichselbaumer, D., and R. Winter-Ebmer. 2005. “A Meta-Analysis of the International
Some rights reserved 1 2 3 4 16 15 14 13
Th is work is a product of the staff of Th e World Bank with external contributions. Note that Th e World
Bank and the Agence Française de Développement do not necessarily own each component of the content
included in the work. Th e World Bank and the Agence Française de Développement therefore do not
warrant that the use of the content contained in the work will not infringe on the rights of third parties.
Th e risk of claims resulting from such infringement rests solely with you.
Th e fi ndings, interpretations, and conclusions expressed in this work do not necessarily refl ect the
views of Th e World Bank, its Board of Executive Directors, or the governments they represent, or the
Agence Française de Développement. Th e World Bank does not guarantee the accuracy of the data
included in this work. Th e boundaries, colors, denominations, and other information shown on any map
in this work do not imply any judgment on the part of Th e World Bank concerning the legal status of any
territory or the endorsement or acceptance of such boundaries.
Nothing herein shall constitute or be considered to be a limitation upon or waiver of the privileges and
immunities of Th e World Bank, all of which are specifi cally reserved.
Rights and Permissions
Th is work is available under the Creative Commons Attribution 3.0 Unported license (CC BY 3.0) http://
creativecommons.org/licenses/by/3.0. Under the Creative Commons Attribution license, you are free to copy, distribute, transmit, and adapt this work, including for commercial purposes, under the following conditions:
Attribution—Please cite the work as follows: De Vreyer, Philippe, and François Roubaud, Editors. 2013. Urban Labor Markets in Sub-Saharan Africa. Africa Development Forum series. Washington, DC: World Bank. doi:10.1596/978-0-8213-9781-7. License: Creative Commons Attribution CC BY 3.0
Translations—If you create a translation of this work, please add the following disclaimer along with the
attribution: Th is translation was not created by Th e World Bank and should not be considered an offi cial
World Bank translation. Th e World Bank shall not be liable for any content or error in this translation.
All queries on rights and licenses should be addressed to the Offi ce of the Publisher, Th e World Bank,
1818 H Street NW, Washington, DC 20433, USA; fax: 202-522-2625; e-mail: [email protected]. ISBN (paper): 978-0-8213-9781-7
ISBN (electronic): 978-0-8213-9782-4 DOI: 10.1596/978-0-8213-9781-7
Cover image: ©Michelle Saint-Léger, IRD, 2013.
Cover design: Debra Naylor, Naylor Design, Inc.
Library of Congress Cataloging-in-Publication Data
Vreyer, Philippe De.
Urban labor markets in sub-Saharan Africa/Philippe De Vreyer and François Roubaud.
p. cm.
Includes bibliographical references and index.
ISBN 978-0-8213-9781-7 — ISBN 978-0-8213-9782-4 (electronic)
1. Labor market—Africa, Sub-Saharan. 2. Africa, Sub-Saharan—Economic conditions. 3. City dwellers—Employment—Africa, Sub-Saharan. I. Roubaud, François. II. World Bank. III. Title.
HD5837.A6V74 2013
331.120967—dc23
2012050217
Th e French translation of this book is copublished by Agence Française de Développement and Institut
de Recherche pour le Développement (IRD). Th e IRD, a French public research institute emphasizing
interdisciplinarity, has focused its research for more than 65 years on the relationship between man and its environment in Africa, Asia, Latin America, the Mediterranean, and the French tropical overseas ter-ritories. Its research, training, and innovation activities are intended to contribute to the social, economic, and cultural development of southern countries. For further information: www.editions.ird.fr.