www.elsevier.comrlocatereconbase
Conditional event studies, anticipation, and
asymmetric information: the case of seasoned
equity issues and pre-issue information releases
Lin Guo
a,), Timothy S. Mech
ba
Department of Finance, School of Management, Suffolk UniÕersity, Boston, MA 02108 USA
b
Faculty Boxa2697, GroÕe City College, GroÕe City, PA 16127 USA
Accepted 20 February 2000
Abstract
Information disclosed before equity issue announcements could reduce the price drops at
Ž .
the announcements by 1 reducing uncertainty about managers’ private information,
Ž .
andror 2 helping investors to anticipate the equity issues. To distinguish between these effects, we examine the determinants of firms’ decisions to issue equity, and develop a
w
conditional event-study procedure, based on Acharya Acharya, S., 1988, A generalized econometric model and tests of a signaling hypothesis with two discrete signals, Journal of
x
Finance, 43, 413–429. , that distinguishes between anticipation and asymmetric informa-tion. After controlling for differences in uncertainty across firms, we present evidence that stock split declarations, dividend announcements and earnings releases help investors to anticipate equity issues, but do not reduce asymmetric information. q2000 Elsevier Science B.V. All rights reserved.
JEL classification: G32; G14
Keywords: Conditional event study; Seasoned equity issues
1. Introduction
Stock prices tend to fall when firms announce their intention to issue additional shares of stock. Studies of seasoned equity issues often attribute this phenomenon
)Corresponding author. Tel.:q1-617-573-8388; fax:q1-617-573-8345.
Ž .
E-mail address: [email protected] L. Guo .
0927-5398r00r$- see front matterq2000 Elsevier Science B.V. All rights reserved.
Ž .
to asymmetric information, i.e. the superior information held by managers relative to shareholders.1 Numerous economists have investigated whether pre-issue dis-closures can alleviate the adverse-selection problem associated with new equity
Ž .
issues. Ambarish et al. 1987 , for example, argue that corporate insiders can use dividends and new issues together to communicate private information at lower
Ž .
cost than new equity issues alone. Korajczyk et al. 1992 argue that information disclosures arrive discretely, so that information asymmetry varies over time. This suggests that the disclosure of credible information reduces uncertainty about managers’ private information, and hence reduces the price drop at subsequent issue announcements.
Both of these models suggest that pre-issue information releases can reduce asymmetric information before equity issues. We test this implication by exploring the effects of information releases on issue announcement returns. Previous studies in this area have used the traditional event study method, which regresses announcement period returns on selected cross-sectional variables. However, this traditional method cannot distinguish whether a variable affects asymmetric information, or the investors’ anticipation of the issue. In contrast, we modify
Ž .
Acharya 1988 conditional event study method to test for asymmetric information after controlling for anticipation.2
Ž .
Conditional event study procedures, described by Acharya 1988 , Eckbo et al.
Ž1990 , and Prabhala 1997 , link event day returns to the private information. Ž .
revealed by the events. These procedures assume that the amount of private information revealed by an event depends on both the public information available and the amount of uncertainty about the managers’ private information. Until now, conditional event studies have allowed the public information to vary across firms, but hold the uncertainty about private information constant. Obviously, this is a simplifying assumption because uncertainty varies substantially across firms and over time. Consequently, we modify the Acharya conditional event study method to allow for this variation in uncertainty. This permits us to test hypotheses about asymmetric information, after controlling for anticipation.
We use our method to examine whether stock split declarations, dividend announcements, and earnings releases reduce asymmetric information at subse-quent equity issue announcements. We choose these three types of information releases because the timing of these events are closely related to equity issues.
Ž .
Korajczyk et al. 1991 find that earnings are disclosed more frequently before
Ž .
issue announcements than afterward. Loderer and Mauer 1992 present evidence that firms time stock offerings immediately after dividend declarations. Guo and
1 Ž . Ž .
For example, see Myers and Majluf 1984 , Masulis and Korwar 1986 , Asquith and Mullins
Ž1986 , Mikkelson and Partch 1986 .. Ž .
2 Ž . Ž . Ž .
Ž .
Mech 1997 observe that stock splits are declared much more frequently before issue announcements than afterward.
After controlling for anticipation and cross-sectional differences in asymmetric information, we find no evidence that split declarations, dividend announcements, or earnings releases decrease the information asymmetry around equity issue announcements. Our work contributes to the literature in four additional ways. First, we present a model and evidence concerning determinants of firms’
equity-Ž . Ž .
issue decisions. Choe et al. 1993 , Jung et al. 1996 , and Opler and Titman
Ž1995 present evidence on firms’ choice between debt and equity issues. Pagano.
Ž .
et al. 1998 analyze factors that affect Italian firms’ decision to go public. However, none of the previous empirical studies has examined the issue and no-issue choice of public firms. Second, we use a much larger and more recent
Ž .
sample than previous studies. Korajczyk et al. 1991 examine whether earnings releases reduce asymmetric information before equity issues for the period of
Ž .
1978–1983. Loderer and Mauer 1992 investigate whether pre-issue dividend announcements reduce the price drops at the issue announcements for the period of 1973–1984. Our sample covers seasoned equity issues between 1980 and 1994. Third, we consider jointly the effects of dividend declarations, earnings releases, and stock split declarations on issue announcement returns, after controlling for
Ž .
cross-sectional differences in uncertainty. Korajczyk et al. 1991 and Loderer and
Ž .
Mauer 1992 only examine the effect of a single announcement, such as earnings releases or dividend declarations, on issue announcements. The effects of other information releases are therefore not controlled in their analyses. Finally, we also address a technical difficulty that has received scant attention in the conditional event-study literature. Conditional event-study procedures frequently estimate the ex-ante probability of an event from a logit or probit regression, using announce-ment data. The probability of an event, however, differs from the probability that it will be announced on any given day. This introduces a subtle sampling bias that can be corrected by introducing a parameter for the managers’ decision horizon. The remainder of the paper is organized as follows. Section 2 defines our measure of asymmetric information and describes our conditional event-study procedure. Section 3 presents the testable hypotheses. Section 4 describes the data and sample. Section 5 applies our conditional event-study procedure to study the effects of pre-issue information releases on equity issue announcements. The paper concludes with Section 6.
2. Asymmetric information, anticipation, and conditional event studies
2.1. Measuring the importance of asymmetric information
information about their companies in addition to all relevant public information. From a practical point of view, the incremental value of the manager’s private information equals the difference between the valuation of the firm with and without this information. From the perspective of the investing public, the importance of the private information is the magnitude of the effect that the information could have on the valuation of the firm. This can be measured by the variance of the difference in the valuation of the firm with and without the managers’ private information.
Any release of information by managers reduces asymmetric information in the sense that it makes private information public. It is conceivable, however, that new information could actually increase the perceived importance of whatever private information managers still retain. In one sense asymmetric information falls, but the importance of asymmetric information from the perspective of shareholders may actually increase. This might be the case, for example, when a firm with very stable earnings that announces a very risky new venture. If investors do not anticipate the new venture, the announcement will increase their assessment of uncertainty and the importance of managers’ private information. For the balance of this paper, we use asymmetric information to mean the perceived importance of managers’ private information. This can be measured as the variance of the difference between the managers’ and the market’s valuation of the firm’s equity. Although it is theoretically possible for this variance to increase with some types of announcements, we assume that most common events, such as earnings releases and dividend announcements, decrease the impact of asymmetric information.
2.2. OÕerÕiew of the conditional eÕent-study procedure
To test whether pre-issue information releases can reduce the asymmetric
Ž .
information at issue announcements, we modify Acharya 1988 conditional event-study procedure to allow the variance of the managers’ private information to vary across firms.
Let Õ denote managers’ public and private information about the effect of an i
equity issue on the value of the claim of existing shareholders of firm i. As in
Ž . Ž . Ž .
Myers and Majluf 1984 , Ambarish et al. 1987 , and Korajczyk et al. 1992 , we assume managers maximize the interests of existing shareholders. Variable Õ is
i
simply the sum of the public’s prior expectation of Õ and managers’ private i
information. This can be expressed
Õsuqh,
Ž .
1i i i
where u is the public’s prior expectation of Õ andh reflects managers’ private
i i i
information. Managers choose the action if and only if ÕG0, i.e., whenhG yu .
i i i
Ž .
2 Ž .
variance vi. Our model differs from Acharya 1988 in that the variance of managers’ private information,v2
, varies across observations. Note that v2
is our
i i
measure of the importance of the asymmetric information for firm i, as described in Section 2.1. We assume that the variance of private information, v2
, can be
where c is a vector of parameters and y is a vector of publicly observablei
variables that are associated with asymmetric information. These variables include firm characteristics that are associated with valuation uncertainty, such as firm size, and variables that reflect the timing of news, such as earnings releases, that have been hypothesized to reduce asymmetric information. If we could observe
v2
directly, then we could test hypotheses about asymmetric information by
i
Ž . 2
regressing Eq. 2 . Because it is unobservable, we infer vi from the issue announcement abnormal returns.
Ž .
As in Acharya 1988 , we assume that the expected abnormal return at an issue announcement is proportional to the managers’ private information revealed in the event, i.e.
In Eq. 3 , EP is the expectation operator;p is the constant of proportionality;
Ž . Ž .
f P and F P represent the standard normal density and distribution functions
Ž .
respectively. It can be shown that if p-0, then EE ARi rEvi-0 and
Ž . Ž . Ž .
EE ARi rE ui )0 Greene, 1997 . Consistent with our intuition, this result suggests that the price drop at an issue announcement increases with the uncer-tainty of managers’ private information and decreases with the anticipation of the issue.
The announcement day abnormal return equals the expected abnormal return
Ž . Ž .
estimate parameter vector c in Eq. 4 using a two-stage procedure. In the first
Ž . Ž .
stage, we obtain an estimate of f zi rF z . In the second stage, we substitutei
3
Ž . Ž .
f zi rF zi with the estimate from the first stage and run the nonlinear
regres-Ž .
sion of Eq. 4 to obtain an estimate of the vector of asymmetric information coefficients, c. We explain the estimation details below.
2.2.1. First-stage estimation
Ž . Ž . Ž .
To compute f zi rF z , we first estimatei F zi and then calculate
Ž . Ž . Ž .
f zi rF zi from this estimate. Note that F zi is the ex-ante probability that managers intend to issue stock. This is because the probability that managers decide to issue stock, p , is the probability thati hiG yu . Ifi hi is normally distributed with mean zero and variance v2, p can be expressed
i i
pisProb
Ž
hiG yui.
sFŽ
uirvi.
sFŽ .
z .iŽ .
5We use a probit regression to estimate p . This probit regression is also used toi
determine factors that help investors to anticipate equity issues. Notice that p , thei
probability that managers have decided to take an action, differs from the probability that managers will announce the decision in any given period. The stock market reaction to an announcement depends on p , the market’s assessmenti of the probability that the event is forthcoming, rather than on the probability that the announcement falls on a particular day. For example, an equity issue an-nouncement will have little reaction if an equity issue is strongly anticipated, even if the market did not expect the announcement to be made on that particular day. This distinction is important because it has implications for how we will estimate
p from announcement data later.i
To estimate p , we need to correct for two sampling biases. The first is thei
unequal sampling bias that arises when we sample different proportions of days with and without the issue announcement. This sort of adjustment is often made in probit and logit analysis. The second sampling bias occurs because the probit regression estimates the probability that an announcement will be made on any given day, while we are interested in p , the probability that an event isi
forthcoming. We discuss these problems and our corrections in the Section 2.2.2. Our estimate of p , after correcting for the sampling biases, is denoted pc.
ˆ
i i
2.2.2. Second-stage estimation
y1Ž c.
The second stage regression is obtained by substitutingF p
ˆ
i for z in Eq.iŽ .4
We regress Eq. 6 using nonlinear least squares to get estimates of the asymmetric information coefficients, c.
2.3. Probit estimation with sampling biases
The probit regression requires observations in which managers intend to have
Ž .
the event ÕG0 and observations in which managers intend not to have the event i
ŽÕ-0 . For the sake of brevity, we refer to these as the event and non-event.
i
samples. Each observation represents a security-day, i.e. a particular security on a particular date. We cannot observe Õ directly, but we can assume that ÕG0 on
i i
days when the event is announced, so we use issue announcement dates to form the event sample. To get a non-event sample, we assume that Õi-0 if the event
does not occur over the next 250 trading days. Let N equal the total number of security-days in the population. Of these, there are N observations withE ÕiG0,
and NyN observations withE Õi-0. From the population, we sample S eventE
announcements to get our event sample, and SNE observations without events over the next 250 trading days, to get our non-event sample.
Using the joint sample of SEqSNE observations, we first estimate the probabil-ity that an announcement in our sample occurs on a given day, without correcting for unequal sampling. We denote this uncorrected probability p . These estimated
ˆ
iŽ .
probabilities as opposed to the probit coefficients are very easy to correct for unequal sampling. In particular, the corrected estimated probability that managers of a firm intend to issue is simply4
p
ˆ
iwhere P is the proportion of security-days with ÕG0 that are included in the
E i
sample, and PNE is the proportion of security-days withÕi-0 represented in the
sample. In terms of the variables defined above, PE equals SErN , and PE NE
Ž .
equals SNEr NyN .E
Recall that Õi is the managers’ assessment of the benefits of the event, and that
managers choose the event whenever Õi is greater than or equal to zero. Because
the event takes time to plan and to accomplish, Õi will be greater than zero for a
period of time before the event actually occurs. We observe the actual events, but not Õ, so we do not know N , the number of days in whichÕ is greater than zero.
i E i
To get around this problem, we introduce another parameter, H. We define H as the average number of days between the time that managers conclude that the
Ž .
benefits of the event Õ are positive and the date that the event actually occurs. i
Intuitively, H reflects the average number of days in the horizon of the managers. For example, if an event occurs an average of 50 days after managers decide the
4 Ž .
benefits are positive, then H will equal 50. H also captures the effects of managers that change their minds about an event. Suppose that the managers of 100 firms decide the benefits of an event are positive. Fifty days later, 90 of the firms consummate the event and 10 change their minds. H will equal 100=50r90, or 55.6 days.
If there are n unique events in the population, then H equals the total numberE
Ž . Ž .
of security-days with ÕG0 N , divided by the number of events n . The
i E E
sampling proportions can be expressed in terms of H
PEsSEr
Ž
n pEˆ
icŽ
H.
.
,Ž .
8and
PNEsSNEr
Ž
Nyn H .E.
Ž .
9Ž . Ž .
Combining Eqs. 7 – 9 gives the corrected estimated probability of the event in terms of H
With this substitution, Eq. 6 becomes
y1 c
In theory, H and c could both be estimated from Eq. 11 . In practice, this is computationally expensive and produces questionable results. An attractive alter-native is to estimate the asymmetric information parameters, c, for several plausible values of H. Recall that H is the average number of days from the managers’ decision to have an event to the event itself. This must be at least equal to the average number of days between the issue announcements and the actual issue dates. We denote this T. If announcement days are uniformly distributed between the private decisions of managers and the actual issue dates, then H will equal 2T. It is also possible for H to be somewhat longer than this. Because of
Ž .
these considerations, we recommend that Eq. 11 be estimated for HsT, 2T,
and 4T.
To summarize, our conditional event-study procedure has three steps.
Ž .
1. Compute the predicted values p from the first-stage probit regression. This
ˆ
iprobit regression is also used to determine factors that affect firms’ equity-issue decision.
Ž .
2. Adjust these probabilities for unequal sampling using Eq. 10 . This gives corrected probabilities, pc.
3. Estimate the parameter vector c, using a nonlinear weighted least squares
Ž .
regression of Eq. 11 for plausible values of H. Normalize by requiring p to
Ž .
equal eitherq1 ory1. As in Korajczyk et al. 1991 , we weight observations by the inverse of the standard deviation of the abnormal returns.
3. Seasoned equity issues and pre-issue information releases
Ž .
According to Myers and Majluf 1984 , stock prices fall when equity issues are announced because shareholders are aware that managers possess superior infor-mation and interpret the decision to sell equity as evidence that the stock is
Ž . Ž .
overpriced. Korajczyk et al. 1992 extend the model of Myers and Majluf 1984 by explicitly assuming that the information asymmetry is time-varying. They suggest that firms can choose to issue equity when there is less information asymmetry between managers and outside investors. In particular, their model
Ž .
predicts that: 1 credible information releases can lessen the valuation uncertainty about managers’ private information and hence reduce the price drop at
subse-Ž .
quent issue announcements, and 2 the price drop at issue announcement in-creases with the time since the last information release.
Ž .
Ambarish et al. 1987 present a model in which firms achieve an efficient signaling equilibrium with two joint signals, i.e., dividends and sales of new stocks. They argue that dividends and equity issues can collectively communicate private information at lower cost than new equity issues alone. Unlike the model
Ž . Ž .
of Korajczyk et al. 1992 , Ambarish et al 1987 do not predict a direct relation between an issue announcement return and the time since the last dividend announcement.
In this paper, we test the predictions of these models by examining the effect of earnings releases, dividend announcements, and stock split declarations on subse-quent seasoned equity issues. These three types of information releases are particularly interesting because previous studies find that the timing of these
Ž .
events is closely related to issue announcements Korajczyk et al. 1991 , Loderer
Ž . Ž .
and Mauer 1992 and Guo and Mech 1997 . In addition, financial economists have proposed that these information releases convey credible information to
Ž .
shareholders. For example, Korajczyk et al. 1991 hypothesize that earnings
Ž .
releases reduce asymmetric information. Miller and Rock 1985 and Healy and
Ž .
Palepu 1988 argue that dividends reduce uncertainty about earnings. Numerous papers suggest that stock splits are credible signals of favorable information,
Ž . Ž .
including Grinblatt et al. 1984 , Lakonishok and Lev 1987 , Klein and Peterson
Ž1989 , Brennan and Copeland 1988 , and Brennan and Hughes 1991 .. Ž . Ž .
Ž .
al. 1992 , issue announcement returns are negatively related to the number of days between the information releases and subsequent issue announcements.
4. Data and sample
4.1. Equity issue data
We extracted 3932 US seasoned equity offerings from the Securities Data Corporation database, for the period 1980–1994. CRSP data are available for 2651 of the issuing firms at the time of the offers. Using LexisrNexis, we identified announcement dates for 1648 of these offerings.5 From this sample, 117
observa-Ž .
tions were deleted for one or more of the following four reasons. 1 On 64 of the
Ž .
announcement dates, the firm also announced its intention to issue debt. 2 Thirty-two of the announcements were for shelf offerings, in spite of our efforts to
Ž .
eliminate shelf offerings when the data were extracted from the SDC file. 3 The wording of 19 of the announcements implied that the issuing firms had previously announced their intentions to issue equity, even though we could not find the
Ž .
earlier announcements. 4 For 14 of the announcements, it was unclear whether the announcement pertained to the same class of common stock as the CRSP data. After deleting these observations, we were left with a sample of 1531 announce-ment dates. Enough CRSP data were available to compute 3-day market adjusted returns for 1509 of these observations.
Previous studies of issue announcement effects have used announcement dates
Ž .
from the Wall Street Journal WSJ Index. The disadvantage of this source is that it reports few issue announcements after 1983. To test the suitability of our LexisrNexis data, we obtained a sample of 389 WSJ announcements from Assem Safieddine. Safieddine’s sample consists of equity issues reported by Investment Dealers’ Digest from 1980 to 1983, and includes 99 issues from our LexisrNexis sample. Out of the 99 issues for which we have both WSJ and LexisrNexis announcement dates, there are only three issues for which the two sources agree. There are 67 issues, however, for which the WSJ date is only one trading day after the LexisrNexis date. This is sensible, because announcements reported on the news wires are not published in the WSJ until the following day. There are additional five observations for which the WSJ reported the announcement 2 trading days after LexisrNexis, and 16 observations for which the WSJ announce-ment followed LexisrNexis by more than 2 days. On the other hand, the WSJ announcement preceded the LexisrNexis announcement for eight issues, each
5
time by at least 3 days. Summarizing these results, LexisrNexis provided earlier announcements for 88 of the 99 issues, while the WSJ index had earlier announce-ments for only eight of the issues. Because we are interested in capturing the earliest announcement, the LexisrNexis announcement dates are superior to the dates from the WSJ index.
4.2. Stock split data
For our sample of stock splits, we extracted all 7650 stock splits from the CRSP NYSE, AMEX, and NASDAQ files from 1979 to 1994. We begin in 1979 because we are interested in the effects of split declarations that occur before issue announcements, and our equity issue data begins in 1980. From this initial sample, we deleted three duplicates, 132 reverse splits, and 28 splits with split factors less than 20%6, giving us a final sample of 7487 splits.
4.3. Earnings releases and diÕidend announcements
Ž .
Korajczyk et al. 1991 present evidence that earnings releases reduce asym-metric information before equity issues. To examine the effects of pre-issue earnings releases on the issue announcement abnormal returns, we obtain firms’ earnings release dates from Compustat quarterly files and the WSJ Index. Earnings release dates are available for 1413 observations out of the 1531 issue announce-ments in our sample.
Ž .
Loderer and Mauer 1992 investigate whether dividend announcements affect subsequent issue announcement returns. To control for the effects of dividend announcements, we collect the dividend declaration dates from the CRSP NYSE, AMEX and NASDAQ files. We divide firms from our issue announcement sample
Ž . Ž
into firms with dividend increases 194 observations and decreases 25
observa-. Ž .
tions before the issue announcements, no dividend change 539 observations and
Ž .
no cash dividend paid 773 observations during the 250 trading days preceding the issue announcement.
4.4. Abnormal returns around eÕent dates
Using CRSP data, we compute the market-adjusted abnormal returns over days
y1 toq1 around the split declaration and issue announcement dates, where day 0
Ž .
is the event day. Including the day before the event day y1 captures the market’s response when the news is released a day before it is reported by the
Ž .
press. We include the day after the event day q1 because many firms in our
6
sample are small and may experience light trading on the event date; consequently, some of the price adjustment may not be observed until the following day.
For firm i on day t, the market-adjusted abnormal returns are computed by subtracting theAmarketB returns Rm t from the returns of the individual stock R ,i t
i.e.,
ARi tsRi tyRm t.
Ž
12.
For NYSErAMEX stocks, we use the return to the CRSP NYSErAMEX equal-weighted portfolio as our proxy for the market return. For NASDAQ stocks, our proxy for the market return is the return to the CRSP NASDAQ equal-weighted portfolio. We deleted the December 8, 1992 issue announcement by TSS. This observation had an abnormal return of 259%, and had substantial influence on some of the test statistics.
We use market-adjusted returns rather than market model prediction errors in most of our tests. This is because price run-ups in the periods before splits and equity issues can bias estimates of the market model parameters. According to
Ž .
Brown and Warner 1985 , event studies with market-adjusted returns have comparable power to procedures that use the market model. To insure that our conclusions about asymmetric information are not driven by our measure of abnormal returns, we confirm our major findings using market model prediction errors.
5. Conditional event-study analysis of issue anticipation and issue announce-ment returns
In this section, we first develop an innovative probit regression to analyze factors that predict equity issues. Then we test whether the announcements of stock splits, dividends, and earnings affect the uncertainty about managers’ private information.
5.1. Predicting equity issues
We assume that the choice to issue equity is made in two stages. First, the firm decides whether or not to raise external funds. Second, firms that have decided to raise external funds determine whether or not to raise equity. The probability that a firm will issue equity equals the probability of external financing multiplied by the conditional probability that equity will be issued if the firm uses external financ-ing. This can be expressed
Prob Issue Equity
Ž
.
sProb External FinancingŽ
.
We assume that
Prob External Financing
Ž
.
sFŽ
xX1 ib1.
and
Prob Issue Equity
Ž
NExternal Financing.
sFŽ
xX2 ib2.
.Ž
14.
Where x1 i is a vector of variables that predict a firm’s decision to use external financing, x2 i is a vector of variables predicting that equity financing will be chosen by firms that intend to raise external funds, and b and b are vectors of1 2
parameters. The probability that a firm will issue equity, then, is simply
Prob Issue Equity
Ž
.
sFŽ
xX1 ib1.
=FŽ
xX2 ib2.
.Ž
15.
This model, which we call a Acompound probitB, can be estimated using maxi-mum likelihood. Next, we look at the variables that predict external financing.
5.1.1. Variables associated with external financing
A firm’s external financing requirements are determined by its planned invest-ment, cash on hand, and expected internal cash flow. To establish this relation, we begin with the following balance sheet identity
DCurrent AssetsqDFixed AssetssDLiabilitiesqDEquity,
Ž
16.
where the symbolD means change. Because the change in fixed assets equals net
Ž .
capital expenditures minus depreciation, and net working capital Net WC equals
Ž .
current assets minus current liabilities, Eq. 16 can be expressed
Net Capital ExpendituresyDepreciation qDNet WCsDDebtqDEquity,
Ž
.
17
Ž
.
whereDDebt represents the change in long-term debt. Defining Investment as net capital expenditures plus additions to Net WC gives us
InvestmentyDepreciationsDDebtqDEquity.
Ž
18.
The change in long-term debt and equity equals the change in external financing plus additions to retained earnings, so that
InvestmentyDepreciationsAdditional external financingqNet income
yDividends.
Ž
19.
Ž .
Rearranging Eq. 19 gives
Additional external financingsInvestmentyInternal Cash Flow ICF ,
Ž
.
20
where ICFsNet incomeqDepreciationyDividends. This definition of internal cash flow is equivalent to operating cash flow minus interest and dividends. It is the portion of operating cash flow that is actually available for investment.
Because a firm can use all of its excess cash in its investments, the external financing required for a given level of investment is
External funds needed EFN
Ž
.
sInvestmentyInternal Cash Flow ICFŽ
.
yExcess Cash.
Ž
21.
At time t, the expected external fund requirement for the next s periods equals the expected investment over this horizon, minus the expected internal cash flow over this period, less the excess cash available at time t
E EFNt
Ž
t , tqs.
sE InvestmenttŽ
t , tqs.
yE ICFtŽ
t , tqs.
yExcess Cash .tŽ
22.
Ž .
If E EFNt t, tqs is small relative to a firm’s assets in place, the firm could avoid issuing new securities by making minor changes to the magnitude and timing of the investment, by using the firm’s credit line, or by finding ways to boost its internal cash flow. If external financing needs are high relative to the firm’s size, the firm will not be able to avoid external financing without forgoing profitable investments. This suggests that the benefit from issuing securities is a positive
Ž . Ž .
function of the ratio of E EFNt t, tqs to the book value of assets B .t
Ž .
To estimate E EFNt t, tqs, we need to get a proxy for expected investment and expected internal cash flow. We assume that expected investment is proportional to the present value of the firm’s growth opportunities, which approximately
Ž . Ž .
equals the difference between the market value Mt and the book value Bt of a firm. We further assume that the expected internal cash flow over the next s periods is proportional to the cash flow from the most recent year, i.e.,
E Investmentt
Ž
t , tqs.
sk MŽ
tyB ,t.
Ž
23.
and
E ICFt
Ž
t , tqs.
smICFty1 , t,Ž
24.
where k and m are constants. Because we are interested in predicting future
Ž .
internal cash flow, we omit extraordinary income from ICFty1, t in Eq. 24 . Assuming that a firm’s working cash requirement equals a fraction n of total assets, the excess cash equals cash and cash equivalents minus n times total assets
Excess cashtsCashtynB .t
Ž
25.
This implies that the expected external financing needed is approximately,
Ž .
As discussed above, a firm’s proclivity to issue is a function of E EFNt t, tqs rB .t
Ž .
Dividing both sides of Eq. 26 by B givest
E EFNt
Ž
t , tqs.
rBtsa0qa1Ž
MtrBt.
qa ICF2Ž
ty1 , trBt.
qa Cash3Ž
trB ,t.
27
Ž
.
where a0snyk, a1sk, a2s ym, and a3s y1. This simple model suggests that variables MtrB , ICFt t -1, trB and Casht trB are associated with the probabilityt
that a firm raises external capital. Next, we consider variables related to a firm’s choice of equity versus debt.
5.1.2. Variables associated with the choice of equity financing
A firm needing external funds could rely on bank borrowing, bond issues, or
Ž .
other alternatives to equity. Marsh 1982 and others use the relation between current and historical debt ratios to predict a firm’s choice of debt or equity. We assume that a firm needing external funds is more likely to issue equity when its
Ž .
debt ratio is above its target level. We measure a firm’s debt ratio DEBT as the book value of total liabilities divided by the sum of the book value of liabilities
Ž .
and the market value of equity. We measure the target debt ratio TDEBT as the
Ž
debt ratio a year earlier. We get comparable results when we use the industry average debt level as the target, or when leverage is measured as total liabilities
.
divided by total book value of assets .
Ž .
In addition, the model of Lucas and McDonald 1990 suggests that the stocks of issuing firms have large positive abnormal returns before equity issues. We use a firm’s continuously compounded stock return over the preceding 250 trading
Ž .
days RET250 to measure the increase in share price before an issue. RET250 essentially shows how the firm’s equity is priced relative to its pricing a year
Ž .
earlier. Moreover, Choe et al. 1993 argue that firms are less likely to issue equity when the stock market is more volatile. We use the standard deviation of the equal-weighted CRSP index during the preceding 250 trading days as a measure of
Ž .
the volatility of equity markets STDMKT .
Our final set of variables measures the asymmetric information between a firm’s managers and its outside investors. Recall that the ultimate goal of our procedure is to distinguish between anticipation and asymmetric information. In order to do this, all variables that we test in the second stage regression must be included in the first stage probit as well. The first stage controls for anticipation; the second tests for asymmetric information. We also have another reason for including asymmetric information variables at this point. Asymmetric information affects the public’s reaction to the equity offering, depressing the price the firm realizes from the sale of its shares. Firms should consider this as they choose between issuing debt and equity.
followed more closely by analysts, we assume that asymmetric information decreases at a decreasing rate with a firm’s market value of equity. Consequently,
Ž .
we use the log of market value of equity Lmveq , to control for differences in asymmetric information that are due to differences in the amount of public information. Aside from differences arising from size, there is greater valuation uncertainty about firms with more growth opportunities. This suggests that asym-metric information is higher for firms with higher market-to-book ratios. The market-to-book ratio is already included as a variable in the compound probit from the model that predicts external financing, so we do not include it a second time with other asymmetric information variables. Finally, we include the standard
Ž .
deviation of market adjusted returns Stdret as a more direct measure of a firm’s valuation uncertainty. This standard deviation is estimated from the time-series of abnormal returns from days y127 to y2 relative to the issue announcement. Next, we look at information releases that may reduce asymmetric information.
Ž .
Korajczyk et al. 1992 suggest that managers can reduce the information asymmetry prior to an equity issue by releasing information before announcing the issue. To test whether split declarations reduce asymmetric information, we include two split-related variables, Dsplit and Sdays, in our analysis. Dsplit is a dummy variable that equals one if a split declaration occurs within 250 trading days prior to the issue announcement, and zero otherwise. Sdays is the number of trading days between the issue announcement and the preceding split declaration.
Ž .
Korajczyk et al. 1991 find evidence that the issue announcement return is negatively related to the time since the preceding earnings release. This suggests that earnings releases reduce asymmetric information. To control for this effect, we include the number of days between the issue announcement and the preceding earnings release, Edays, in our regression.
Ž .
Fama et al. 1969 present evidence that stock splits are associated with dividend increases. To control for dividend changes around equity issues and to test for a relation between dividends and asymmetric information, we include three
Ž .
indicator variables Ddivplus, Ddivneg, and Ddivzero , similar to the ones in Loderer
Ž .
and Mauer 1992 . Ddivplusequals one if the firm increased its dividend at the last dividend declaration before the issue announcement, and zero otherwise. Ddivneg
equals one if the firm decreased dividends before the issue announcement, and zero otherwise. Ddivzero equals one if the firm left its dividend unchanged before the announcement, and zero otherwise. To test for the effect of the timing of the dividend declarations around the issue announcement, we add another variable, Ddays, which equals the number of days between the issue announcement and the preceding dividend declaration. If the firm did not declare a dividend in the 250 days before the issue, then all four of the dividend variables are set to zero.
In summary, the asymmetric information variables are Lmveq, Stdret, MrB, Dsplit, Sdays, Edays, Ddivplus, Ddivneg, Ddivzero, and Ddays. Other publicly
observ-Ž .
cumulative stock return over the preceding 250 days, and the standard deviation of the market return. All financial ratios are computed from Compustat data for the most recent fiscal year that ends before the date of the observation.
5.2. Estimating the probability of equity issues
The first stage in our event study will estimate p , the probability that a firmi
Ž .
intends to issue equity, using the compound probit model given in Eq. 15 . This
Ž . Ž .
requires AissuingB ÕG0 and Anon-issuingB Õ-0 observations. To get our
i i
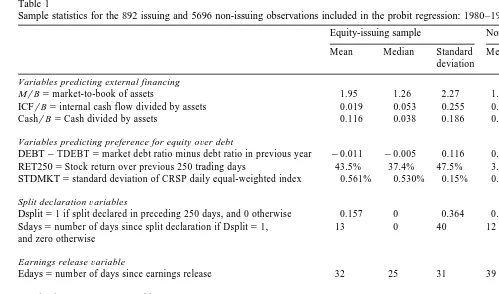
issuing sample, we begin with the sample of 1509 issue announcements described in Section 4.1. Of these, 589 observations had insufficient CRSP or Compustat data, leaving 892 issuing observations. To get our non-issuing observations, we used a random number generator to randomly select 15,000 security-days from the CRSP NASDAQ and NYSErAMEX files from 1980 to 1994. We deleted from this random sample all observations for which there was an SDC equity issue in the subsequent 250 trading days, and observations with insufficient CRSP and Compustat data. We were left with 5696 observations in our non-issuing sample. Table 1 tabulates the sample statistics for the variables included in the probit regression. The means and standard deviations are reported for the 892 issuing and 5696 non-issuing observations separately. We report t-statistics for differences across these groups. Because t-statistics would not reflect how Sdays interacts with Dsplit, or how Ddays interacts with the dividend dummies, we do not report
t-statistics for Sdays or Ddays.
From the t-statistics of Lmveq, Stdret, MrB, and ICFrB, we see that issuing
firms in the sample tend to be larger, safer firms with greater growth opportunities, and less internal cash flow. The t-statistics of RET250 and STDMKT show us that firms tend to issue after their stocks have had large price run-ups and during periods when the stock market is less risky. The t-statistics for Dsplitand Edays are preliminary evidence that firms are more likely to issue stock after declaring splits and shortly after earnings releases. Finally, the statistics for DEBT–TDEBT shows that firms issuing stock are more likely to have had their debt-to-market value ratios fall slightly over the previous year. These univariate statistics, however, do not control for the correlation between DEBT–TDEBT and other relevant vari-ables. In particular, the 43.5% mean run-up in share price before equity issues increases the denominator of the debt-to-market value ratio, decreasing the debt ratio of the issuing firms.
Table 2 presents the results of our compound probit regression. All of the coefficients have the signs predicted by the model developed in Section 5.1, although some are not statistically significant. From the coefficients of Lmveq, Stdret, CashrB and ICFrB, we see that equity issues are more likely to occur for
()
Sample statistics for the 892 issuing and 5696 non-issuing observations included in the probit regression: 1980–1994
Equity-issuing sample Non-issuing sample t-Statistic for the difference in mean Mean Median Standard Mean Median Standard
deviation deviation
Variables predicting external financing
a
MrBsmarket-to-book of assets 1.95 1.26 2.27 1.65 1.23 1.51 5.07
a
ICFrBsinternal cash flow divided by assets 0.019 0.053 0.255 0.044 0.069 0.166 y3.90
CashrBsCash divided by assets 0.116 0.038 0.186 0.126 0.060 0.162 y1.56
Variables predicting preference for equity oÕer debt
a DEBTyTDEBTsmarket debt ratio minus debt ratio in previous year y0.011 y0.005 0.116 0.009 0.003 0.112 y4.97
a RET250sStock return over previous 250 trading days 43.5% 37.4% 47.5% 3.7% 6.8% 48.7% 22.76
a STDMKTsstandard deviation of CRSP daily equal-weighted index 0.561% 0.530% 0.15% 0.586% 0.505% 0.25% y2.88
Split declarationÕariables
a Dsplits1 if split declared in preceding 250 days, and 0 otherwise 0.157 0 0.364 0.090 0 0.286 6.21
Sdayssnumber of days since split declaration if Dsplits1, 13 0 40 12 0 43
and zero otherwise
Earnings releaseÕariable
a
Edayssnumber of days since earnings release 32 25 31 39 31 37 y5.31
DiÕidend announcementÕariables
Ddivpluss1 if dividend increased in preceding 250 days, and 0 otherwise 0.114 0 0.318 0.099 0 0.299 1.38 Ddivnegs1 if dividend decreased in preceding 250 days, and 0 otherwise 0.014 0 0.120 0.023 0 0.150 y1.63 Ddivzeros1 if dividend did not change in preceding 250 days, 0.391 0 0.488 0.373 0 0.484 1.02 and 0 otherwise
Ddayssnumber of days since dividend announcement if 17 1 30 22 0 36
DdivplusqDdivnegqDdivzeros1, and zero otherwise
Firm-specificÕaluation uncertainty
a
Ž .
Lmveqslog market value of equity 5.08 4.96 1.57 4.59 4.40 2.11 6.61
a Stdretsstandard deviation of firm daily abnormal returns 2.71% 2.45% 1.50% 3.26% 2.55% 2.65% y5.98
Table 2
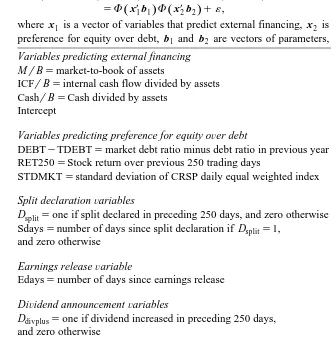
Coefficients from probit regressions of Dissue on the specified variables for 6588 observations from 1980 to 1994. Dissue equals one for the 892 observations with issue announcements, and zero otherwise. Z-statistics are reported in parentheses. The probit model is specified as follows:
Prob Issue EquityŽ .sProb External FinancingŽ .=Prob Issue EquityŽ NExternal Financing.
sFŽx1Xb1. ŽF xX2b2.q´,
where x is a vector of variables that predict external financing, x is a vector of variables that predict1 2
preference for equity over debt, b and b are vectors of parameters, and1 2 ´ is a random error
Variables predicting external financing
Ž .
MrBsmarket-to-book of assets 0.0901 1.55
aŽ .
ICFrBsinternal cash flow divided by assets y4.772 y7.05
aŽ .
CashrBsCash divided by assets y1.549 y4.64
aŽ .
Intercept 0.704 3.90
Variables predicting preference for equity oÕer debt
bŽ .
DEBTyTDEBTsmarket debt ratio minus debt ratio in previous year 0.522 2.17
aŽ .
RET250sStock return over previous 250 trading days 1.239 16.72
Ž .
STDMKTsstandard deviation of CRSP daily equal weighted index y12.886 y1.04
Split declarationÕariables
aŽ . Dsplitsone if split declared in preceding 250 days, and zero otherwise 0.656 3.85
aŽ .
Sdayssnumber of days since split declaration if Dsplits1, y0.0049 y4.16 and zero otherwise
Earnings releaseÕariable
aŽ .
Edayssnumber of days since earnings release y0.0023 y2.88
DiÕidend announcementÕariables
Ž .
Ddivplussone if dividend increased in preceding 250 days, y0.123 y1.18 and zero otherwise
Ž .
Ddivnegsone if dividend decreased in preceding 250 days, y0.235 y1.17 and zero otherwise
Ž .
Ddivzerosone if dividend did not change in preceding 250 days, y0.049 y0.63 and zero otherwise
bŽ .
Ddayssnumber of days since dividend announcement if y0.0025 y2.60
DdivplusqDdivnegqDdivzeros1, and zero otherwise
Firm-specificÕaluation uncertainty
a
Ž . Ž .
Lmveqslog market value of equity 0.078 4.33
Ž .
Stdretsstandard deviation of firm daily abnormal returns y2.493 y1.40
aŽ .
Significant at the 1% level using a two-tailed test.
b
Significant at the 5% level using a two-tailed test.
asymmetric information is relatively low, we find that equity issues are more likely shortly after split, earnings, and dividend announcements. In the second stage regression, we will test whether this strategy is effective. The coefficients of the dividend dummies are insignificant, which suggests that the likelihood of a split does not depend significantly on whether the latest dividend change was zero, negative, or positive, after controlling for RET250 and other variables that reflect the firm’s performance.
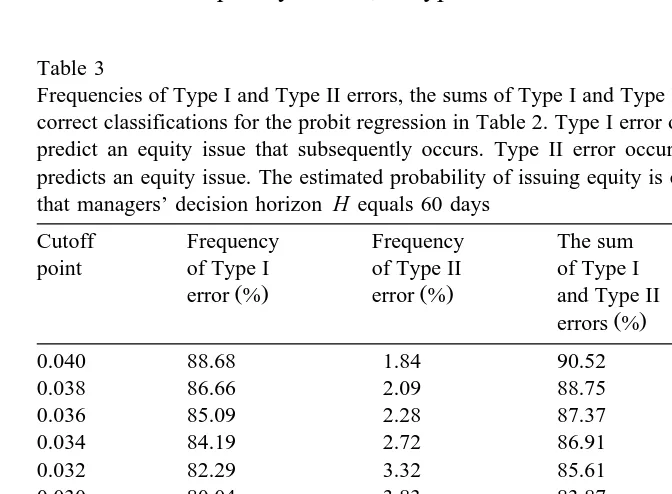
Table 3 gives statistics regarding the fit of the compound probit, after our
Ž .
corrections for unequal sampling. We describe these corrections in Section 5.3. The cutoff point is the minimum predicted probability for which we would predict an equity issue. Thus, if we use a cutoff of 0.04, we would predict an equity issue if the compounded probit had a predicted value of 0.04 or greater. Using our sample, we report the frequencies of Type I and Type II errors from our probit for different cutoffs. A Type I error occurs when the model does not predict an equity issue that subsequently occurs; a Type II error occurs when the model erroneously
Table 3
Frequencies of Type I and Type II errors, the sums of Type I and Type II errors, and the percentages of correct classifications for the probit regression in Table 2. Type I error occurs when the model does not predict an equity issue that subsequently occurs. Type II error occurs when the model erroneously predicts an equity issue. The estimated probability of issuing equity is computed under the assumption that managers’ decision horizon H equals 60 days
Cutoff Frequency Frequency The sum % Correctly
point of Type I of Type II of Type I classified
predicts an equity issue. As a benchmark, recall that the probability of a Type I error, given that the firm issues, plus the probability of a Type II error, given that the firm does not issue, will equal 100% for a naive model that uses no information. We can compare this to the sums of the frequencies of the Type I and Type II errors in Table 3.
As the cutoff point gets higher, the percentage of observations that are correctly classified increases. This is because only a very small number of our observations have equity issues. Naively predicting that none of the observations have stock issues would result in a large number of correct classifications, but would do nothing to explain how stock issues can be predicted. In Table 3, the sum of the frequencies of Type I and Type II errors is lowest at a cutoff of 0.012. The sum of the frequencies at this point, 58.15%, is much lower than the 100% we would get from a naive model. This shows that our model has considerable predictive power, even though substantial uncertainty remains. We generated similar statistics using a holdout sample. To be specific, we estimated the compound probit model using data from 1980–1992, then used the model to classify observations from 1993– 1994. At a cutoff of 0.024, the sum of the frequencies of Type I and Type II errors was 60.46%. This confirms that our model has significant predictive content.
In Section 5.3, we correct the predicted values of the compound probit for sampling biases. This gives us estimated probabilities of equity issues, for use in our second stage regression.
5.3. Correcting for unequal sampling
We use the procedure in Section 2.3 to correct the predicted values from the compound probit for unequal sampling. From information provided by the NAS-DAQ reference library7, there were approximately 30,216,282 security-days on NASDAQ, AMEX, and NYSE from 1980 through 1994, and 5071 seasoned equity issues on the three markets over this period. By definition, H equals the total number of security-days on which managers intend to issue, divided by 5071. This implies that the total number of security-days with ÕG0 is 5071 H, and the
i
total number with Õ less than zero is 30,216,282 minus 5071 H. Of these, our i
probit sample has 892 observations with ÕiG0, and 5696 observations with Õi-0. Expressing these numbers in terms of the parameters defined in Section
Ž .
2.3, we have SEs892, SNEs5696, nEs5071, and Ns30,216,282. Eq. 10 then becomes
p
ˆ
i cp
ˆ
iŽ
H.
sŽ
892. Ž
30,216,282y5071 H.
,Ž
28.
p
ˆ
iqŽ
1ypˆ
i.
5696 5071 H
Ž
. Ž
.
7
where p is the predicted value from the probit regression before adjusting for
ˆ
iunequal sampling, and H is the horizon. For reasons described in Section 2.3, we estimate our second-stage regression for HsT, 2T, and 4T, where T is the
average number of days between the issue announcements and the issues them-selves. For our equity issue sample, T equals 30 days.
This provides us with all that we need to estimate the second-stage regression
Ž .
given by Eq. 11 .
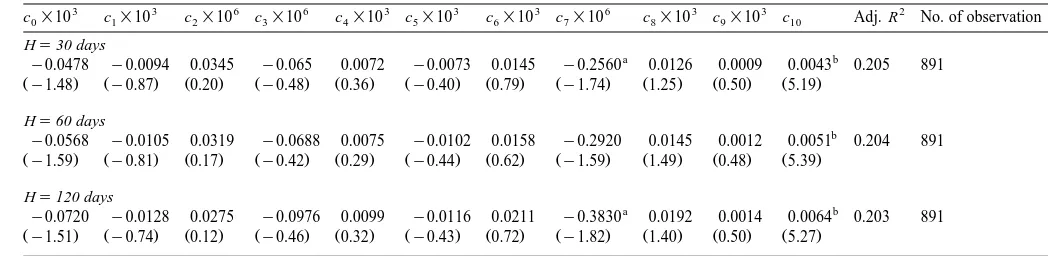
5.4. The effects of pre-issue information releases on information asymmetry
Ž .
Table 4 presents the results of the nonlinear regression in Eq. 11 . Coefficient estimates and t-statistics are very similar for different values of H. This suggests that our findings are not very sensitive to our assumptions about the average horizon of managers. In all of our regressions, ps y1 gave a better fit than
ps q1. This is consistent with the negative issue announcement returns observed
Ž . Ž .
by Asquith and Mullins 1986 , Kolodny and Suhler 1985 , Masulis and Korwar
Ž1986 , Mikkelson and Partch 1986 , Schipper and Smith 1986 , and Smith. Ž . Ž . Ž1986 . Recall that in our nonlinear regression 11 asymmetric information equals. Ž .
cXy , where c and y are the vectors of coefficients and variables, respectively.i i
This means that the coefficients in Table 4 give the effects of the variables on asymmetric information. Because asymmetric information is negatively related to
Ž .
issue announcement returns, a positive negative coefficient signifies that a
Ž .
variable has a negative positive effect on issue announcement returns.
Ž .
The coefficient of Stdret c10 is highly significant in all of the regressions. Stdret is the standard deviation of pre-issue market-adjusted returns, which measures valuation uncertainty. The positive coefficient of Stdret is consistent with the hypothesis that firms with more uncertainty have more asymmetric information and more negative issue announcement returns. Although the
coeffi-Ž .
cient of Ddays c7 is significant at the 0.10 level for some values of H, the negative sign of c would imply that there is less uncertainty as the time since the7
latest dividend announcement increases. Since this result is neither robust nor plausible theoretically, we take the marginal significance of c7 to be a Type I error.8 The statistics for Sdays, Edays, and Ddays are inconsistent with the hypothesis that asymmetric information is reduced by the timing of split declara-tions, earnings releases, and dividend declarations.
Together, Tables 2 and 4 show the effects of pre-issue announcements on anticipation and asymmetric information. Table 2 provides evidence that the timing of split, earnings, and dividend announcements can help investors antici-pate equity offerings. Table 4 presents evidence that asymmetric information is not materially affected by the timing of these announcements.
8
()
Nonlinear weighted least squares estimates of Eq. 11 y1 c
adjusted issue announcement return,fP andF P are the standard normal density and distribution functions, respectively, zsF p , andˆi pˆi is the estimated ex-ante probability that firm i would issue. If a split is declared in the 250 trading days before an issue announcement, then Dsplit equals 1 and Sdays equals the number of days between the split declaration and the issue announcement; otherwise both Dsplitand Sdays equal 0. Edays and Ddays are the number of trading days between the issue announcement and the preceding earnings release and dividend announcement, respectively. Ddivplus, Ddivzero, and
Ddivneg equal one if dividends are increased, unchanged, or decreased at the last dividend declaration before the issue announcement. If a firm does not pay dividends, then Ddivplus, Ddivzero, and Ddivnegequal 0. MrB is market-to-book of assets. Lmveq is the natural logarithm of market value of equity. Stdret is
the standard deviation of market adjusted returns in the pre-event period. Each observation is weighted by the standard deviation of market adjusted returns in the pre-event period. Coefficients are estimated under three different assumptions about H, the horizon of managers. t-statistics are in parentheses
3 3 6 6 3 3 3 6 3 3 2
c0=10 c1=10 c2=10 c3=10 c4=10 c5=10 c6=10 c7=10 c8=10 c9=10 c10 Adj. R No. of observation
Hs30 days
a b
y0.0478 y0.0094 0.0345 y0.065 0.0072 y0.0073 0.0145 y0.2560 0.0126 0.0009 0.0043 0.205 891
Žy1.48. Žy0.87. Ž0.20. Žy0.48. Ž0.36. Žy0.40. Ž0.79. Žy1.74. Ž1.25. Ž0.50. Ž5.19. Hs60 days
b
y0.0568 y0.0105 0.0319 y0.0688 0.0075 y0.0102 0.0158 y0.2920 0.0145 0.0012 0.0051 0.204 891
Žy1.59. Žy0.81. Ž0.17. Žy0.42. Ž0.29. Žy0.44. Ž0.62. Žy1.59. Ž1.49. Ž0.48. Ž5.39. Hs120 days
a b
y0.0720 y0.0128 0.0275 y0.0976 0.0099 y0.0116 0.0211 y0.3830 0.0192 0.0014 0.0064 0.203 891
Žy1.51. Žy0.74. Ž0.12. Žy0.46. Ž0.32. Žy0.43. Ž0.72. Žy1.82. Ž1.40. Ž0.50. Ž5.27. a
Significant at the 10% level using a two-tailed test.
b
5.5. Comparison with earlier studies
Some of our findings contrast with those of previous studies. Korajczyk et al.
Ž1991 present evidence at the 10% significance level that issue announcement. Ž .
returns are negatively related to the days since the preceding earnings releases.
Ž .
Loderer and Mauer 1992 find that issue announcement returns are lower for dividend-paying stocks. After controlling for anticipation and cross-sectional differences in asymmetric information, we do not find either of these effects. Given our more extensive data and more sophisticated methods, it is not surprising that our results differ. Notwithstanding, it is instructive to look more carefully at the reason for these differences. We want to know how important it is to control both for anticipation, and for the cross-sectional variation in uncertainty, as measured by MrB, Lmveq, and Stdret.
We turn to the anticipation question first. Table 5 reports mean and median predicted probabilities from the compound probit model under various assump-tions about the managers’ horizon, H. Two things are immediately evident. First, the predicted probabilities are over twice as large for firms that subsequently issue equity than for firms that do not issue. This is further evidence that equity issues can be anticipated, to some extent. The second thing that emerges from this table is that the predicted probabilities are very small in magnitude. Even when we use the longest horizon of 120 days, the average pre-issue probability of an equity issue is only 4.21% for the sample that subsequently issued. To look at this another way, there was almost a 96% chance that these firms would not issue. These numbers suggest that anticipation played only a minor role.
To look at the importance of controlling for cross-sectional variation in uncertainty, we use the methods of earlier studies, with our data and control variables. Table 6 summarizes the results. The regression in the first column uses market adjusted issue announcement returns as the dependent variable, and
Table 5
The predicted probability of issuing equity after correcting for unequal sampling
Ž . Ž .
N Mean % Median %
Hs30 days
Issuing sample 892 1.10 0.81
Non-issuing sample 5696 0.49 0.36
Hs60 days
Issuing sample 892 2.17 1.62
Non-issuing sample 5696 0.97 0.72
Hs120 days
Issuing sample 892 4.21 3.22
Table 6
Using the traditional event-study procedure to examine issue announcement abnormal returns for the period 1980–1994. Estimated coefficients from regressions of abnormal issue announcement returns on the specified variables. The dependent variables for Model 1 and Model 2 are ARmk t and ARmm, respectively. ARmk t is the three-day market adjusted issue announcement return. ARmm is the three-day abnormal return estimated from a market model regression. If a split is declared in the 250 trading days before an issue announcement, then Dsplitequals one and Sdays equals the number of days between the split declaration and the issue announcement; otherwise both Dsplitand Sdays equal zero. Edays and Ddays are the number of trading days between the issue announcement and the preceding earnings release and dividend announcement, respectively. Div equals one if dividends are declared before the issue announcement, and zero otherwise. Ddivplus, Ddivzero, and Ddivneg equal one if dividends are increased, unchanged, or decreased at the last dividend declaration before the issue announcement. If a firm does not pay dividends, then Ddivplus, Ddivzero, and Ddivnegequal zero. MrB
is market-to-book of assets. Lmveq is the natural logarithm of market value of equity. Stdret is the standard deviation of market adjusted returns in the pre-event period. Model 1 is estimated with weighted least squares, using the standard deviation of market adjusted returns in the pre-event period as the weights. Model 2 is estimated using ordinary least squares. t-statistics are in parentheses
Dependent variable Model 1 ARmk t Model 2 ARmm
a
Ž . Ž .
Intercept y0.0039y0.51 y0.0504 y4.85
Ž . Ž .
Dsplit 0.0027 0.50 y0.0049y0.63
y4 Ž . Ž .
Sdays=10 y0.0077y0.01 0.5860 0.79
y4 Ž . Ž .
Edays=10 0.1768 0.40 0.8789 1.55
Ž . Ž .
Ddivplus 0.0001 0.01 0.0093 1.29
Ž . Ž .
Ddivneg 0.0027 0.27 0.0109 0.71
Ž . Ž .
Ddivzero y0.0035y0.83 0.0048 0.87
y4 Ž . Ž .
Ddays=10 0.6095 1.20 y0.5117y0.70
b
Ž . Ž .
MrB y0.0015y1.34 y0.0014 y1.66
a
Significant at the 1% level using a two-tailed test.
b
Significant at the 10% level using a two-tailed test.
weights each observation by the inverse of the standard deviation of the abnormal
Ž .
returns, as in Korajczyk et al. 1991 . The second column uses issue announce-ment abnormal returns estimated from a market model regression, with data from the 150-day period starting 169 days before the announcement day, and does not weight the observations. This is similar to the procedure used by Loderer and
Ž . w x
Mauer 1992 . Unlike these earlier studies, we use three-day y1 to q1 issue
w x
the average 3-day market-model prediction error is y2.79%. These estimated issue announcement returns are in line with those reported in earlier studies
ŽBayless and Chaplinsky, 1996 and others ..
Unlike the nonlinear regression in Table 4, the simple regressions in Table 6 do not distinguish between the effects of anticipation and asymmetric information. Because so little of an equity issue announcement is anticipated, however, anticipation probably has very little effect on the coefficient estimates. When comparing Tables 4 and 6, recall that the coefficients in Table 4 estimate the association of the regressors with vi or asymmetric information. Under the assumption that asymmetric information is inversely related to issue announce-ment returns, the coefficients of Table 6 should have the opposite sign.
Both of the methods used in Table 6 support our earlier finding that issue announcement returns are significantly affected by firm variables associated with asymmetric information, but not by the timing of pre-issue earnings, dividend, or split announcements. A quick comparison of Tables 4 and 6 suggests that the
Ž .
relatively simple method of Korajczyk et al. 1991 gives similar results to our conditional event study, at least in this case when the probabilities of the event are small. For other investigations where anticipation is stronger, the benefits of the conditional event study will be greater. We also see that it is very important to control for cross-sectional differences in asymmetric information, before testing for the effect of pre-issue releases of information.
6. Conclusions
This paper makes three principal contributions. First, we provide a conditional event-study method that allows uncertainty about managers’ private information to vary across firms. This permits researchers to test hypotheses about asymmetric information while controlling for event anticipation. Our method also addresses the sampling problem that arises in a conditional event study when the ex-ante probability of an event is estimated from event announcement data.
Second, this paper explicitly models a firm’s equity-issue decision and exam-ines the issue and no-issue choice for US firms during the period of 1980–1994. Our results indicate that the timing of stock split, dividend and earnings announce-ments can help investors to anticipate equity issues. In addition, as predicted by our equity-issue model, we find that equity issues are more likely for larger safer firms with higher debt, less cash, and less internal cash flows. There is also evidence that equity issues are more likely when stock markets are less risky, and after the firms’ stock prices have increased substantially.
cross-sectional differences in valuation uncertainty, but not by the timing of split, dividend, or earnings announcements.
Acknowledgements
We gratefully acknowledge the helpful comments of Robert Korajczyk, James Seward and three anonymous referees. We would also like to thank Mike Barry, Hamid Mehran, Robert Taggart, Sheridan Titman, William Wilhelm, workshop participants at Boston College and the University of Massachusetts at Amherst for their comments on an earlier version of the paper.
Appendix A. Estimated event probability after correcting for unequal sam-pling
Note that the joint probability that firm i intends to issue and is in our sample equals
w
x
w
x
Prob i intends to issueNi is in the sample =Prob i is in the sample
w
x
w
x
sProb i is in sampleNi intends to issue =Prob i intends to issue . A.1
Ž
.
This can be expressed
w
x
cp
ˆ
i=Prob i is in the sample sP p .Eˆ
iŽ
A.2.
Note that
w
x
c cProb i is in the sample sP pE
ˆ
iqPNEŽ
1ypˆ
i.
,Ž
A.3.
Ž . Ž .
where P equals SE ErN , and PE NE equals SNEr NyN . Substituting Eq. A.3E
Ž .
in Eq. A.2 , we have
c c c
p P p
ˆ
i Eˆ
iqPNEŽ
1ypˆ
i.
sP p .Eˆ
iŽ
A.4.
c Ž .
Solving for p from Eq. A.4 gives
ˆ
ip
ˆ
i cp
ˆ
is P .Ž
A.5.
E
p
ˆ
iqŽ
1ypˆ
i.
PNE
References
Acharya, S., 1988. A generalized econometric model and tests of a signaling hypothesis with two discrete signals. Journal of Finance 43, 413–429.