R
URA L
E
C O NO MY
Choice Environment, Market Complexity and Consumer
Behavior: A Theoretical and Empirical Approach for
Incorporating Decision Complexity into Models of
Consumer Choice
Joffre Swait and Wiktor Adamowicz
Staff Paper 99-04
Sta ff Pa p e r
Department of Rural Economy
Faculty of Agriculture, Forestry
and Home Economics
Choice Environment, Market Complexity and Consumer
Behavior: A Theoretical and Empirical Approach for
Incorporating Decision Complexity into Models of
Consumer Choice
Joffre Swait and Wiktor Adamowicz
Staff Paper 99-04
Joffre Swait is Partner, Advanis Inc. and Adjunct Professor, University of Florida. Wiktor
Adamowicz is Professor, Department of Rural Economy, University of Alberta.
Choice Environment, Market Complexity and Consumer Behavior: A Theoretical and
Empirical Approach for Incorporating Decision Complexity into Models of Consumer
Choice
Abstract
Most empirical models of consumer choice assume that the decision-maker assesses all alternatives and information in a perfect information processing sense. The complexity of the choice environment, the ability of the individual to make complex decisions and the effect of choice context on the decision strategy, are generally not considered in statistical model development. One of the reasons for this omission is that theoretical literature on choice complexity and imperfect ability to choose has not been translated into empirical methods that permit such considerations in econometric analysis. In this paper we outline a theoretical model that considers task complexity, effort applied by the consumer, ability to choose, and choice. We then construct a measure of task complexity and incorporate this in a random utility model. We employ this model in the analysis of a number of data series. Our findings suggest that task complexity does affect inferences about choice model parameters and that context effects, like complexity, have a systematic effect on the parameters of econometric models of choice. Not accounting for complexity or context effects will result in significant bias in the estimated preference parameters.
1. INTRODUCTION
Choices made either in actual markets (revealed preference or RP) or in hypothetical ones (stated
preference or SP) can provide information about the preferences of individuals. These choices also contain
what researchers interpret as “noise” or unexplained variation. A variety of modeling techniques have been
used to understand preferences and separate “parameter” signal from noise. However, in applying these
modeling tools we have tended to focus on the information provided by the choices themselves, to the
detriment of understanding the effect of the choice environment or the task demands on the observed choice
behavior, the quality of the information provided, and noise levels. We have typically not been concerned
with the degree of involvement of the consumer in the decision making task, or with the fact that the
consumer has scarce information processing resources and he/she must make decisions regarding the
allocation of these resources to the myriad of tasks that require them in their daily lives.
This lack of consideration of the decision environment in modeling consumer choice is surprising
given the wealth of literature in Behavioral Decision Theory (BDT) showing that task complexity and the
specifics of the choice environment affect consumer choices (see, e.g., Payne, Bettman and Johnson
[1993]). Furthermore, there are significant theoretical contributions (Heiner [1983], de Palma et al. [1994])
that outline the implications of choices made by consumers with limited abilities to process information or
consumers who respond to complex situations by making "imperfect" choices.
In this paper we construct a theoretical model of choice (based on dePalma et al. [1994]) that
includes market and task complexity and a constraint on the amount of processing resources available. We
use this theoretical model and an empirical measure of the complexity of the choice environment to test the
hypothesis that consumers subject to increasing complexity appear as if they have less ability to make
"accurate" choices and thus, over the sample of respondents and contexts, preferences are characterized by
different levels of variance.
strongly supported results from the BDT literature; further, (2) we show that this relaxation adds
significantly to our capabilities to model and understand consumer behavior in real and hypothetical
markets by recognizing the role and impact of decision context on decision makers; finally, (3) we
formulate empirically testable models incorporating decision context into random utility models of choice
behavior.
The structure of the paper is as follows: we begin by motivating, presenting and discussing a
theoretical model of decision maker behavior incorporating effects of choice environment complexity; next,
we show how empirical models of choice behavior can be developed from these considerations; thirdly, we
apply a model to examine a number of different data sets pertaining to choices of both private and public
goods, and examine the statistical evidence for the impact of complexity on choice; finally, the paper
concludes with a discussion of the implications of the results for the future study of choice behavior, both
for applications and further research.
2. THEORETICAL MODEL
Several authors have outlined how they expect the complexity of the choice environment, or the
imperfect processing capability of the consumer, to affect choice and demand. These topics are not the
same, but if one allows for imperfect processing capability, increasing complexity of the choice task will
appear as a reduction in processing capability. Below we summarize the theoretical literature in economics
and behavioral decision theory on these issues.
2.1 Task Environment, Respondent Processing Ability and Choice Outcomes
2.1.1 Economic Theory
A number of authors in the economics literature have discussed potential limitations on individuals’
ability to process information and the implications of these limitations on choice behavior. Much of this
literature relates to choices under uncertainty (e.g. difficulty in evaluating risks, ambiguity or lack of
information about the risks, and difficulty in decision making under risk). Uncertainty about the attributes
[1983] argues that agents cannot decipher the complexity of the situations they face and thus make
seemingly sub-optimal decisions. He argues that the complexity and uncertainty surrounding a choice
situation often leads consumers to adopt simplified strategies. Heiner suggests that more effort should be
expended to understand the role that complexity plays in choice behavior.
De Palma et al [1994] present a more formal examination of the processing limitation argument.
They model consumers with different abilities to choose; an individual with lower ability to choose is
assumed to make more errors in comparisons of marginal utilities. They outline the implications of limited
processing capability on choice and discover that heterogeneity in the ability to choose over a sample of
individuals produces widely different choices, even if in all other aspects (including tastes) the individuals
are identical. In our context, we suggest that the complexity of the decision problem will affect the ability to
choose, and thus for any given individual, ability to choose will differ depending on the task demands.
Similar conclusions arise from the literature on “bounded rationality” (March [1978]; Simon [1955]).
While there has been some literature in economics on processing limitations and complexity, there
are relatively few published empirical applications of this literature on processing limitations. A notable
exception is Mazzotta and Opaluch [1995] whose objective is to empirically test the validity of Heiner’s
hypothesis concerning complexity and choice behavior. Mazzota and Opaluch relate complexity in a
contingent behavior choice task to variance in an econometric choice model, which is a restricted form of
the model we present subsequently. They find support for the hypothesis of imperfect cognitive ability and
for the notion that increasing complexity increases the “noise” associated with choice.
2.1.2 Behavioral Decision Theory
In contrast to the relative paucity of treatment in the economics literature, there is a rich literature
in Behavioral Decision Theory on responses to complexity and task demands, including theoretical and
empirical investigations. The leading theories on response to the decision environment are summarized in
trade off between cognitive effort and outcome accuracy. Shugan [1980], for example, suggests that the
costs of decision making to the individual are associated with his or her limited processing capability, the
complexity of the choice, time pressure and other factors. He constructs a conceptual “confusion index”
which attempts to measure the effort required by the individual to make the choice. In a similar vein,
Bettman et al. [1993] examine the impact of task complexity, measured as the degree of negative
correlation between attributes, on the decision making strategy chosen by the consumer. These researchers
suggest that providing more difficult choices may lead to richer information on preferences as
respondent-processing effort increases with complexity.
However, alternatives to the effort-accuracy tradeoff conceptualization have also been advanced. It
has been suggested that individuals may attempt to avoid conflict in situations where choices are complex,
leading to the use of simpler choice heuristics when attributes are negatively correlated. For example,
Keller and Staelin [1987] propose that complexity may have an inverted U-shaped relationship with
decision effectiveness. That is, as the situation becomes more complex, individuals initially exert additional
effort and become more effective, until a point is reached where their effectiveness begins to deteriorate.
In a related body of literature, the complexity of choice environments is related to the propensity to
“avoid” choice by deferring choice or choosing the status quo. Tversky and Shafir [1992] show that when
the choice environment is made complex (by adding alternatives or making the choice alternatives similar,
but not identical), some individuals opt to delay choice, seek new alternatives, or even revert to a default (or
status quo) option. Dhar [1997a, 1997b] reports similar results and shows that consumers may select not to
choose in order to avoid difficult tradeoffs. Similar findings by Olshavsky [1979], Payne [1976], Payne et
al.[1993] and Simonson and Tversky [1992] suggest that the context and complexity of the decision, as
described by the number of attributes, correlation between attributes, number of alternatives, time pressure
and various other factors, significantly influence decisions.
In summary, researchers in Behavioral Decision Theory have convincingly illustrated how changes
these findings have not been translated into approaches for modeling choices. Nor have they been
incorporated into econometric models to isolate the factors that these models are commonly designed to
assess, responses to changes in attribute levels, from the responses to task complexity and decision
environment.
2.2 A Model of Task Environment, Respondent Processing Ability and Choice Outcomes
2.2.1 Theoretical Framework
Our theoretical model builds on the "discrete choice" framework developed by de Palma et al.
[1994], who postulate that a consumer's ability to choose creates the variance associated with choice.
Individuals with poor abilities are characterized as having "high variance" associated with their choices.
Our approach is also based upon a framework that allows the ability to choose to be endogenously
determined, and illustrates that the ability to choose is influenced by the complexity of the task. The
consumer can decide to apply additional effort to a specific task, which then increases their ability to
choose, but the more complex the task, ceteris paribus, the lower the ability to choose.
Assume that an individual chooses from a discrete set of "goods" labeled y1,…,yJ with associated
vectors of quality attributes x1,…,xJ. The numeraire good is z. The budget constraint is
∑
=for i=1,…,J, where M is income. In addition to the income constraint, the utility maximization problem is
formulated by adding constraints that require the products of quantities xyi be zero, and the amount
purchased of good i is set to yi *
(the optimal quantity of i) or zero. This makes the utility maximization
problem a choice over mutually exclusive alternatives. The formulation is presented below.
This is the discrete choice problem formulation provided by Hanemann [1982]. The conditional indirect
utility function arising from such a formulation, along with judicious choice of a random component to
append to the deterministic utility component, yields the conditional logit model (Hanemann [1982]).
Suppose, however, that the problem is compounded because the decision-maker also optimizes
over the level of effort to commit to finding the utility maximizing alternative. Effort is allocated over all
"blocks" of goods. In other words, if an individual faces several mutually exclusive choice problems, like
the one listed above, plus the choice of numeraire good, the consumer must allocate scarce mental effort
resources over these various choice problems. Within a single choice set, if no effort is applied all
alternatives look identical to the decision-maker, while with additional effort the differences between
alternatives become more apparent. Effort functions as a "fine-tuning" device that allows the
decision-maker to identify the differences between the alternatives and select the alternative that yields maximum
utility. Without applying effort, choice among J alternatives is essentially random and the optimal
alternative will be selected with probability 1/J. Within a single choice set, this is exactly the process
outlined in de Palma et al [1994, p. 424]: "When there is no ability to choose, discrete choices are
equiprobable, irrespective of differences in the true marginal value of alternatives; and when the ability to
choose is perfect, the best choice is made with certainty." However, in our model the ability to choose is
influenced by the effort that the consumer places on that task. This effort decision is made based on the
allocation of total effort over all choice tasks.
While the ability to choose the utility maximizing alternative depends on the level of effort applied,
it also depends on the "complexity" of the task facing the individual. With no effort applied even the
simplest task will not yield the utility maximizing alternative. Conversely, even with significant amounts of
effort, very complex tasks may prove too difficult for the consumer to assess and choose the best option.
Thus, effort (which generates the ability to choose) and complexity of the task interact in the choice
variable choices, resulting from low effort levels, or complex tasks, or both.1
Let Ek represent effort, where k indexes the choice problems that the consumer faces within the
planning horizon, so that groups of discrete choice problems are identified by k = 1 ,…,K. Let B be the
effort budget. Quantities B and E are unobservable, internal factors. Finally, let Hk represent the
complexity of the task of selecting an option in choice set k (or the complexity of the choice environment
for this set).2 The consumer’s decision problem now is
i
Simplifying the problem further, suppose that there are only two sub-problems, choice from the
discrete set of alternatives (yi) and choice of the quantity of the numeraire good. Effort E1 is allocated to the
discrete choice problem, and E2 for the numeraire. The maximization problem becomes
i
The consumer chooses how much effort to allocate based on the "return" to effort allocation in
utility terms. Consumers will place more effort on choices that have the potential to yield more utility. If,
for example, a consumer is choosing between several brands of cola, making the "correct" choice from this
1
set may not yield as much increased utility as would arise from making the correct choice of dinner entrée.
The marginal contribution of additional units of effort becomes, therefore, part of the calculus of the
consumer. One would assume that effort is allocated based on the "product class" of the good being
examined: low cost item decisions may be provided with little effort, while high cost items may be
supported by significant effort. The importance of the class of goods to the individual (in utility terms) will
also influence the level of effort. Finally, the complexity of the situation will influence the allocation of
effort. If there are significant returns to allocating effort to discover the best alternative, the consumer will
do so. However, if the returns are low (in terms of making the best choice from this choice set, and of not
taxing the effort that needs to be used in other choice tasks), the consumer will not allocate more effort to
the task.
Subsequently we show that by employing random utility theory and making certain assumptions
about the distribution of the stochastic elements, this form of direct utility will translate into probabilities of
choosing an alternative that have the following form:
∑
where V is the indirect utility function (a function of the attributes of the alternatives), n indexes the
individual (or the task facing the individual), Dn is the set of alternatives the individual chooses from, and
µ
is the scale factor which is inversely related to the error variance in the random utility model. Note thatµ
is a function of effort (E) and complexity (H), since these affect the variance of the error of utility. As inde Palma et al. [1994], we interpret this scale factor as a representation of the ability to choose, although in
our formulation the ability to choose is a function of an exogenous factor (complexity) and an endogenous
2
factor (effort).3 In what follows we outline the detail behind this formulation of the probability of choice.
This framework suggests that complexity, effort and ability to choose should be incorporated
within the consumer choice model. However, effort is essentially unobservable to the analyst. We could
make observations of the amount of time that decisions take, or employ self-reported metrics; however,
these are weak proxies for the amount of mental capacity used in a choice task. Instead, we take the
following approach. If individuals are assumed to choose effort levels based on their inherent abilities and
the general "importance" of the good in term of proportion of budget, then we should observe systematic
effects on the variance of utilities (a measure of preference “noise”) as the complexity of the choice task
changes, as the importance of the good to the consumer changes, and as the inherent abilities (effort
budgets) of consumers change. Regarding complexity, if choices are "simple" (i.e. choice sets with
dominant alternatives) we should observe low variability in responses or low error variances as even for
individuals with limited inherent ability to choose, or for goods that are relatively unimportant, the utility
maximizing choice can be made with minimal effort. In cases where the choices are complex (e.g.
negatively correlated attribute differences, alternative levels that are different and require the individual to
make difficult trade-off decisions) we should expect higher variance in preferences. This occurs because
some or all consumers are not employing sufficient effort to clearly identify the utility maximizing
alternative, thus leading different consumers to make different choices, even if all consumers are identical.
This same theoretical result has been hypothesized by both De Palma et al. [1994] and Heiner [1983].
Thus, we expect a significant relationship between the level of complexity of the choice task, and the error
variance present in preference measurements.
Similarly, one should be able to identify changes in variability with changes in inherent ability to
choose, and with changes in type of product. One could hypothesize that income, education and other
factors influence the inherent ability to choose and thus influence the total effort budget. However, this does
3
not mean that individuals with higher income levels, for example, would always appear to make lower
variance choices. It may be that as income rises individuals make different choices as to the allocation of
their scarce effort resources, leading to greater variability in preferences. In the same vein, one would
expect different patterns of response to complexity across different types of goods. However, to fully test
these hypotheses one would require information on the same individuals, for a variety of products. Thus, in
this paper, we focus on the response of consumers to different levels of complexity, in terms of their
apparent ability to choose.
2.2.2 Formal Representation of Choice Complexity
While we have discussed complexity of the task as a key component to understanding choice, we
have not formalized this relationship. Task demands (or the choice environment) can be characterized by
such factors as choice set size (the number of alternatives the individual is choosing from), the number of
attributes under consideration within alternatives in a choice set, the correlation structure of the attributes
of the alternatives in the choice set, the number of and sequence of choices the individual is asked to make
during the “task”, as well as a variety of other factors.
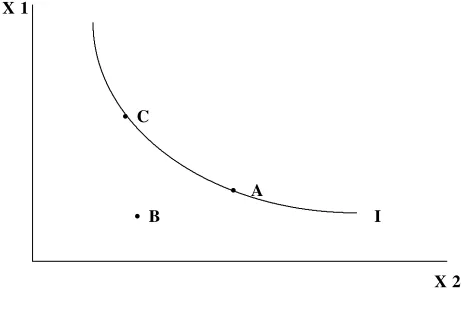
One view of task complexity is illustrated by Figure 1, in which an individual is presented with
alternatives (A, B, and C) in attribute space (X1,X2). One of the individual’s indifference curves is
depicted as I. If the individual is asked to choose between A and B it is clear that A dominates B and the
demands on the individual, in terms of choice complexity, are relatively low. Situations that force
consumers to make tradeoffs, like choosing between A and C, are more challenging and reveal more
information about preferences, albeit imposing greater cognitive demands on individuals. Situations in
which there are very small deviations over a number of attributes, say, for two alternatives that are nearly
identical in utility terms, may yield the most information about preferences. However, these are probably
the most complex situations requiring the most effort to identify the utility maximizing alternative.
Consider next the case illustrated in Figure 2: preferences, illustrated as the shaded indifference
The uncertainty about preferences can be exacerbated by task demands and may result in less consistency
in preferences, leading to higher variance in statistical models.
Figure 1 - Preferences and Alternatives
Figure 2 - Uncertain Preferences and Alternatives
The objective of this section is to characterize the complexity of choice environments through a
X 1
X 2
• C
• B
• A
I
X1
X2
• C
• B
• A
measure that can capture its various dimensions. Ideally, such a measure will parsimoniously represent
complexity so that it can be easily incorporated into a choice modeling framework. Some dimensions of
such a measure have already been discussed above (the number of attributes, the number of alternatives,
negative correlation of attributes, etc.). Note, however, that each of these quantities is a component of
complexity rather than an overall measure.
Distance between alternatives in attribute space, which is related to the correlation structure of the
attributes, is a candidate for capturing the degree of overall complexity involved in a choice context.
Suppose we wish to examine choice sets with 3 alternatives, described by K-vectors of attributes xA, xB
and xC. These distance measures can generally be constructed as sums of distance norms (e.g. absolute
value distance or Euclidean distance) for vectors xi and xj, i,j∈{A,B,C}. In Figure 1, for example, the
calculation of the difference in attribute levels would represent the dominance of alternative A over B as a
large positive value. If two alternatives are very similar, these metrics will produce a small value. While
such measures would reflect the distance between alternatives in attribute space, they may not capture the
number of alternatives in the measure of complexity. These measures also require that all attributes be
commensurable, a requirement that generally cannot be met.
In order to design a more complete, and a more formally defined, measure of complexity, we turn
to information theory to provide a measure of information content or uncertainty. Information theory refers
to an approach taken to characterize or quantify the amount of information contained in an experiment or
phenomenon (Soofi, [1994]; Shannon, [1948]). Given a set of outcomes (or alternatives, in our context)
}
,...,
1
,
{
x
jj
=
J
that are described by a probability distributionπ
(
x
)
, the entropy (or uncertainty) of thechoice situation is defined as4
∑
≥
−
=
=
j
j j
x
x
x
H
X
In a case with J alternatives in a choice set, entropy reaches its maximum if each of the J are equally likely.
If the number of equally likely alternatives increases, entropy also increases. Thus, the number of
alternatives in the choice set directly affects the level of complexity, making this measure a useful
mechanism for testing hypotheses regarding the impact of the number of alternatives on choice variance.
Entropy is minimized if there is one dominant alternative in the choice set. For example, if one alternative
has a probability of one and the others have probabilities of zero, entropy achieves its minimum of zero.
The number of attributes and degree of attribute correlation also play a role since these elements will affect
the assignment of probabilities
π
(
x
)
.An alternative approach would be to include the basic elements of complexity (number of
attributes, number of alternatives, the measure of Euclidean distance described above, etc.) and interactions
between these measures, as separate elements in the statistical model. This approach, however, significantly
increases the number of parameters to be estimated, will likely introduce collinearities in the model, and
moves away from the simplicity of using a single measure of information content as the indicator of the
complexity of a decision situation.
Our measure of task complexity is incorporated into a discrete choice econometric model as a
parametrization of the variance (or scale) of the stochastic error term of the utility function. This implies,
of course, that the proposed model will be heteroscedastic in form. While details on the econometric model
and the incorporation of the complexity factor in the variance term are described below, it is important to
note now that in models of the probit/logit form (widely used in the discrete choice modeling literature),
heteroscedasticity will result in bias, not just in a loss of efficiency (Yatchew and Griliches, [1984]); and
furthermore, if the heteroscedasticity involves the same elements as the independent variables, the bias
increases. Hence, to the extent that our hypothesis that the effort/complexity interaction impacts preference
variance is supported, the implications for discrete choice modeling practice will potentially be serious.
4
3. THE STATISTICAL MODEL
3.1 Model Derivation
The theoretical model described above suggests that the variance associated with preferences will
be influenced by the level of complexity of the task and the effort applied by the individual. For the
construction of the statistical model we assume that variance is affected only by complexity and suppress
the effort element (E) for simplicity, though we recognize that both effort and complexity should be
included as arguments. Suppose that a certain complexity level
C
n arises from the alternatives of the nthchoice set
D
n (where n is the index of an individual decision-maker, in the case of RP data, or the index ofa decision-maker/replication combination in the case of SP data). Suppose further that the utility function
for the ith alternative in
D
n is additive, as below:in in in
V
U
=
+
ε
, (2)where
V
in is the systematic component andε
in is the stochastic component. As postulated in the previoussection, we assume that complexity
C
n affects the utilities only through the stochastic component. Moreprecisely, we shall assume that differences in complexity generate differential consistency levels in
preferences across individuals, which will be reflected in (2) by affecting the variances of the assumed
distribution for the disturbances.
The probability that individual n chooses alternative
i
∈
D
n is given by}
very familiar Multinomial Logit (MNL) model from (3) (see Ben-Akiva and Lerman, [1985], chapter 5).
We shall suppose, however, that the
ε
in’s are Gumbel distributed, independent across n andn
C
the error terms are independent but not identically distributed. The density functions for the individual error
terms are given by (see, e.g., Ben-Akiva and Lerman, [1985])
,
Our derivation is somewhat, but not unduly, complicated by the assumption that the scale factors
vary by individual observation, specifically, as a function of the complexity facing the individual,
C
n.Multiply (1) by the scale factor
µ
n(
C
n)
to obtainSay that the random variable
η
is Gumbel distributed with scale factorµ
. Then it is a property of theGumbel distribution (see Ben-Akiva and Lerman [1985], 105) that, for any scalar
α
>
0
,αη
is alsoGumbel distributed, but with scale factor
µ
/
α
. Therefore in (5) the random variablesµ
n(
C
n)
ε
in, for alln and
i
∈
D
n, are IID Gumbel with unit scale factors. Thus, if we multiply both sides of the probabilisticevent in (3) by
µ
in≥
0
, we leave the probability statement unchanged:}
the purpose of treating heteroscedasticity within the context of the MNL model.5,6
The Heteroscedastic MNL model (7) has basically the same properties as the MNL model, notably
translational and rotational invariance, Independence of Irrelevant Alternatives (IIA) and uniform
cross-elasticities. However, when a variable is common to the mean of the utility and its variance, the elasticity
contains two components: a direct effect arising from changes in the means and an indirect effect from
changes in variance. 7 For example, if price is in the utility function and is also a component of a
complexity index in the variance, a price increase for one alternative will have the usual direct effect of
reducing the attractiveness of this alternative. However, if this price increase makes the products more
similar, it will increase the difficulty associated with choice in the marketplace. This may increase variance
and could lead to an additional decrement in the choice probability. If the attribute change leads to
complexity reductions, the indirect effect could offset the direct effect. Thus, market share elasticity
depends not only the attributes of the alternatives but also on market conditions or the positioning of
available alternatives.
3.2 Incorporating the Effect of Choice Complexity in the Choice Model
As we argued previously, the complexity of the situation is assumed to affect the stochastic utility
5
The parallel between this derivation and that used to derive heteroscedasticity corrections for the general linear model should be apparent.
6
Note that the derivation of (7) assumes that the scale factors vary only by individual and not by alternative. If the scale factors vary by alternative, then probabilities (3) and (6) will not be equal. Swait and Stacey (1996) show, however, that it is possible to derive an expression similar to (7) for the more general case of the scale factors varying by alternative. They do so by deriving a MNL-like model with alternative-specific scale factors as a special case of a Tree Extreme Value model (McFadden 1981, Daly 1987). For the purpose of this paper, however, we shall use the slightly less general model form (7), with person-specific scale factors.
expression is the same as would be obtained from a standard MNL model, if we set the scale factor to one. The second term in
the partial derivative arises because of the effect of the variable in question on the scale of the utility function. Since it is
possible to define utilities in such a way that they are always positive, the sign and magnitude of ∂Pin/∂Xk of model (7) vis-à-vis
that of the MNL model is greatly determined by the sign of ∂µn/∂Xk. Since this latter partial derivative can be positive or
term, specifically by making its variance (or equally well, its scale
µ
n(
C
n)
) a function of entropy. Weshall particularly assume that the scale factor is a quadratic function of the entropy of the decision
situation:
The quadratic form in (8) allows the scale (variance) to capture consumer reactions such as hypothesized
by Keller and Staelin [1987]: consumers may apply more effort to making decisions (thus leading to a
greater degree of preference consistency across individuals) up to a certain point of complexity, after which
level they resort to a plethora of simplifying decision heuristics that generate greater preference
inconsistencies across decision makers. If this supposition is indeed the case empirically, we would expect
that
θ
1≤
0
andθ
2≥
0
in (8) (in the case of variance, these coefficients signs would be reversed).An interesting point about specification (7-10) is that entropy
H
n, our measure of complexity, isendogenously determined via expressions (9-10). This parametrization of complexity assumes that decision
makers know their true tastes, and hence our entropy proxy directly uses the parameters of the utility
function to define complexity. In contrast, model (7) is the analyst’s view of the choice process, which
recognizes that true parameter taste “signal” is intermixed with “noise” generated by choice complexity;
this noise is filtered through the impact of complexity on the variance of the stochastic utility component,
3.3 Hypotheses Regarding Complexity and Variance
The theoretical model and the empirical formulation provide us with sufficient detail to set out
hypotheses regarding the relationship between complexity and variance. Since complexity is hypothesized
to demand additional outlays of effort on the part of consumers to find the utility maximizing choice, we
expect that variance will be increasing in complexity (or scale will be decreasing in complexity). For choice
sets with dominant alternatives, we expect that variance will be low. If tradeoffs must be made, or if the
number of attributes or alternatives increases, we expect variance to increase. As alternatives become more
similar, however, there comes a point where the true utilities and the respondent’s perceptions of utilities
arising from these alternatives are nearly identical as well. In these seemingly very complex cases, the
increased variance arising from increased complexity will be offset by the fact that the utilities are all
actually similar, thereby lowering the utility error variance. Thus, we expect that at some point increases in
our measure of complexity will result in lower error variances.
In summary, then, we expect that the variance of preference will be concave in complexity. At low
levels of complexity, easy decisions lead to more preference consistency (i.e. lower variance) across
respondents; at moderate levels of complexity, preferences will be characterized by higher variances than at
either extreme because of different levels of effort expended by decision makers; finally, at high levels of
complexity, preference consistency will result from the actual similarity of alternatives, independent of
effort. This leads to the hypothesized concave relationship between complexity and preference variance.
4. EMPIRICAL CASE STUDIES
In this section we shall examine the results arising from estimating specification (7-10) in ten
different data sets. Four of these are Revealed Preference (RP) choice studies, while the remainder are
Stated Preference (SP) choice elicitation experiments. These were selected for study due to their availability
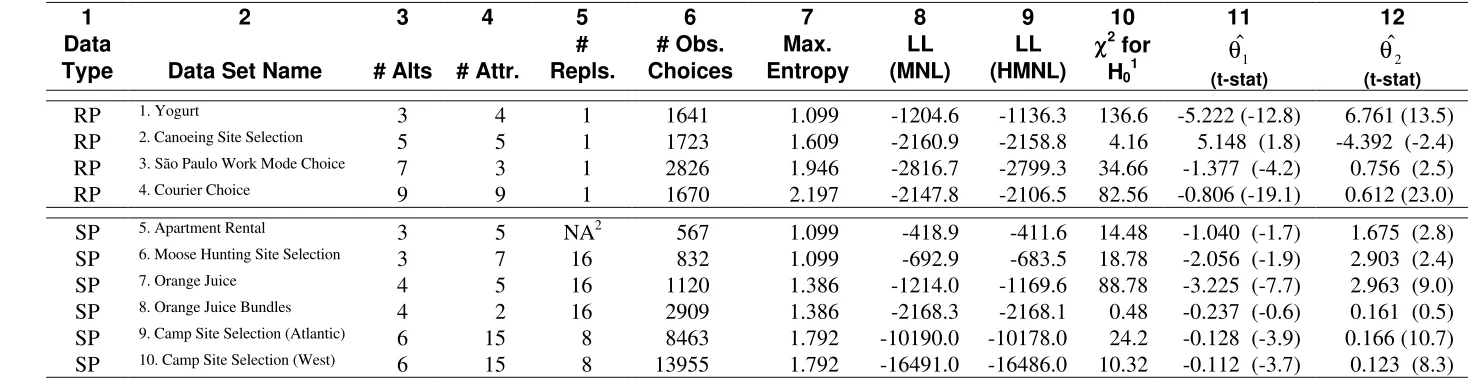
to the authors, but were also chosen to include decisions involving both private and public goods. Table 1
contains a number of descriptive characteristics for these ten data sets.
In the RP studies, with the exception of Study 1, the data contain one observed choice per
respondent. Study 1 is from scanner panel data, which contains a variable number of choices for each
household in the sample. The RP studies differ among themselves by the type of good, the number of
alternatives in choice sets and the number of attributes. Also, financial incentives were given to respondents
in Study 4, but not in Studies 1, 2 and 3.
The SP studies, as is common in these applications, contain some number of replications per
respondent greater than one. To interpret the results to be presented later on, it is useful to understand how
the SP choice data were collected. These studies have a number of features in common.
1. The choice task was presented in the form of a paper and pencil exercise, with the choice alternatives
presented as columns in a table, the first column of which named the attributes. The values of the
attributes were provided in the cells of the table itself. The full task faced by a respondent had from 8
to 16 choice sets, depending upon the study; these were arrayed sequentially for the respondent,
generally one to a page.
2. Within each study, all choice tasks had fixed choice set size.
3. A glossary of attributes and their levels, as well as instructions on how to perform the task (including a
sample choice situation), preceded each choice task.
Essentially, the task display and choice collection format were the same in all the studies. All the SP studies
were conducted in North America. In almost all studies respondents were either pre-recruited or recruited
by random digit dial. With the exception of the moose hunting site selection (Study 6), respondents received
Table 1 – Characteristics and Estimation Results of RP and SP Case Studies
RP 1. Yogurt 3 4 1 1641 1.099 -1204.6 -1136.3 136.6 -5.222 (-12.8) 6.761 (13.5)
RP 2. Canoeing Site Selection 5 5 1 1723 1.609 -2160.9 -2158.8 4.16 5.148 (1.8) -4.392 (-2.4)
RP 3. São Paulo Work Mode Choice 7 3 1 2826 1.946 -2816.7 -2799.3 34.66 -1.377 (-4.2) 0.756 (2.5)
RP 4. Courier Choice 9 9 1 1670 2.197 -2147.8 -2106.5 82.56 -0.806 (-19.1) 0.612 (23.0)
SP 5. Apartment Rental 3 5 NA2
567 1.099 -418.9 -411.6 14.48 -1.040 (-1.7) 1.675 (2.8)
SP 6. Moose Hunting Site Selection 3 7 16 832 1.099 -692.9 -683.5 18.78 -2.056 (-1.9) 2.903 (2.4)
SP 7. Orange Juice 4 5 16 1120 1.386 -1214.0 -1169.6 88.78 -3.225 (-7.7) 2.963 (9.0)
SP 8. Orange Juice Bundles 4 2 16 2909 1.386 -2168.3 -2168.1 0.48 -0.237 (-0.6) 0.161 (0.5)
SP 9. Camp Site Selection (Atlantic) 6 15 8 8463 1.792 -10190.0 -10178.0 24.2 -0.128 (-3.9) 0.166 (10.7)
SP 10. Camp Site Selection (West) 6 15 8 13955 1.792 -16491.0 -16486.0 10.32 -0.112 (-3.7) 0.123 (8.3)
Notes:
1. Hypothesis of interest is
H
0:
θ
1= θ
2=
0
. Critical chi-squared value at 95% confidence level is 5.991.The SP studies do differ in a number of ways (again, see Table 1): they involve different products
or services, individual choice sets have 3 to 6 alternatives, product/service descriptions involve different
number of attributes, and respondents were exposed to 8 or 16 replications. In addition, in Studies 6, 7 and
8 respondents receive incentives (not necessarily financial), whereas in the other studies they did not.
Sample sizes across the ten data sets varied from 567 to 13,955 choices. Finally, the seventh
column of Table 1 indicates the maximum entropy level that each data set can achieve; this level is based
on the number of alternatives J (given in column 3) in the choice problem, and is equal to lnJ.
4.2 Estimation Results
Table 1 also presents summary statistics and certain parameters estimates that we will now
discuss. (Additional model parameters are available from the authors upon request.)
Columns 8 and 9 contain the log likelihood values for the (homoscedastic) MNL and
Heteroscedastic MNL (expressions 7-10) models. The former imposes the restriction that scale is not a
function of complexity/effort (via the entropy proxy), whereas the latter allows the scale to vary according
to the complexity of the decision context. The tenth column of Table 1 contains the chi-squared statistic for
the hypothesis that both the linear and quadratic terms in the scale function (expression 8) are
simultaneously zero, implying that preferences are homoscedastic. The critical value is 5.991 at the 95%
confidence level. Hence, the null hypothesis that scale is not a function of complexity is rejected in all but
two of the data sets, Studies 2 and 8; the first of these is an RP and the other an SP data set.
We believe that in the case of Study 2 this inability to reject the null is due to the fact that the
entropy range represented in the data is relatively restricted compared to the theoretically possible range.
Specifically, column 7 of Table 1 indicates that the maximum entropy for Study 2 is 1.609; the minimum,
of course, is zero. For the Heteroscedastic MNL model presented in Table 1 for this study, the estimated
entropy range of the choice sets is 1.037 to 1.318. Hence, it may be that the lack of variability in entropy
theoretical range of entropy of [0,1.386], while the empirically estimated range is [0.137,1.359].
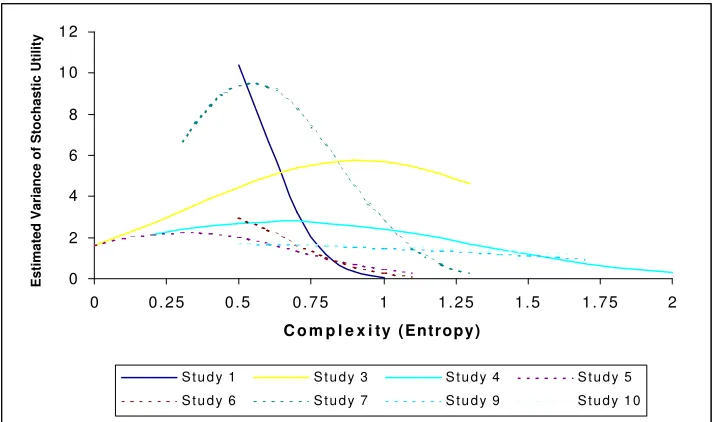
Figure 3 shows the estimated variance of the stochastic utility term as a function of choice set
complexity for the eight studies that had statistically discernible effects. For each study, variance is shown
for the range of entropy covered in that study. RP studies are shown as solid lines, whereas SP studies are
shown as dashed curves. Studies 1 (an RP data set) and 6, 9 and 10 (all SP data sets), display constantly
decreasing patterns of variance with increasing complexity; this may indicate support for an interpretation
in harmony with Keller and Staelin [1987], wherein greater preference consistency across respondents
results from an increase in effort from all respondents as decision contexts become more complex.
Alternatively, this relationship may arise because the utilities are becoming increasingly similar for all
alternatives as entropy increases, and thus the variance of errors of utilities is also decreasing.
Figure 3 – Estimated Impact of Decision Complexity on Variance
0 2 4 6 8 1 0 1 2
0 0 . 2 5 0 . 5 0 . 7 5 1 1 . 2 5 1 . 5 1 . 7 5 2
C o m p l e x i ty (Entropy)
Estimated Variance of Stochastic Utility
On the other hand, Studies 3 and 4 (both RP), as well as 5 and 7 (both SP), are characterized by
concave relationships between complexity and variance; at certain study-specific intermediate levels of
complexity, variance is at a maximum (indicating higher inability to choose the best alternative among
respondents), whereas at smaller and larger levels of complexity variance is smaller.
5. DISCUSSION OF RESULTS
Our study of four RP data sets and six SP choice experiments has lent strong support to the idea
that the decision environment and choice task characteristics can influence the quality of the statistical
information obtained from the data. In the cases in which the effect of choice complexity was less
statistically important or not distinguishable, it may well be due to limitations in the design matrix
(specifically, a limited entropy range due to the experimental design in SP cases, or due to limited attribute
variability in RP cases) rather than an absence of impact. By implication, not recognizing this impact will
affect the analyst’s ability to infer tastes, hence lead to incorrect inferences concerning elasticities, welfare
impacts of changes, etc.
As we hypothesized, the relationship between the variance of latent utilities and choice complexity
has been found to be concave in four of the eight cases examined that have statistically important
complexity impacts. In the other four cases with significant complexity effects, the relationship is strictly
decreasing; this may have occurred because of limited complexity ranges in those studies, covering only
moderate and high complexity decisions but not low complexity scenarios. Additionally, in two data sets,
one RP and the other SP, no statistically significant complexity effect was found. Taken together, these
results argue for the existence of threshold levels of complexity above which less “noisy” preference
information is to be found by the analyst. However, we believe that the design matrix should not be limited
to very complex choice contexts for the simple reason that lack of variation may lead to taste parameter
identification problems. For example, referring to Study 7 in Figure 3, we would suggest that rather than
variance and taste effects.
Though we originally developed our conceptual framework and approach based on our interest in
choice experiments and the application of SP models to real markets, we have also seen from the empirical
results that the analysis of RP choice data can benefit from modeling the impact of choice environment. In
three of four cases presented, the effect of complexity on the RP model was quite significant. In the case of
RP data, making stochastic utility variance a function of complexity is a way to rank choice sets in terms of
their contribution to establishing taste parameters estimates. Of course, differently from SP choice
elicitation exercises, the analyst has much less flexibility with the structure of the design matrix of RP data;
it is what it is! This may serve as an encouragement to the use of data fusion techniques (see, e.g.,
Ben-Akiva and Morikawa [1991], Adamowicz, Louviere and Williams [1994], Adamowicz et al. [1996],
Hensher, Louviere and Swait [1999]), whereby RP and SP data can be jointly used to infer taste
preferences, after controlling for data source specific complexity levels on variance.
6. SUMMARY AND FUTURE RESEARCH
Some economists (e.g. Heiner [1983], de Palma et al. [1994]), but generally psychologists and
consumer behavior researchers (e.g. Bettman et al. [1993], Keller and Staelin [1987], Tversky and Shafir
[1992], Dhar [1997a,b]), have put forward the idea that consumer choice behavior can be affected by
context and decision environment complexity. We have developed a specific model form that enables us to
test this idea empirically. Our examination of several SP choice experiments and RP data sets lends strong
support that what we term “choice complexity” is an important factor to consider when modeling choice
behavior, both at the task design stage and during econometric model estimation. By implication, we
surmise that complexity can also impact the pooling of multiple choice data sources, but that issue is left
for future research.
Individuals display a wide distribution of information processing capability. For example, level of
expertise should lead to different signal to noise ratios between individual respondents. Certain
avenue for research would be testing for the effect of different indicators of processing capabilities when
collecting and modeling choice data. Indicators of product class, or the proportion of income that the
product class represents for the individual, may also provide insight into the apparent ability to choose of
respondents, and the response to complexity.
An important caveat applies to our work, as well as that of almost all empirical choice modeling
work in the literature: we continue to employ a compensatory model as our base. Research in psychology
and consumer behavior has long suggested that individuals may adopt a number of different decision
strategies as a function of choice complexity. Thus, a necessary avenue for future research is to investigate
choice models that recognize this heterogeneity in decision strategies as a means to utilize alternative model
forms as a function of the choice context.
Another type of consumer heterogeneity that bears on the interpretation of our results is that of
taste. In our model development (see expression 7) and empirical work we have assumed that tastes are
constant across the population of interest. Since there is a multiplicative relationship between scale and
taste in model (7), one could speculate that some of the effect being attributed to scale might actually be
due to taste heterogeneity. (This relationship is not limited to MNL-like models, but also holds for
Multinomial Probit and Nested MNL models.) However, it may equally be the case that econometric
models of taste heterogeneity may actually be partly explaining variation due to context or complexity
level. This possibility was raised by Swait and Bernardino [1999], who show that across three market
segments responding to similar SP tasks, accounting for scale differences across taste groups permits
partial taste homogeneity to be discerned in the data, whereas ignoring the scale differences falsely leads to
the conclusion of complete taste heterogeneity across the segments. Future work should seek to separate the
components of taste heterogeneity (true taste variation and scale differences), and determine the degree to
which true taste variation (as opposed to scale differences) arises from task complexity differences over
individual choice sets that an individual respondent will encounter are generally selected so as to meet
certain desirable statistical properties (e.g. attribute orthogonality) that are deemed especially useful
during the model estimation stage. This results is some number of choice sets that must be shown to
respondents. Then, generally on the basis of experience (or at best, on the basis of limited pre-testing),
some number of replications per respondent is decided upon. Clearly, the experimental designs are defined
completely independently of respondents’ cognitive abilities and their willingness to expend some “cognitive
budget” during the task. This paper has shown that it is possible to account a posteriori for the effect of
task complexity. However, using the concepts developed in this paper, would it not seem eminently
plausible to develop a SP choice task design principle that sought to maximize the signal-to-noise ratio
(i.e. information content) of the data to be collected, subject to constraints related to respondents’ cognitive
abilities and “cognitive budgets”? This new design principle would not simply be applied to design the
choice sets, as with current design technologies, but also to determine choice set sequencing and task length
REFERENCES
Adamowicz, W.L., J. Louviere and M. Williams. 1994. Combining Stated and Revealed Preference Methods for Valuing Environmental Amenities. Journal of Environmental Economics and Management. 26:271-292.
Adamowicz, W.L., J. Swait, P. Boxall, J. Louviere, M. Williams. 1997. Perceptions versus Objective Measures of Environmental Quality in Combined Revealed and Stated Preference Models of Environmental Valuation. Journal of Environmental Economics and Management. 32:65-84.
Ben-Akiva, M and T. Morikawa. 1990. Estimation of Switching Models from Revealed Preferences and Stated Intentions. Transportation Research. 24A (6):485-495.
Ben-Akiva, M., M. Bradley, T. Morikawa, J. Benjamin, T. Novak, H. Oppewal and V. Rao. 1994. Combining Revealed and Stated Preferences Data. Marketing Letters. 5(4).
Ben-Akiva, M. and S. Lerman. 1985. Discrete Choice Analysis: Theory and Application to Travel Demand. MIT Press: Cambridge, MA.
Bettman, J.R., E.J. Johnson, M.F. Luce and J.W. Payne. 1993. Correlation, Choice and Conflict. Journal of Experimental Psychology: Learning, Memory and Cognition. 19:931-951.
Daly, A 1987. Estimating ‘Tree’ Logit Models. Transportation Research B, 21B(4):251-267.
Dawes, R 1979. The Robust Beauty of Improper Linear Models in Decision Making. American Psychologist. 34(7):571-582.
Dawes, R and Corrigan, B. 1974. Linear Models in Decision Making. Psychological Bulletin. 81:95-106.
De Palma, A. G.M. Myers and Y.Y. Papageorgiou. 1994. Rational Choice Under an Imperfect Ability to Choose. American Economic Review. 84:419-440.
Dhar, R. 1997a. Consumer Preference for a No-Choice Option. Journal of Consumer Research. 24:2215-231.
Dhar, R. 1997b. Context and Task Effects on Choice Deferral. Marketing Letters. 8:119-130.
Hanemann, W.M. 1982. Applied Welfare Analysis with Qualitative Response Models. Working Paper No. 241, Giannini Foundation of Agricultural Economics, University of California, Berkeley. 26pp.
Heiner, R.A. 1983. The Origin of Predictable Behavior. American Economic Review. 73:560-595.
Hensher, D.A. 1994. Stated Preference Analysis of Travel Choices: The State of the Practice. Transportation 21:107-133.
Hensher, D.A., Louviere, J.J. and Swait, J. 1999 Combining Sources of Preference Data. Journal of Econometrics, 89(1-2):197-221.
Environmental, Health and Employment Effects of Energy Programs. Journal of Environmental Economics and Management. 34:79-99.
Keane, M.P. 1997. Current Issues in Discrete Choice Modeling. Marketing Letters. 8:307-322.
Keller, K.L., and R. Staelin. 1987. Effects of Quality and Quantity of Information on Decision and Effectiveness. Journal of Consumer Research. 14:200-213.
Layton, D. and G. Brown. 1998. Heterogeneous Preferences Regarding Global Climate Change. Unpublished paper, University of Washington.
Louviere, J.J. 1987. Analyzing Decision Making - Metric Conjoint Analysis, Sage University Paper #67, Sage Publications: Newbury Park, CA.
March, J.G. 1978. Bounded Rationality, Ambiguity and the Engineering of Choice. Bell Journal of Economics. 9:587-608.
Mazzotta, M. and J. Opaluch 1995. Decision Making When Choices Are Complex: A Test of Heiner’s Hypothesis. Land Economics. 71(4):500-515.
McFadden, D. 1981. Econometric Models of Probabilistic Choice, in Structural Analysis of Discrete Data With Econometric Applications, D. McFadden and C. Manski, Editors. MIT Press, Cambridge, MA, 198-272.
Olshavsky, R.W. 1979. Task Complexity and Contingent Processing in Decision Making: A Replication and Extension. Organizational Behavior and Human Performance. 24:300-316.
Payne, J.W. 1976. Task Complexity and Contingent Processing in Decision Making: An Information Search and Protocol Analysis. Organizational Behavior and Human Performance. 16:366-387.
Payne, J.W., J.R. Bettman and E.J. Johnson. 1993. The Adaptive Decision Maker. Cambridge University Press, New York.
Payne, J.W., J.R. Bettman and E.J. Johnson. 1988. Adaptive Strategy and Selection in Decision Making. Journal of Experimental Psychology: Learning, Memory and Cognition. 14:534-552.
Sengupta, J.K. 1993. Econometrics of Information and Efficiency. Kluwer Academic Publishers, Dordrecht.
Shannon, C.E. 1948. A Mathematical Theory of Communication. Bell System Technical Journal. 27:379-423.
Shugan, S.M. 1980. The Cost of Thinking. Journal of Consumer Research. 7:99-111.
Simon, H.A. 1955. Behavioral Model of Rational Choice. Quarterly Journal of Economics. 69:99-118.
Soofi, E.S. 1994. Capturing the Intangible Concept of Information. Journal of the American Statistical Association. 89:1243-1254.
Swait, J. and M. Ben-Akiva. 1987a. Incorporating Random Constraints in Discrete Models of Choice Set Generation, Transportation Research B. 21(2):91-102.
Swait, J. and M. Ben-Akiva. 1987b. Empirical test of a constrained choice discrete model: mode choice in São Paulo, Brazil, Transportation Research B. 21(2):103-115.
Swait, J. and A. Bernardino. 1999. Distinguishing Taste Variation From Error Structure in Discrete Choice Data. Forthcoming, Transportation Research B.
Swait, J. and J. Louviere 1993. The Role of the Scale Parameter in The Estimation and Use of Multinomial Logit Models, Journal of Marketing Research, 30:305-314.
Swait, J. and E.C. Stacey. 1996. Consumer Brand Assessment and Assessment Confidence in Models of Longitudinal Choice Behavior. Presented at the 1996 INFORMS Marketing Science Conference, March 7-10, 1996, Gainesville, FL.
Swait, J., J. Louviere and M. Williams. 1994. A Sequential Approach to Exploiting the Combined Strengths of SP and RP Data: Application to Freight Shipper Choice. Transportation. 21:135-152.
Tversky, A. and E. Shafir. 1992. Choice Under Conflict: The Dynamics of Deferred Decision. Psychological Science. 3:358:361.