Full Terms & Conditions of access and use can be found at
http://www.tandfonline.com/action/journalInformation?journalCode=cbie20
ISSN: 0007-4918 (Print) 1472-7234 (Online) Journal homepage: http://www.tandfonline.com/loi/cbie20
Dawn of Industrialisation? The Indonesian
Automotive Industry
Kaoru Natsuda, Kozo Otsuka & John Thoburn
To cite this article: Kaoru Natsuda, Kozo Otsuka & John Thoburn (2015) Dawn of
Industrialisation? The Indonesian Automotive Industry, Bulletin of Indonesian Economic Studies, 51:1, 47-68, DOI: 10.1080/00074918.2015.1016567
To link to this article: http://dx.doi.org/10.1080/00074918.2015.1016567
Published online: 30 Mar 2015.
Submit your article to this journal
Article views: 284
View related articles
View Crossmark data
ISSN 0007-4918 print/ISSN 1472-7234 online/15/00047-22 © 2015 Indonesia Project ANU http://dx.doi.org/10.1080/00074918.2015.1016567
DAWN OF INDUSTRIALISATION?
THE INDONESIAN AUTOMOTIVE INDUSTRY
Kaoru Natsuda* Kozo Otsuka*
Ritsumeikan Asia Paciic University Ritsumeikan Asia Paciic University
John Thoburn*
University of East Anglia; Ritsumeikan Asia Paciic University
This article traces the development of industrial policy towards the Indonesian mo-tor industry within the automotive global value chain. Showing the current domi-nance of Japanese motor assemblers in Indonesia, it notes the rather undeveloped nature of the locally owned supporting industry, particularly compared with that of neighbouring Thailand. Most investment in auto-parts production has been by foreigners. Nevertheless, Indonesia’s rapid domestic-market growth has allowed it to attract foreign automotive investment without having to offer excessively gener-ous incentives. While the continued entry of foreign suppliers of auto parts into Indonesia offers opportunities for local suppliers to upgrade their productive ca-pabilities, it also limits their chances of becoming irst-tier suppliers themselves. Japanese automotive investors are optimistic about Indonesia’s export potential, more so than Malaysia’s.
Keywords: automotive, motor industry, global value chains, industrialisation JEL classiication: F5, F13, L62, O25
INTRODUCTION
In 2012, having started vehicle assembly as long ago as the 1920s, Indonesia
pro-duced more than 1 million vehicles for the irst time. In doing so, it became the 17th-largest vehicle producer in the world.1 In the last 90 years the global environ-ment of the automotive industry has changed greatly: there has been a massive
process of consolidation towards a small number of major multi nationals, such as Toyota and General Motors (GM), driven in large measure by the need to invest
heavily in research and development in order to stay competitive and produce
new models. While the minimum eficient size of an individual auto motive plant
* We are grateful to two anonymous referees for their comments. We also thank Ritsumeikan Asia Paciic University and the Japan Society for the Promotion of Science (KAKENHI 22730153) for research inance. Of course, the usual disclaimers apply.
may have fallen to around 150,000 units per year,2 the minimum size of irm has greatly increased. An output of as many as 5 million vehicles per year may be necessary for a mass-market automotive assembler to stay globally competitive;
even luxury car makers Mercedes-Benz and BMW each make well over 1 million vehicles annually (Nolan 2012, 25). Increasingly, national markets, particularly in developing countries, are dominated by foreign-owned assemblers. The growth in demand for vehicles and their locations of production have been shifting away from Europe and North America towards Latin America and particularly Asia.
Important, too, are global moves towards trade liberalisation, both interna -tionally and regionally—in Indonesia’s case, under the ASEAN Free Trade Area.
These moves work against the protection of national motor industries from
imports, and help assemblers and their global mega-suppliers to integrate their production across borders. In addition, starting mainly in the 2000s, the kinds of policies that are internationally acceptable have changed. Restrictions imposed by the WTO on trade-related industrial policies have restricted the ‘policy space’ available for promoting the development of automotive industrialisation, espe-cially of the import-substituting kind that characterised the attempts of most developing countries—including Indonesia—to establish their industry
(Gal-lagher 2005; Wade 2003; Natsuda and Thoburn 2014). In this context, Indonesia has some interesting features in contrast to its ASEAN neighbours. Like Malaysia, Indonesia tried to develop a national car, but, unlike Malaysia, it was unable to
keep it in production.3 While Malaysia sailed close to the wind of louting WTO
rules, and got away with it, Indonesia’s attempts to establish a national car were
so blatantly anti-competitive that it suffered effective protests under WTO dis-putes procedures from the home countries of rival vehicle producers (Hale 2001,
634). Similarly, Thailand has continued to promote increased local content (LC), though LC requirements are banned under the WTO’s rules on trade-related investment measures. It has done so by using iscal measures that have been suf
-iciently WTO-compliant to avoid protests (Natsuda and Thoburn 2013, 2014). In contrast, Indonesia’s LC requirements were strongly attacked under the condi
-tionality imposed on loans from the IMF after the 1997–98 Asian inancial crisis (Hale 2001, 634).
Indonesia is at an interesting stage of development. As Basri (2012, 30–33) notes, the country is enjoying a ‘demographic dividend’, with its young middle class generating a growing demand for consumer goods like cars—an optimistic view that our interviewees in the Indonesian motor industry appear to share.4
2. See Auty’s (1994, 610–14) study for a discussion of the minimum eficient size of an automotive plant. The minimum eficient size for producing some key components, such as engines, transmissions, and axles, is several times larger than that for producing vehi-cles. Note, though, that for a plant simply assembling completely knocked-down kits, the minimum eficient size could be as low as 40,000 vehicles per year, or 30,000 per year for light commercial vehicles of the sort that has been popular in Indonesia. See Karmokolias’s (1990) study for a still very useful discussion.
3. This is not the place to discuss the many problems that Malaysia has had with Proton, its main national car manufacturer, but a determined government has been able to at least stop the irm going out of business. See the studies of Natsuda, Segawa, and Thoburn (2013) and Segawa, Natsuda, and Thoburn (2014).
Industrialisation thus looks more promising than in the past.5 In this context,
then, and during a period of rapid economic growth, how has Indonesia been able to promote its motor industry since the 2000s? What policy space has it been able to carve out to do so? How is Indonesia now regarded in relation to neighbouring countries by the Japanese multinational assemblers that now dominate vehicle production in the country? We try to answer these questions here on the basis of information from a set of qualitative interviews with automotive irms, trade
associations, ministries, and key informants in Indonesia in early 2013, and from a
range of secondary sources and survey data in English and in Japanese. This arti
-cle builds on earlier work by our team on the automotive industries of Thailand (Natsuda and Thoburn 2013) and Malaysia (Natsuda, Segawa, and Thoburn 2013; Segawa, Natsuda, and Thoburn 2014; Otsuka and Natsuda, forthcoming), as well as a Thai–Malaysia comparison (Natsuda and Thoburn 2014).
THE AUTOMOTIVE GLOBAL VALUE CHAIN
The concept of a global value chain (GVC), though now well known and widely
employed,6 is still useful as a setting within which to understand Indonesia’s auto
-motive industrialisation, although we do not try to force all our discussion into a GVC framework. In principle, GVC analysis traces economic activities through various stages of production, from raw-material production to inal retail sales.7
Such activities include design, production, marketing, and distribution, as well
as the logistics of bringing out the product or service from the producer to the
inal consumer. A particular focus of much GVC analysis is whether domestic irms within a chain can upgrade their products, processes, or functions in order to achieve higher productivity and (sometimes) a larger share of value added (Humphrey and Schmitz 2002).8 Beyond the GVC literature’s usual emphasis on
the upgrading of irms’ activities, there is also an issue of upgrading the whole industrial structure (Lauridsen 2009)—in this case the whole network of local pro -duction.
A weakness of the GVC approach is its stress on vertical relations between economic actors to the partial exclusion of horizontal network relations between irms and other actors. The seminal work of Henderson et al. (2002) introduced the concept of global production networks (GPNs) and we draw on this, too, where appropriate. More recent work on production networks (for example, Athukorala
5. Hill (2000, 155) notes that in 1966, at the start of Soeharto’s New Order and after the depredations of the Sukarno years, Indonesia was one of the least industrialised among the world’s large developing countries. Later industrialisation attempts, in the 1980s, included leap-frogging into high-technology sectors like aircraft. The 1980s, and the early 1990s, also saw a more successful development of light-manufacturing exports (Thoburn 2001), but this development has slowed as wages have risen (Basri 2012, 41).
6. For brief surveys of the GVC literature, see the studies of Natsuda and Thoburn (2013) and Natsuda, Segawa, and Thoburn (2013). UNCTAD (2013, especially chapter 4) and Ge-refi (2014) have captured some of the latest thinking in GVC analysis.
7. In this article, however, we shall not go back as far as the raw-materials stage.
2011, and surveyed in Kimura and Obashi 2011) has produced useful empirical
analysis, particularly for Southeast Asia and East Asia.
The formation of GVCs (and GPNs) has been facilitated by the growing abil
-ity of producers to inely slice (vertically disintegrate) production into different stages, which can then be carried out in different locations. As a result—and this is the subject of new work on GVCs—should a country export a good within a GVC,
the good’s production may be highly import-intensive and so the gross export value may overstate the country’s value-added contribution. Of some 42
indus-tries identiied as being heavily involved in GVC activity, the automotive industry was second only to electronics in having the highest share of non-domestic value added in total exports—around 35%, compared with electronics’ 45% (UNCTAD 2013, 129).9 This high trade intensity of production implies that there is a lot of
choice as to what is produced locally, and also indicates considerable scope for
global and regional specialisation in the production of the thousands of
compo-nents needed for a vehicle. Note, though, that some recent work has shown that automotive production is much less network-trade intensive in the Asian con
-text than electronics production. Athukorala (2011, 76–77) attributes this in part to the lower trade intensity within automotive production networks and to the low value-to-weight ratio of auto components, and notes that localisation policies to
increase domestic value added in automotive production are trade-reducing.
The automotive industry is normally seen as a producer-driven GVC, in which major international vehicle assemblers exercise control (governance) over other stages of production, including the location of the industry as well as procure -ment and retail distribution. This type of chain is found in technology- and
capital-intensive industries, and contrasts with buyer-driven chains in such labour-intensive industries as garments or footwear (where control is located at the retail end). Relations between assemblers and their networks of suppliers have been transformed in the world automotive industry—particularly since the 1980s, when Western producers moved away from their earlier, more vertically integrated, Fordist-style production, with market-based linkages with their pro
-duction networks (Humphrey 2003), towards the system that the Japanese had developed in the 1960s. The Japanese system features lexible, long-term buyer– supplier relationships within keiretsu (business groups). Within this system, Japanese automotive assemblers typically establish a vertically oriented, triple-layered subcontracting system beneath them. Assemblers directly source inished components from only their irst-tier suppliers, which then subcontract lower-valued manufacturing activities to lower-tier suppliers (Thoburn and Takashima 1992, chapter 5).10
Another major change in recent years has been the growth and increasing global reach of irst-tier automotive suppliers—often known as mega-suppliers— such as Denso in Japan, Bosch in Germany and Delphi in the United States. In par -allel to the relocations of automotive assembly to overseas locations, automotive
9. ‘Non-domestic’ here refers to value added originating overseas. Value added originating in foreign-owned irms operating in the domestic economy is treated as domestic.
assemblers, particularly the Japanese, have required their irst-tier suppliers to follow them. Assemblers and mega-suppliers need to have global reach and inno
-vation and design capabilities, as well as considerable inancial resources (Hum
-phrey and Memedovic 2003, 21–22). In this sense, the drivers of automotive GVCs have come to include mega-suppliers as well as assemblers, and the opportunities for domestic irms to enter and later to upgrade now depend heavily on irst-tier
suppliers. The emergence of mega-suppliers has also enabled auto motive
assem-blers to move towards a modular system, which requires that mega-suppliers
deliver complete modules rather than individual components. In this context, some higher-value-added activities are transferred from assemblers to
mega-suppliers (Doran 2004; Takeishi and Fujimoto 2001).
Given the dominant position of Japanese assemblers in the Indonesian automo
-tive industry, with a 90% share of production (igure 1), it is worth noting that the Japanese literature highlights whether it is the assembler or the parts supplier that designs the parts and that owns the blueprint (Asanuma 1997; Fujimoto 1997). According to Clark and Fujimoto (1991, 143–46), US assemblers have depended on a detailed-controlled system, where parts suppliers produce according to the designs supplied to them, while Japanese assemblers have relied on their suppli
-ers producing their own designs (following the assembl-ers’ basic speciications).
In this sense, parts suppliers have been more involved in research and
develop-ment in the Japanese system than in the US system (Clark and Fujimoto 1991, 136–37). Japanese assemblers thus appear to offer more scope for their suppliers
to upgrade their products and functions. Yet this is clouded by the fact that these
relations tend to be with irst-tier suppliers, which are very often also foreign-invested (and usually Japanese) irms.
In the past, many countries developed their local parts industry by introducing
speciic industrial policies such as LC requirements and mandatory deletion pro -grams.11 Yet it has long been recognised that the backward linkages such policies
develop may be ‘bad’ as well as ‘good’, in terms of whether these linkages even
-tually become internationally competitive (Thoburn 1973). In this sense, higher LC is not desirable for its own sake, and high-cost, locally made parts make an
assembly industry less competitive.
For industrial upgrading, institutions—including national and international
policies shaping globalisation—are a critical element. Gerefi (1994) views state policy as playing a major role in GVCs. State capacity in Indonesia has generally been viewed as low, aflicted by extensive cronyism and poor governance—often referred to by the initialism KKN (representing the Indonesian words for corrup
-tion, collusion, and nepotism); this is thought to have long weakened Indone -sia’s ability to implement effective economic policies for the automotive industry
(MacIntyre 1995; Hill 2000).
OVERVIEW OF THE INDONESIAN AUTOMOTIVE INDUSTRY Indonesia in the Global Automotive Economy
Global automotive production expanded from 58 million units in 2000 to 85
mil-lion units in 2012. During this period, signiicant global shifts occurred in the
automotive industry. Developed countries lost some of their global production
share, while emerging countries such as China, India, Brazil, and Thailand rap
-idly expanded theirs (OICA 2013). There were two types of global shifts towards developing countries: the irst was based on the advantage of lower produc
-tion costs and on geographical proximity to the core automotive na-tions, which include Mexico, in the case of the United States, or Central Europe, in the case of Western Europe; the second was based on potentially large domestic markets in rapidly growing emerging economies such as China, India, and Brazil (Pavlínek
and Ženka 2011), and now Indonesia.
In Southeast Asia, Thailand, Indonesia, and Malaysia expanded their global share and the volume of production between 2000 and 2012. Thailand, in par
-ticular, grew rapidly to nearly 2.5 million units (3% of world production), joining the top ten producing countries in the world. In Indonesia, vehicle production increased by 3.6 times (the ifth-highest growth rate among the major countries), much faster than in Malaysia, which had a similar production volume in 2000. During this period, Thailand also emerged as an export platform for Japanese automotive producers, exporting about 50% of its total production in 2010 (Nat
-suda and Thoburn 2013). In contrast, Indonesia, even in 2012, exported only about 15% of its output (Gaikindo 2010).
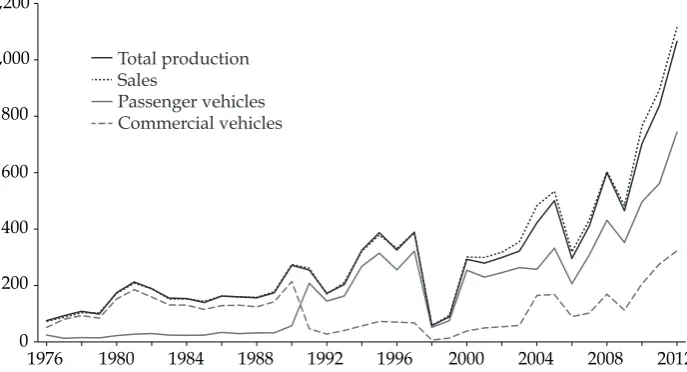
Figure 2 indicates the total number of vehicles produced and sold in Indone-sia during 1976–2012. Production expanded to more than 325,000 units in 1994,
and reached its irst peak of 389,279 units in 1997. However, the 1997–98 Asian
FIGURE 1 Production and Market Share of Automotive Producers in Indonesia, 2010 (%)
Nissan Honda Suzuki Others Mitsubishi Daihatsu Toyota
40 35 30 25 20 15 10 5 0 5 10 15 20 25 30 35 40
Production Market share
inancial crisis caused a serious market slump, and subsequently production
dropped to only 58,000 units in 1998. Although Indonesia’s vehicle production
expanded steadily in the irst half of the 2000s, reaching more than 500,000 units in 2005, vehicle demand decreased by 40% in 2006, owing to increases in fuel prices (which doubled) and interest rates (Fourin 2008, 208). After this event, mar
-ket demand expanded rapidly (except for in 2009, because of the Lehman shock).
The excess of domestic sales over domestic production indicates that Indonesia is a net importer of vehicles.12
Structure of the Indonesian Automotive Industry
Among the three major automotive-producing nations in Southeast Asia,
Indo-nesia has more assembly plants, parts suppliers, and employment than Malaysia,
12. For example, in 2010, the most recent year for which the UN Comtrade trade database gives quantities for Indonesia for vehicles imported and exported, exports of HS 8703 (‘mo-tor vehicles for transport of persons, except buses’) were 76,340 units and imports were 92,538 units, giving net imports of 16,198 (see http://comtrade.un.org/db). This igure is considerably lower than the net import igure (sales minus total production) for 2010, on which the irst igure is based (62,202 units). The other major automotive import category, HS 8704 (‘motor vehicles for the transport of goods’) probably accounts for the bulk of this discrepancy, but unfortunately Comtrade does not give physical quantities for HS 8704. However, in value terms, imports of HS 8704 were only marginally smaller than those for 8703 (both around $1.4 billion in 2010), whereas exports of HS 8704 were negligible. Remaining differences probably relect the usual dificulties of marrying trade and produc-tion data categories, and also stock changes, and time lags between foreign trade move-ments and domestic sales and production.
FIGURE 2 Number of Vehicles Produced and Sold in Indonesia, 1976–2012 (’000)
1976 1980 1984 1988 1992 1996 2000 2004 2008 2012 0
200 400 600 800 1,000 1,200
Total production Sales
Passenger vehicles Commercial vehicles
Sources: Data from Fourin (1994, 1999, 2011) and unpublished data provided by Gaikindo in 2013.
Note: The government changed its categories of passenger vehicles in 2004; data for 1991–2010 are
although much fewer than Thailand (table 1). According to the Association of Indonesian Automotive Industries (Gaikindo), the 20 assembly plants had approximately 250 irst-tier parts suppliers and 600 second- and third-tier sup -pliers in 2012. Gaikindo estimated that in that year the Indonesian automotive industry generated a total of 715,000 jobs—including 115,000 in the automobile
industry, of which 27,000 were assemblers and 88,000 were auto-parts producers. The additional 600,000 consists of 240,000 workers in authorised outlets, includ
-ing sales, service, and workshops, and 360,000 in non-authorised outlets. In com -parison, in 2010, Thailand generated approximately 50,000 jobs in the assembly industry and 350,000 in the parts industry.
A unique feature of the Indonesian automotive industry is the division of labour between multinational corporations and local irms. According to an Indonesian
government decree of 1969, assembly operations and distribution operations must be organised by different entities. In general, foreign automotive assemblers have been in charge of product development, production management, and
busi-ness administration, while local irms have been in charge of distribution and sales operations (Nomura 2003, 25). Large Indonesian business groups such as
Astra International and Indomobil have formed to control sales and distribution
operations alongside various foreign assembly irms. For example, for Toyota, PT Toyota Motor Manufacturing Indonesia was established in 1970 in order to
assemble vehicles.13 PT Toyota Astra Motor was established (with 51% of capital
from Astra International and 49% from Toyota) in 1971 in order to conduct distri -bution and sales operations in Indonesia. Astra International also conducts sales
and distribution operations for Daihatsu, Isuzu, Nissan Diesel, BMW, and Honda (two-wheel vehicles only), while Indomobil has operations with Suzuki, Mazda,
Nissan, Hino, and Volvo.
In Indonesia, multi-purpose vehicles (MPVs) accounted for two-thirds of domes
-tic market sales in 2012, followed by pick-up trucks (28%), while sedans accounted for merely 3%. Seven-seater MPVs are particularly popular, owing to the typically
13. With 95% of capital from Toyota and 5% from Astra International in 2013 (interview with Toyota Astra Motors, 25 Feb. 2013).
TABLE 1 Number of Assembly Plants, Parts Suppliers, and Employment in Indonesia, Thailand, and Malaysia
Assembly plantsa Parts suppliers
Employment in assembly & parts industries
Indonesia 20 850 115,000
Thailand 16 2,390 400,000
Malaysia 15 690 47,947
Sources: Data from Natsuda and Thoburn (2013); Natsuda, Segawa, and Thoburn (2013); and unpub
-lished data provided by Gaikindo in 2013.
large size of families in Indonesia and the height of the vehicle body (much higher
than sedans, which is very useful during the lood season). In contrast, Thailand has a large demand for pick-up trucks, and in Malaysia sedans predominate.
A handful of motor producers, mostly Japanese, dominate the market in Indo
-nesia. The top two vehicle producers account for the bulk of output, and the top six producers account for approximately 90% in both production and domestic sales (igure 1). Daihatsu is the leading producer, accounting for 40% of produc
-tion (281,096 units) in 2010.14 Toyota is the leading company by sales, followed
by Daihatsu, Mitsubishi, Suzuki, Honda, and Nissan. The Toyota group (Toyota, Daihatsu, and Hino) alone accounted for 58% of production and 55% of domestic
sales in 2010.
According to the Indonesian Automotive Parts and Components Industries Association, (GIAMM), in 2012 it had 161 member irms: 95 joint-venture irms and 66 local irms. Of the 95 joint-venture irms, 69 were Japanese. Indonesia’s auto-parts industry is under Japanese keiretsu control, which has the advantages of
long-term business relationships based on trust, guarantees of technical support,
and lexibility of production and quantity, although the pressure to reduce costs is high (interview with GIAMM representative, 20 Feb. 2013). However, our inter
-views with several automotive assemblers in Indonesia found that parts-sourcing practice in Indonesia differs somewhat from the traditional keiretsu system in
Japan, employing a more open system of procuring across keiretsu networks.
DEVELOPMENT OF THE INDONESIAN AUTOMOTIVE INDUSTRY
Background: Early Stages (1928–68)
Indonesia has the longest history of automotive production in Southeast Asia.
The irst automotive assembly plant was established by GM in 1928, with an ini
-tial production capacity of 6,000 units per year (Sato 1992). However, this was automotive assembly in a rather notional sense. Automobiles were imported in two-unit packs, mainly because this was cheaper than shipping completely built-up (CBU) vehicles. It was not until after the Second World War that completely knocked-down (CKD) kits were imported (Witoelar 1983, 18).
After independence in 1949, and the departure of GM from Indonesia in 1955, the GM plant was taken over by state-owned Gaya Motors, and purchased in 1967
by the private PT Astra International. Although automotive industrialisation had started early in Indonesia, the industry failed to develop throughout the 1960s,
producing only about 2,000 vehicles per year (Hansen 1971, 38).
Localisation through Import-Substituting Industrialisation (1969–92)
After Soeharto became president in 1967, his goverment shifted Indonesia’s devel-opment policy from Sukarno’s vision of Indonesian socialism to the liberalisation
of trade and investment, linking with foreign capital (Chalmers 1994). Soeharto’s administration depended heavily on ethnic Chinese business. For instance, the expansion of the automotive industry since the late 1960s was initially carried out
by the Astra Group of ethnic Chinese entrepreneur William Soeryadjaya, which entered into distribution and assembly arrangements with a number of Japanese companies, including Toyota, starting at the former GM assembly plant at Tan
-jung Priok. The Astra Group was joined by others—such as the Salim Group of Liem Sioe Liong, which purchased PT Indomobil in 1980 and expanded it from distribution into assembly operations. (Doner 1991, 128).
The Indonesian government imposed an array of localisation policies in the
automotive sector under import-substituting industrialisation. This was done in two stages. The irst stage aimed to shift from the importation of CBU vehicles to local assembly production, gradually banning the import of CBU vehicles in dif
-ferent regions of Indonesia, starting in 1969, until a nationwide ban was enforced in 1974 (Sato 1992, 340–41). The second stage, which began in 1976, aimed to achieve higher LC ratios in the assembly of vehicles by introducing a mandatory deletion program for commercial vehicles, replacing imported components with locally produced ones (Aswicahyono et al. 2000, 215).
The localisation policy for components production divided the automotive
industry in the 1980s. Local business groups linked to Japanese automotive pro -ducers came gradually to support the policy, because these groups had invested
heavily in components production to meet LC requirements. In contrast, local business groups linked to US and European producers had dificulty meeting these requirements (Chalmers 1994). Of the eight automotive producers that had established plant for engine production by 1990, seven were Japanese (Toyota, Mitsubishi, Daihatsu, Suzuki, Isuzu, Hino, and Honda), while only one irm, Mercedes-Benz, was European (Inoue 1990, 72–73).
New Protectionist Policy, the National Car, and the WTO Dispute (1993–98)
In 1993 the Indonesian government introduced a new policy-deregulation pack
-age for the automotive industry, ending the ban on importing CBU vehicles but
reducing tariffs and luxury tax on imported components on the basis of the type
of vehicle and the level of LC. This move allowed assemblers to access more
favourable tax rates according to their localisation efforts. The old system, of mandatory deletion programs, forced assemblers to localise their production,
whereas the new incentive system allowed assemblers to select which parts to localise (Aswicahyono, Basri, and Hill 2000).
While the measures outlined above contradicted the spirit rather than the letter of WTO rules, in 1996 the Indonesian government announced a very ambitious— and, in WTO terms, much more contentious—automotive development plan.
Pro-gram Mobil Nasional aimed to produce a national car (like Malaysia’s Proton), and would give the national producer a three-year exemption from import duties and luxury taxes if it was inanced exclusively by national capital, used an origi
-nal brand, and had an LC ratio of 60% within three years (Nomura 1996, 81). In 1996, Soeharto designated Timor Putra National, which was owned by his son Tommy, as the sole producer of the national car, the Timor (Hale 2001). Subse
The Indonesian government initially allowed Kia-Timor Motors to import Kia’s CBU vehicles under Timor’s brand name for one year, exporting Indonesian workers and Indonesian components to Kia in Korea (Fourin 1999, 94–95) and
giving the promised exemptions from import duties and luxury taxes (Hale 2001,
632). As a result of these exemptions, the price of the Timor S515 model (the same as Kia’s Sephia model, a four-door sedan) was almost half the price of Toyota’s similar model, the Corolla (Nomura 2003, 47). In response, the European Union, Japan, and the United States brought a case to the Dispute Settlement Panel of the WTO. In July 1998, the panel judged that the incentive system, introduced in 1993,
violated the WTO’s rules on trade-related investment measures. It also judged that Indonesia’s national car project contravened the WTO’s Agreement on
Subsi-dies and Countervailing Measures (Nomura 2003, 54–55). The panel ordered the Indonesian government to abolish the incentive system by July 1999. In turn, the
government asked Timor Putra National to repay the import tariff and luxury tax
exemptions of $326 million (Fourin 1999, 92), but the company did not have suf
-icient resources to do so, and declared bankruptcy in March 2001.
After Liberalisation, and the Low-Cost Green Car (1999–Present)
The 1997–98 Asian inancial crisis, which hit Indonesia very hard, resulted in
some reform of the automotive industry. The industry became a target of
struc-tural adjustment required by the IMF;15 as a result, liberalisation policies were introduced, including a reduction of import tariffs, the elimination of the incen-tive system, and an assurance of Indonesia’s commitment to the WTO’s rules
(Hale 2001, Nomura 2003). As a result, the 1999 Automotive Policy Package abol
-ished the incentive system and introduced a new set of import duties based on the type, engine size, and weight of vehicles (table 2). As the tariffs on CBU vehicles are consistently higher than on CKD vehicles, the effective rate of protection (that is, protection on value added) on assembly is greater than that suggested by the nominal tariffs on CBU vehicles.
Although vehicle production increased steadily after liberalisation, the Indo-nesian government could not implement strategic automotive development
poli-cies, owing to the political instability after the abdication of Soeharto in 1998. The irst policy in the post-liberalisation period concerned the low level of LC in the
industry.16 In order to achieve higher LC ratios, the Indonesian government intro
-duced an innovative incompletely knocked-down (IKD) system in 2006 (inter
-view in Jakarta with Gaikindo, 27 Feb. 2013, and the Ministry of Industry, 5 Mar. 2013). The government targeted subcomponents that were not produced locally in Indonesia as IKD parts, by providing lower tariff rates than for CKD parts.
The IKD system aims to encourage imports of subcomponents rather than CKD parts as a whole, thus encouraging the assembly of CKD parts locally (for exam -ple, importing engine parts and assembling engines locally, rather than importing
engines). Thus, by effectively setting tax-duty rates, the IKD system encourages
15. Basri (2012, 38) notes that the IMF package also captured most of the World Bank agen-da for trade deregulation.
TABLE 2 Import Duty and Luxury Tax Rates, 1999–2011 (%)
Import duty
Luxury tax
CBU CKD IKD
Category Remarks 1999 2006 2007 2010 2011 1999 2006 2008 2011 2007 2010 2011 1999 2004
Passenger vehicles
Sedan CC ≤ 1.5 (G/D) 65 60 55 50 40 35 25 15 10 15 10 7.5 30 30
1.5 < CC ≤3.0 (G)/2.5 (D) 70 60 55 50 40 45 30 15 10 0 0 0 40 40 CC > 3.0 (G)/2.5 (D) 80 60 55 50 40 50 40 15 10 0 0 0 50 75
4 × 2 CC ≤ 1.5 (G/D) 45 45 45 45 40 25 20 15 10 15 10 7.5 10 10
1.5 < CC ≤ 2.5 (G/D) 45 45 45 45 40 25 20 15 10 15 10 7.5 20 20
2.5 < CC ≤ 3.0 (G) 45 45 45 45 40 25 20 15 10 15 10 7.5 20 40
CC > 3.0 (G)/2.5 (D) 45 45 45 45 40 25 20 15 10 15 10 7.5 30 75
4 × 4 CC ≤ 1.5 (G/D) 45 45 45 45 40 25 20 15 10 0 0 0 30 30
1.5 < CC ≤ 3.0 (G)/2.5 (D) 45 45 45 45 40 25 20 15 10 0 0 0 40 40 CC > 3.0 (G)/2.5 (D) 45 45 45 45 40 25 20 15 10 0 0 0 50 75
Commercial vehicles
Bus GVW 5–24 tonnes 40 40 40 40 40 25 20 15 10 5 5 0 10 10
GVW > 24 tonnes 5 10 10 10 10 0 5 5 5 5 5 0 10 10
Pick-up or other truck GVW < 5 tonnes 40 45 45 45 40 25 20 15 10 15 10 7.5 10 0
GVW 5–24 tonnes 40 40 40 40 40 25 20 15 10 5 5 0 10 0
GVW > 24 tonnes 5 10 10 10 10 0 5 5 5 5 5 0 10 0
Double cabin GVW < 5 tonnes 40 45 45 45 40 25 20 15 10 15 10 7.5 10 20
Sources: Data from Fourin (2002, 2004, 2008) and unpublished data supplied by Gaikindo in 2013.
foreign assemblers and parts producers to transfer production know-how by investing in local assembly technologies, including tools and equipment. In short, within the policy space still allowed under WTO rules, the Indonesian govern
-ment has targeted the upgrading of the industry from CBU import to CKD import for vehicle assembly, and then on to IKD import for local CKD assembly, which requires higher capital-intensity in each industrial upgrade.
In 2009 the government announced a second automotive industrialisation
pol-icy, which targeted the development of new categories of vehicle: the small and
the environmentally friendly. It did so for several reasons. First, as Indonesia’s
middle class has grown, market demand has shifted from motorbikes to cars, and
this trend is expected to continue.17 Second, the government’s fuel subsidy has,
until recently, been a signiicant problem, and improving the fuel consumption of vehicles became an important way of reducing the subsidy’s cost.18 Indonesia,
which used to be an net oil exporter, has been an net oil importer since 2003. Third, the Indonesian automotive industry still has a weak local supporting industry,
despite the incentives of the IKD system.
In response to these issues, the Indonesian government targeted the produc-tion of a small, affordable, economical, environmentally friendly passenger
vehi-cle—the Low-Cost Green Car (LCGC). The project is expected to expand market
demand and create economies of scale, thus reducing components costs and, eventually, vehicle costs. The Indonesian government aims to stimulate market
demand by exempting LCGCs from luxury tax. LCGCs are affordable, with a
price estimated at $8,000–$9,000. In parallel to this, the Indonesian government
plans to develop a low-emission carbon project by attracting investment in elec -tric vehicles, hybrid vehicles, and vehicles that run on alternative fuels (such as
biofuel and compressed natural gas). These plans were passed by parliament in February 2013 and approved by the president in May 2013.
Indonesia’s new policies have some similarities to Thailand’s Detroit of Asia and Eco Car projects, which have enabled Thailand to enjoy rapid automotive industrialisation since 2000 (Natsuda and Thoburn 2013). Both countries use iscal policy to target the development of particular types of vehicles, while conforming to WTO rules. However, there are some differences, too. First, Thai policies have
aimed to stimulate not only market demand, by reducing excise tax on particular types of vehicles, but also foreign investment, by providing special tax-exemption incentives for automotive assemblers (and to cover their parts suppliers for the
beneits of tax concessions). In contrast, Indonesia does not offer special incen
-tives in the automotive sector, which is not even included in its ive strategic industries that are eligible for tax holidays (interview with BKPM representative, 20 Feb. 2013). For instance, at a public seminar at JETRO, the president of PT Toyota Motor Manufacturing Indonesia, Masahiro Nomani, stressed the impor
-17. For instance, domestic car sales are projected to more than triple over the period 2011 to 2025, while motorbike sales are projected to rise only by about half (presentation supplied by BKPM, Jakarta, dated Mar. 2012).
tance of introducing special incentives to encourage investment from second- and
third-tier suppliers (notes by the authors, Jakarta, 4 Mar. 2013). Second, Thai poli -cies are targeted at localising higher-value-added components, such as engine
parts, by imposing local production requirements in exchange for tax incentives.
By contrast, Indonesia does not directly target localisation activities, although its introduction of the IKD system is a move in this direction. Thai policies are more
systematically organised to attract foreign direct investment (FDI) and link with
the upgrading of local production activities. Furthermore, Thailand’s Board of
Investment established the Unit for Industrial Linkage Development (BUILD), which coordinates industrial linkages between assemblers and the local indus
-try (interview with the director of BUILD, Bangkok, 4 Sept. 2012). In Indonesia, executive oficers of the auto-parts industry pointed to the lack of effective gov -ernment policy in localisation, human-resource development, and technology
transfer within the country (interviews by the authors, Jakarta, 20 Feb. 2013).
Although incentives in Indonesia are not as attractive as those in Thailand, many automotive producers in Indonesia, such as Toyota, Daihatsu, Nissan,
Suzuki, and Honda—and including virtually all the companies we interviewed for this article—have expressed their strong interest in the LCGC project. For instance, Toyota, in association with Daihatsu, announced its irst LCGC models in September 2012, before the oficial approval of the project. Toyota’s Agya (a four-seater with a 1,000-cubic-centimetre engine) will be produced by Daihatsu under an original-equipment-manufacture arrangement. Daihatsu will also sell a rebadged Ayla under its own brand (Daily Jakarta Shimbun, 20 Sept. 2012). The Agya-Ayla model was designed for local road conditions and to meet new market needs, which include introducing small city vehicles and shifting from motor
-cycles to passenger vehicles (presentation by the president of PT Toyota Motor Manufacturing Indonesia, JETRO seminar, Jakarta, 4 Mar. 2013).
PROSPECTS AND CHALLENGES FOR INDONESIA WITHIN THE AUTOMOTIVE GLOBAL VALUE CHAIN
According to GIAMM, Indonesia’s vehicle production is expected to reach 1.5 million units in 2015 and 2 million units (70% of which will be for the domestic market) by 2020 (interview with GIAMM representative, Jakarta, 20 Feb. 2013).
This rapid development of the Indonesian motor industry derives from
Indone-sia’s fast rate of economic growth and its large population. Indeed, Indonesia has maintained a generally high GDP growth rate in the last decade; GDP growth increased, in real terms, from an annual average of 4.2% during 1990–2000 to 5.5% during 2000–2012. At an average annual growth rate of 5.5%, total real GDP would have almost doubled between 2000 and 2012. In terms of purchasing power parity (PPP) income, gross national income per capita rose from $4,010 in 2000 to $8,740 in 2012 (and to $9,260 in 2013) in current PPP dollars, an increase of 2.31 times during 2000–2013—or of 1.84 times in real terms, when crudely delated using the US GDP delator.19 As a result, the middle class, which can afford to purchase
cars, expanded rapidly. There is great scope for market growth: Indonesia’s ratio of vehicles per capita stood at only 5 per 100 people as of March 2010, far lower than the ratios of Thailand (14 per 100) and Malaysia (33 per 100) (Toyota Motor Asia Paciic Engineering and Manufacturing, unpublished data).
In the view of one key Japanese informant in Indonesia, interviewed in Jakarta in March 2013, igures in the optimistic forecasts are perfectly feasible, and could even be higher than expected. This is because of (a) the lower vehicle prices brought about by the LCGC project; (b) Indonesia’s high usage of automotive loan schemes (approximately 70%), which stimulates vehicle purchases; and (c) the creation of a variety of new models in the Indonesian automotive industry.
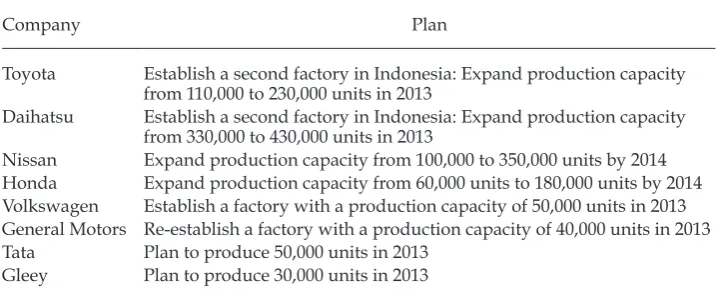
Indeed, some automotive producers are planning to expand their existing
pro-duction capacity or commence propro-duction in Indonesia (table 3). Although plans are not always realised, of course, table 3 gives strong reasons to expect expansion. As we have noted (see footnote 2), the automotive industry is one in which economies of scale are important, though they vary with stages of production and with degrees of vertical integration.20 If the domestic market continues to expand
quickly in response to rapid economic growth, the long-standing problems for
assemblers and component suppliers of the multiplicity of models—and the
accompanying low volumes (Witeolar 1983)—will become less serious. This opti
-mistic view is supported by igures for new automotive investment in Indonesia,
in the rupiah-to-dollar exchange rate, although such changes would also have been inlu-enced by capital movements as well as by PPP.
20. In December 1994, during the earlier development of the industry, data obtained by Tho-burn in an interview in Jakarta with the president of a major international (non-Japanese) motor manufacturer suggested the following minimum eficient scales: assembly plants for small cars or high-quality light commercial vehicles, 300,000 units per year (but they could get most of that eficiency at 150,000 units); low-quality light commercial vehicles, 100,000 units; transmissions or engines, 400,000 units (but most of the eficiency gains could be had in the irst 250,000 units); and axles, 300,000-400,000 units. The interviewee commented that, in the motor industry, ‘volumes dominate costs’.
TABLE 3 Expansion Plans of Major Vehicle Producers in Indonesia
Company Plan
Toyota Establish a second factory in Indonesia: Expand production capacity from 110,000 to 230,000 units in 2013
Daihatsu Establish a second factory in Indonesia: Expand production capacity from 330,000 to 430,000 units in 2013
Nissan Expand production capacity from 100,000 to 350,000 units by 2014 Honda Expand production capacity from 60,000 units to 180,000 units by 2014 Volkswagen Establish a factory with a production capacity of 50,000 units in 2013 General Motors Re-establish a factory with a production capacity of 40,000 units in 2013 Tata Plan to produce 50,000 units in 2013
Gleey Plan to produce 30,000 units in 2013
where foreign-capital projects have been increasing rapidly in response to pro -duction expansion plans.
Having accounted for 33 projects and $486 million in 2009, automotive FDI jumped to 94 projects and $637 million in 2011, and to 103 projects and $1.5
bil-lion in 2012 (igure 3). Investment in parts and accessories accounted for 67% and 79% of the total investment in the industry in 2011 and 2012, respectively. Japan accounted for the bulk of this investment: 65% of projects (227 projects) and 74% ($2.9 billion) of FDI during 2000–2011.
The Indonesian automotive industry is growing rapidly, but there are still sev -eral reasons for concern. First, domestic investment in the automotive and parts
industries has been extremely low compared with the trend of FDI (igure 3).
Local investment, for example, accounted for merely 11 projects and $48.6 million
(only 3.3% of FDI) in 2012. Within the automotive GVC or GPN, the upgrading opportunities of local parts-supplying irms—particularly those irms looking to
climb the tiers of the subcontracting system—may be hindered by competition
from incoming foreign irms, despite the possible transfers of technology (most often by Japanese irms). This problem was conirmed by our interviews with executive oficers of the local parts industry in Indonesia. It was a problem in the 1970s, too: Witoelar (1983) noted that much of the manufacture of ‘original equipment’ auto components had been captured by local conglomerates linked to
foreign assemblers, leaving indigenous suppliers as only the replacement market.
Our interviews with major Japanese automotive assemblers in Indonesia found that each automotive producer has approximately 100 irst-tier suppliers in Indo
-nesia: Nissan, for example, has 100 (most of them are Japanese joint ventures); Toyota has 80 (approximately 80% of which are Japanese joint ventures and 20% are local irms); and Mitsubishi (PT Krama Yudha Tiga Motors) has 125 (60% of which are Japanese joint ventures and 40% are local irms, but purely local irms
FIGURE 3 FDI and Domestic Investment in Indonesia’s Automotive Industry,
2000–2012
2000 2001 2002 2003 2004 2005 2006 2007 2008 2009 2010 2011 2012 0.0
Source: Unpublished data provided by BKPM in 2013.
are estimated to represent 10%–15%). In contrast, although Thailand’s automotive industry shares Indonesia’s strong tendency towards foreign ownership, a few indigenous Thai suppliers have been growing globally (or regionally) at the same
time. Auto-parts maker Thai Summit, for instance, has started making foreign
investments in Malaysia, Vietnam, Indonesia, China, and India in order to supply its components to Japanese assemblers and others (Fourin 2012, 220–21).
Second, the real LC ratios of Indonesia’s local supporting industry seem to be low—that is, when indirect import content has been deducted. Table 4 gives the LC ratios of major vehicle models in Indonesia in 2010. In general, major automo
-tive producers, which have large market shares, have higher LC ratios in their models. In contrast, a number of smaller assemblers (most of which rely on CKD kits) have lower LC ratios. In recent years, the IKD system seems to have had a positive inluence on these ratios. The LC ratio of Nissan’s Grand Livina model, for example, improved rapidly, increasing from 33% in 2010 to 73% in 2013. Simi
-larly, the LC ratio of Toyota’s Innova model improved from 71% in 2010 to 75% in 2012, and Toyota hopes it will reach 85% in the near future (presentation by the president of PT Toyota Motor Manufacturing Indonesia, JETRO, Jakarta, 4 Mar. 2013). However, these igures conceal a substantial indirect import content. The LC calculation method in Indonesia is based on the value of CKD parts, not
on subcomponents. For Toyota’s Kijang Innova model, for example, primary
sub components are produced locally and 80% of secondary or tertiary subcom
-ponents are imported (presentation by the president of PT Toyota Motor Manu
-facturing Indonesia, JETRO, Jakarta, 4 Mar. 2013). Consequently, the real LC ratio (based on subcomponents, thus taking indirect import content into account) is lower than the nominal LC ratio (based on CKD parts). Our interviews in 2013 suggested that the real LC ratio is approximately 50% of the nominal LC ratio.
Third, the poor standard of physical infrastructure, such as roads, ports, and electricity supply, is a serious concern. Indonesia’s standard of overall
infra-structure is much lower than that of Thailand or Malaysia (World Economic Forum 2013). A Gaikindo representive was adamant that demand for vehicles would increase rapidly if road conditions become better and if trafic congestion decreased (interview by the authors, Jakarta, 27 Feb. 2013).
TABLE 4 LC Ratios of Major Vehicle Models in Indonesia, 2010 (%)
Brand Model LC ratio Brand Model LC ratio
Daihatsu Gran Max 83 Mitsubishi Maven 72
Luxio 80 L3000 57
Xenia 77 Honda Jazz 50
Toyota Avanza 76 Hyundai sedan, MPV 40
Rush 73 Nissan Livina 33
Innova 71 Serena 26
Dyna 59 Mercedes sedan 30
Suzuki APV 75 BMW 3 Series 21
Futura 58 Chery sedan 10
Source: Gaikindo (2010, 26–27).
CONCLUSIONS
The Indonesian automotive industry has expanded greatly in recent years as per capita incomes have risen. Until the 1990s, the development of the industry had
been limited. Growth in the 1970s was rapid, but from a very low base, and in the
1980s total output hovered around 200,000 vehicles. Only in the 1990s did rapid
growth resume, although it was interrupted by the 1997–98 Asian inancial cri
-sis. The Indonesian government introduced an array of localisation-requirement policies in order to upgrade the local industrial structure, but these policies were not very effective. After the liberalisation forced by the IMF and the WTO, the
Indonesian automotive industry has developed steadily, producing more than 1
million vehicles in 2012 for the irst time. However, increased political stability may have had more to do with this expansion than liberalisation or particular policies, though such policies have become more inluential as the investment
climate has improved. The impact of policies on attracting automotive FDI from
Japan has been especially important, as in other Asian countries. The growth trend is expected to continue with future domestic-market growth, and also partly due to Indonesia’s new auto industrial policy in the form of the LCGC. Our interviews suggest that the LCGC seems to be strongly supported by Japanese vehicle assemblers, which have considerable experience of producing similar cars for the Japanese market.
Comparisons can be made between Indonesia and its neighbours Malaysia
and Thailand, both in terms of relative performance and in terms of policies and
their impact. Indonesia’s performance, measured in output growth, has been good—production increased by 3.6 times during 2000–2012, while world output
increased by less than half that. Indonesia’s increase in the rate of production is
much faster than that of Malaysia, whose vehicle output doubled. Only in com
-parison with Thailand, whose vehicle output increased sixfold, does Indonesia’s rate seem slow, and much of Thailand’s rise has been very recent: it passed the
million-unit mark—Indonesia’s 2012 output—only in the mid-2000s.
However, Indonesia’s performance has clearly lagged behind Thailand’s—prin -cipally because of Indonesia’s limited export development. An obvious, though
proximate, explanation is Thailand’s better ability to attract inward investment from the Japanese multinational motor-assembly companies that dominate Asia.
These companies have made Thailand their regional export base and, in turn, have persuaded their suppliers to come to Thailand, deepening the structure
of the Thai industry. Assemblers’ attitudes towards the countries in which they
operate, and to those countries’ policies, is crucial to industry performance.
It is worth remembering that Thailand’s success in automotive exports did
not start until the late 1990s, as an initial response to the dampening effects of
the 1997–98 Asian inancial crisis on the domestic market (Natsuda and Thoburn 2013, 426–27). Thailand suffered almost none of Indonesia’s post-1997 political
turmoil that deterred foreign investors.
In terms of policies, there are clear similarities between Indonesia and Malay
-sia. Malaysia’s attempts to aid national car production, particularly that of Proton, have greatly skewed policy away from the promotion of other automotive activi
the problems that Malaysia has faced in keeping Proton—and Proton’s network of indigenous suppliers—in business, Indonesia’s failure with its national car
appears to be a blessing in disguise, freeing the country to focus on the foreign-based automotive development that has characterised Thailand.
Indeed, the automotive policies of Indonesia have been somewhat similar to those of Thailand. Both countries banned the import of CBU vehicles for long periods: from 1978 to 1991 in Thailand (in the case of passenger cars) and from 1974 to 1993 in Indonesia. Both used the protection of heavy tariffs on CBU vehi
-cles after the bans were lifted, with rates of around 60% in Thailand from the mid-1990s onwards (Natsuda and Thoburn 2013) and at broadly similar levels in Indonesia over the same period (table 3).21 Both imposed lower but generally not
negligible tariffs on CKD vehicles, thus raising the effective rate of tariff protec
-tion on CBU vehicles beyond the nominal rate. And both used LC requirements and mandatory deletion policies to raise the levels of LC in their industries, before
the WTO prohibited these methods in the 2000s.
Both countries also undertook a degree of trade liberalisation in the 1990s. Indo-nesia’s policies to enhance its motor industry came later than Thailand’s, mainly
after the fall of Soeharto in 1998. Both removed explicit LC requirements in the 2000s under the WTO’s trade-related investment measures. However, there are
policy differences too. Thailand skilfully used excise-duty provisions to
encour-age its product champions—irst the pick-up truck, and then the eco-car (Natsuda and Thoburn 2013, 2014)—while Indonesia has gained from its focus on MPVs and on light commercial vehicles for private use, whose economies of scale are
less pronounced than those of sedans. Indonesia has encouraged investment in its
LCGC by exempting it from luxury tax, but not, as we have indicated, by provid
-ing incentives to investors like those in Thailand (Natsuda and Thoburn 2014).
It is sometimes argued that Indonesia suffers from shortages of human capital
and other supply-side constraints (Basri 2012, 40), or that it has had a high-cost
economy—evident, for example, in the cost of its industrial real estate compared
with Thailand’s (Witoelar 1983, 55). While this helps to explain the slow devel -opment of an indigenous sector of local component manufactures in Indonesia,
Thailand’s success in the motor industry has overwhelmingly been one of attract
-ing inward direct investment, principally from Japan—in component production as well as vehicle assembly—rather than the development of indigenous irms.
Thailand’s extensive components industry also has a heavy foreign presence, and
in its irst tier of suppliers fewer than a quarter of the irms are purely Thai (Nat
-suda and Thoburn 2013), although there are a few well-known Thai component makers. Inluential commentators (Lauridsen 2009; Doner 2009, chapter 7) have
argued that there has been little upgrading of indigenous Thai component
sup-pliers, though we have identiied some recent evidence to the contrary (Natsuda and Thoburn 2013, 432).
We have chronicled the recent rapid rise not only in Indonesian vehicle output but also in FDI in further production capacity, particularly in auto components
and particularly from Japan. The expansion of assemblers’ foreign suppliers in
Indonesia offers some scope for local producers to upgrade in joint ventures,
though it also excludes them from much of the top tier of parts production. Major Japanese automotive manufacturers that we have interviewed appear optimis -tic about Indonesia’s potential as a producer. The main driver of the automotive industrialisation in Indonesia derives from its market potential—it has the
larg-est population in Southeast Asia—and its rapid economic growth. This poten
-tial enables Indonesia to attract investments in the automotive industry without
providing more attractive incentives. After having been frustrated by the WTO
in developing its national car, the Indonesian government has been able to ind enough policy space to foster its LCGC project without violating WTO rules, though providing further help to local suppliers might require ingenuity beyond the already useful IKD system. Indonesia’s strategic geographical position, which offers direct export possibilities to Australia and the Middle East, could well be one of the drivers in the future (interview with a major Japanese motor assembler, Indonesia, March 2013).
REFERENCES
Asanuma, Banri. 1997. Nihon no kigyo soshiki kakushinteki teki no mekanizumu: Choki torihiki kankei no kozo to kino [Corporate organisation in Japan, the mechanism of the revolution-ary adaptation: The structure and function of long-term business relationships]. Tokyo: Toyo Keizai Shinposha.
Aswicahyono, Haryo, M. Chatib Basri, and Hal Hill. 2000. ‘How Not to Industrialise? Indo-nesia’s Automotive Industry’. Bulletin of Indonesian Economic Studies 36 (1): 209–41. Athukorala, Prema-chandra. 2011. ‘Production Networks and Trade Patterns in East Asia:
Regionalization and Globalization’. Asian Economic Papers 10 (1): 65–95.
Auty, R. M. 1994. ‘Sectoral Targeting: Auto Manufacture in Korea and Taiwan’. Journal of International Development 6 (2): 609–25.
Basri, M. Chatib. 2012. ‘Indonesia’s Role in the World Economy: Sitting on the Fence’. In Indonesia Rising: The Repositioning of Asia’s Third Giant, edited by Anthony Reid, 28–48. Singapore: Institute of Southeast Asian Studies.
Chalmers, Ian. 1994. ‘Domestic Capital in the Evolution of Nationalist Auto Development Policy in Indonesia: From Instrumental to Structural Power’. Asia Research Centre Working Paper 30, Murdoch University, Perth.
Clark, Kim B., and Takahiro Fujimoto. 1991. Product Development Performance: Strategy,
Organization, and Management in the World Auto Industry. Boston, MA: Harvard
Busi-ness School Press.
Doner, Richard. 1991. Driving a Bargain: Automobile Industrialization and Japanese Firms in
Southeast Asia. Berkeley, CA: University of California Press.
———. 2009. The Politics of Uneven Development: Thailand’s Economic Growth in Comparative
Perspective. New York: Cambridge University Press.
Doran, Desmond. 2004. ‘Rethinking the Supply Chain: An Automotive Perspective’. Supply Chain Management: An International Journal 9 (1): 102–9.
Fourin. 1994–2011. Ajia jidosha sangyo [Asian automotive industry]. Nagoya: Fourin.
———. 2012. Ajia jidosha buhin sangyo [Asian automotive parts industry]. Nagoya: Fourin. Fumimoto, Takahiro, Shoichiro Sei, and Akira Takeishi. 1994. ‘Nihon jidosha sangyo no
supplier system no zentaizo to sono tamensei’ [The total perspective and multifaceted nature of the supplier system in the Japanese automotive industry]. Kikai Keizai Kenkyu
24: 11–36.
Gaikindo (Association of Indonesian Automotive Industries). 2010. Enter the World Mobility Through Building Competitive Automotive Industry 2010–2013. Jakarta: Gaikindo. Gallagher, Kevin P., ed. 2005. Putting Development First: The Importance of Policy Space in the
WTO and International Financial Institutions. London: Zed Books.
Gerefi, Gary. 1994. ‘The Organization of Buyer-driven Global Commodity Chains: How U.S. Retailers Shape Overseas Production Networks’. In Commodity Chains and Global Capital-ism, edited by Gary Gerefi and Miguel Korzeniewicz, 95–122. Westport, CT: Praeger.
———. 2014. ‘Global Value Chain Analysis in a Post-Washington Consensus World’. Review of International Political Economy 21 (1): 9–37.
Hale, Christopher D. 2001. ‘Indonesia’s National Car Project Revised: History of Kia-Timor Motors and Its Aftermath’. Asian Survey 41 (4): 629–45.
Hansen, John R. 1971. ‘The Motor Vehicle Industry’. Bulletin of Indonesian Economic Studies 7 (2): 38–69.
Henderson, Jeffrey, Peter Dicken, Martin Hess, Neil Coe, and Henry Wai-Chung Yeung. 2002. ‘Global Production Networks and the Analysis of Economic Development’. Review of International Political Economy 9 (3): 436–64.
Hill, Hal. 2000. The Indonesian Economy, 2nd ed. Cambridge: Cambridge University Press. Humphrey, John. 2003. ‘Globalization and Supply Chain Networks: The Auto Industry in
Brazil and India’. Global Networks 3 (2): 121–44.
Humphrey, John, and Olga Memedovic. 2003. The Global Automotive Industry Value Chain: What Prospects for Upgrading by Developing Countries. Vienna: United Nations Industrial Development Organization.
Humphrey, John, and Hubert Schmitz. 2002. ‘How Does Insertion in Global Value Chains Affect Upgrading in Industrial Clusters?’. Regional Studies 36 (9): 1017–27.
Inoue, Hitoshi. 1990. ‘Indonesia no jidosha kokusanka seisaku to Nihon jidosh shihon’ [Localisation policy for the automotive industry in Indonesia and Japanese automotive capitals]: Keizai Ronshu (Kyoto University) 146 (3–4): 61–84.
Karmokolias, Yannis. 1990. ‘Automotive Industry Trends and Prospects for Investment in Developing Countries’. International Finance Corporation Discussion Paper 7, World Bank, Washington, DC.
Kimura, Fukunari, and Ayako Obashi. 2011. ‘Production Networks in East Asia: What We Know So Far’. ADBI Working Paper 320, Asian Development Bank Institute, Tokyo. Lauridsen, Laurids S. 2009. ‘The Policies and Politics of Industrial Upgrading in Thailand
during the Thaksin Era (2001–2006)’. Asian Politics and Policy 1 (3): 409–34.
MacIntyre, Andrew. 1995. ‘Power, Prosperity and Patrimonialism: Business and Govern-ment in Indonesia’. In Business and Government in Industrialising Asia, edited by Andrew MacIntyre, 244–67. Ithaca, NY: Cornell University Press.
Natsuda, Kaoru, Noriyuki Segawa, and John Thoburn. 2013. ‘Globalization, Industrial Nationalism, and the Malaysian Automotive Industry’. Global Economic Review 42 (2): 113–34.
Natsuda, Kaoru, and John Thoburn. 2013. ‘Industrial Policy and the Development of the Automotive Industry in Thailand’. Journal of the Asia Paciic Economy 18 (3): 413–37.
———. 2014. ‘How Much Policy Space Still Exists Under the WTO? A Comparative Study
of the Automotive Industry in Thailand and Malaysia’. Review of International Political Economy 21 (6): 1346–77.
Nolan, Peter. 2012. Is China Buying the World? London: Polity Press.
Nomura, Toshiro. 1996. ‘Indonesia no kukuminsha keikaku to Humpuss, Kia no jishosha sannyu’ [National car plan and Humpuss and Kia’s entry into the Indonesian automo-tive industry]. ShoKei Ronshu 47: 23–69.
———. 2003. ‘Indonesia jidosha sangyo no kaihokatei’ [Liberalisation process of the Indo-nesian automotive industry]. ShoKei Ronshu 53: 1–64.
Otsuka, Kozo, and Kaoru Natsuda (forthcoming) ‘The Determinants of Total Factor Pro-ductivity in the Malaysian Automotive Industry: Are Government Policies Upgrading Technological Capacity?’. Singapore Economic Review.
Pavlínek, Petr, and Jan Ženka. 2011. ‘Upgrading in the Automotive Industry: Firm-Level Evidence from Central Europe’. Journal of Economic Geography 11 (3): 559–86.
Sato, Yuri. 1992. ‘The Automotive Industry’. In Indonesia no kogyoka [Industrialisation in Indonesia], edited by Norio Mihara and Yuri Sato, 336–61. Tokyo: Institute of Develop-ing Economies.
Segawa, Noriyuki, Kaoru Natsuda, and John Thoburn. 2014. ‘Afirmative Action and Eco-nomic Liberalisation: The Dilemmas of the Malaysian Automotive Industry’. Asian Studies Review 38 (3): 422–41.
Takeishi, Akira, and Takahiro Fujimoto. 2001. ‘Modularisation in the Auto Industry: Inter-linked Multiple Hierarchies of Product, Production and Supplier System’. International Journal of Automotive Technology and Management. 1 (4): 379–96.
Thoburn, John T. 1973. ‘Exports and the Malaysian Engineering Industry: A Case Study of Backward Linkage’. Oxford Bulletin of Economics and Statistics 35 (2): 91–117.
———. 2001. ‘Becoming an Exporter of Manufactures: The Case of Indonesia’. In Policy Reform and Manufacturing Performance in Developing Countries, edited by Oliver Morris-sey and Michael Tribe, 97–119. London: Edward Elgar.
Thoburn, John, and Makoto Takashima. 1992. Industrial Subcontracting in the UK and Japan. London: Avebury.
UNCTAD (United Nations Conference on Trade and Development). 2013. World Invest-ment Report 2013: Global Value Chains: InvestInvest-ment and Trade for DevelopInvest-ment. Geneva: UNCTAD.
Wade, Robert Hunter. 2003. ‘What Strategies Are Viable for Developing Countries Today? The World Trade Organization and the Shrinking of “Development Space”’. Review of International Political Economy 10 (4): 621–44.
Witoelar, Wirmar. 1983. ‘Ancillary Firm Development in the Motor Vehicle Industry in Indonesia’, in The Motor Vehicle Industry in Asia: A Study of Ancillary Firm Development, edited Konosuke Odaka, 17–84. Manila: Council of Asian Manpower Studies.