THE UNCERTAINTIES ON THE GIS BASED LAND SUITABILITY ASSESSMENT FOR
URBAN AND RURAL PLANNING
Huimin Liua,b, *, Qingming Zhana,b, Meng Zhana
a
School of Urban Design, Wuhan University, 8 Donghu South Road, Wuhan 430072, China – [email protected] b
Collaborative Innovation Center of Geospatial Technology, 129 Luoyu Road, Wuhan 430079, China – [email protected]
Commission VI, WG VI/4
KEY WORDS: Uncertainty, Land suitability assessment, GIS, Planning
ABSTRACT:
The majority of the research on the uncertainties of spatial data and spatial analysis focuses on some specific data feature or analysis tool. Few have accomplished the uncertainties of the whole process of an application like planning, making the research of uncertainties detached from practical applications. The paper discusses the uncertainties of the geographical information systems (GIS) based land suitability assessment in planning on the basis of literature review. The uncertainties considered range from index system establishment to the classification of the final result. Methods to reduce the uncertainties arise from the discretization of continuous raster data and the index weight determination are summarized. The paper analyzes the merits and demerits of the “Nature Breaks” method which is broadly used by planners. It also explores the other factors which impact the accuracy of the final classification like the selection of class numbers, intervals and the autocorrelation of the spatial data. In the conclusion part, the paper indicates that the adoption of machine learning methods should be modified to integrate the complexity of land suitability assessment. The work contributes to the application of spatial data and spatial analysis uncertainty research on land suitability assessment, and promotes the scientific level of the later planning and decision-making.
* Corresponding author
1. INTRODUCTION
1.1 The research on spatial data and spatial analysis uncertainty
Due to knowledge limitation, measurement inaccuracy and error propagation during information processing, geographical information always possesses various amounts of uncertainty. (Goodchild and Gopal, 1989; Beard et al., 1991; Buttenfield, 1991; Zhang and Goodchild, 2002; Xiao et al., 2007). Therefore, data users should be aware that “all spatial data are wrong, but some are useful (outside of some exceptions where the data becomes legally the reality)” (Devillers et al., 2010). The early computer mapping exercise done at the Harvard Laboratory for Computer Graphics and Spatial Analysis in the late 1970s revealed that imperfection is inherent to spatial data and can directly influence the reliability of spatial analysis output (Chrisman, 2006). Works on the uncertainty of spatial data increased significantly with the arrival of GIS in the early 1980s with their capability to integrate spatial and non-spatial data, including the evaluation of specific data quality elements of vector, raster, and Digital Elevation Model (DEM) data, also remote sensing images (Devillers et al., 2010). Wu (2002) established a frame of GIS uncertainty and summarized the methods towards GIS data uncertainty. Besides, emphasis should also be placed on spatial analysis uncertainty since “all models are wrong, but some are useful” (Box, 1976). The national economic and social research council of America (ESRS) presented “The error propagation in geographic information systems” as one of the priority subject. The centre for spatial data analysis (nex-pri) in the Netherlands also promoted the question of “The theory of spatial analysis- error propagation in spatial analysis” while formulating their research plan (Wu et al., 2002). Shi (2015) has modelled the
uncertainties of overlay analysis and buffer analysis to control the uncertainty propagation of spatial data during spatial analysis.
The disjunction of the uncertainty research with user requirement and practical application has now become one of the major problems which demands great emphasis (Devillers et al., 2010). The phenomena is partly generated by the deficiency of uncertainty research on the whole process from data acquisition and preparation, spatial analysis operation and results display from the perspective of certain application. The comprehension of the nature of the problem should get done before any best possible solutions are promoted. (Devillers et al., 2010).
1.2 The deficiency of reliability assessment on the application of GIS in planning
“untangle” activities such as advice giving, storytelling, myths, and other metaphors and rhetorical devices (Klosterman, 2001). The untangled activities are critical for the best balance and the optimal benefits of planning. The pure dependence of the information technology might bring about negative impact on the equity, accuracy and quality of real life (Malczewski, 2004).
1.3 The overview of the GIS based land suitability assessment uncertainty
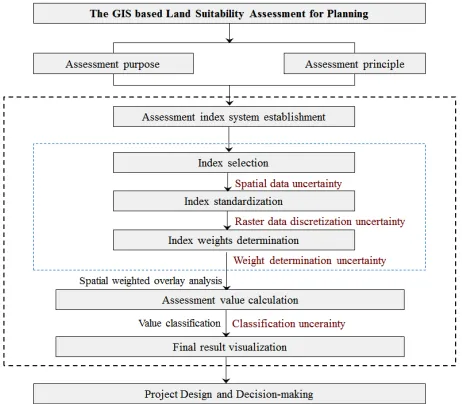
Uncertainty has been considered in land suitability assessment, yet still insufficient especially in the field of planning. Land suitability assessment is an approach planners employ to identify the most appropriate spatial pattern for future land allocation according to specify requirements and preferences (Hopkins, 1977; Collins et al., 2001; Malczewski, 2004). The GIS-based land suitability assessment can be traced back to the applications of hand-drawn overlay techniques used by American landscape architects in the late 19th and early 20th (Collins et al., 2001). The spatial weighted overlay analysis is regarded as the most significant application of GIS in planning and management (Hopkins, 1977; Brail and Klosterman, 2001; Collins et al., 2001; Malczewski, 2004). With the continuous promotion of the multiple-planning integration, land suitability assessment will exert a much more scientific and fundamental role on the multiple planning projects. The land suitability assessment procedure in planning generally employs the multiple criteria decision-making (MCDM) method. The flow chart along with the possible uncertainties is presented in Fig.1.
Figure 1. The flow chart of the land suitability assessment procedure in planning
The error in data and the discrepancy of methods can inevitably lead to uncertainty of the final suitability result and further decision-making (Hu et al., 2007a). In this regard, uncertainty exists in data preparation, index standardization, weights determination and result visualization. Research has been done on the uncertainties of land suitability assessment and ecological sensitivity assessment. For instance, the uncertainties of the DEM resolution, interpolation method and scale effect of terrain description (GAO, 1997; Tang et al., 2003; Chen et al., 2005; Shi, 2015), index standardization (Bolliger and Mladenoff, 2005; Zhou et al., 2007; Zhang et al., 2010), weight determination (Hu et al., 2007b; Liu et al., 2012; Zhuo, 2012) and result classification and visualization (Hu et al., 2007a).
Some experts focus on the uncertainty analysis of the whole process of land assessment (Hu et al., 2007a; Yu, 2010). However, this macro perspective neglects the specificity of planning and the custom of planners, making it difficult to make an anticipative difference in the actual application. The ignorance of uncertainty will undoubtedly exert negative impact on the scientific nature and accuracy of the later planning. The uncertainty might gradually enlarge as the planning procedure advances, resulting in the frequent modification of planning schemes, illegal land use phenomena and ecological environment deterioration.
The paper establishes a framework of the GIS based land suitability assessment uncertainty research, ranging from index system establishment (the uncertainties of the data itself, the discretization of continuous raster data, index weight determination), to the classification of the final result.
2. THE UNCERTAINTY OF THE INDEX SYSTEM 2.1 The uncertainty of index data
2.1.1 The uncertainty of raw data: Due to the inherent uncertainty of the external world which is a complex, multidimensional and nonlinear system, the knowledge limitation, the measurement inaccuracy and the error propagation during data processing and analysis (Hu et al., 2007a; Longley et al., 2011; Shi, 2015), the data collected for the land suitability assessment possess certain uncertainty.
The reliability of the assessment result depends on the data quality and the depth of the land and land-use related knowledge (Rossiter, 1996). Land suitability assessment is a comprehensive multiple criteria analysis involving the consideration of soil condition, hydrology, meteorology, geology, humanities, etc. The reliability of these data demands emphasis. For instance, the elevation, slope and aspect data derived from DEM are generally used in land suitability assessment to characterize topographical features, while the reliability of DEM to represent spatial information is affected by the original sampling and the interpolation method applied to generate it (Shi, 2015).
2.1.2 The uncertainty of applying raster data as the assessment object: The raster data model has traditionally been regarded as the more appropriate approach for land-use suitability applications as the raster data structure is area-oriented (Malczewski, 2004). However, uncertainty exists on applying raster data to represent spatial information, such as the uncertainty to explain attribute value and identifying the location of a set-point (Wang and Du, 2007).
2.2 The uncertainty on the discretization of continuous raster data
The discretization of continuous features can result in the loss of the spatial distribution of a feature (Bolliger et al., 2005). In terms of land suitability assessment, continuous features like elevation, slope and aspect are required to be discretized into single-feature classification for the raster weighted overlay in land suitability assessment. However, the information loss of the process is generally ignored by planners. Take slope as an example, planners generally divide slope into five categories: 0°-5° as the most suitable, 5°-8° as suitable, 8°-15°as marginally suitable, 15°-25° as not suitable, those greater than 25° as the least suitable. Among them, 8.01° and 14.99° belong to the same level although they differ a lot form each other. While 7.99° and 8.01° belong to two different levels even the gap is pretty small (Zhou et al., 2007; Liu et al., 2012).
There are many approaches to explore the uncertainties of continuous raster data discretization, such as grey system method, rough sets and fuzzy mathematics. Zhou et al. (2007) adopted grey system to reduce the uncertainty. He pointed out that sampling should be as balanced as possible and the original data should be standardized before calculating the correlation coefficient. The research of the information loss from the continuous numeric features discretization also roots in the simple application of machine learning methods such as rough sets. Hu et al. (2008) constructed a numeric feature selection algorithm based on neighborhood rough set model to directly deal with the numeric attribute, saving the process of discretization. To solve the uncertainty, some experts apply the membership function in fuzzy mathematics to describe the degree of continuous data association (Zhang et al., 2010; Bolliger et al., 2005). Fuzzy sets are usually combined with MCDM in the field of suitable analysis. Corona et al. (2008) combined fuzzy sets and the weight linear combination in multiple criteria methods to conduct the land suitability assessment in south Italy, the result applied rational number 0 and 1 to represent the suitability grades, 0 as not suitable, 1 as very suitable. However, problem exists as how to accurately determine the membership function in fuzzy logic method. The determination has certain subjectivity because the cognition and understanding of the same fuzzy concept differs from one another. Some research amended the model to solve the problem and achieved higher reliability. Experts applied the cloud model to represent the fuzziness of quantitative data based on the randomness of the membership function (Hu et al., 2007b; Fan et al., 2008). Cloud model is a quality-quantity interchangeable model combining traditional fuzzy mathematics and probability statistics. It integrates fuzziness and randomness to realize the conversion between qualitative concept and quantitative value (Hu et al., 2007b). Zhou et al. (2014) applied normal cloud model to achieve the uncertainty mapping of the evaluation indexes on ecological risk grades. Randomness and fuzziness of index quantization and level division were considered to acquire a more objective result. As to the multiple features of the indexes which conclude continuous-value, discrete-value and nominal-value, Hu et al. (2005) proposed a neural network based method to extract fuzzy rules for multiple features. Classification rules can be trained and acquired through land samples. Liu et al. (2004) established a fuzzy neural network which could enable the membership function and rule sets to adjust adaptively.
2.3 The uncertainty of index weight determination
The land suitability assessment is comprehensively affected by objective laws also the development priorities of the region, making the determination of the index weights intractable and complicated. Research on the uncertainty of the index weight determination is abundant. Hu et al. (2006) presented a method integrating subjective and objective information to determine the final index weights. The method applies an improved Delphi method to acquire the subjective weights, and an improved correlation analysis method for objective weights. Huang et al. (2007) indicated the defects of the comprehensive assessment methods generally applied like Analytic Hierarchy Process (AHP), fuzzy comprehensive method and Neural Network based method. He argued that these methods can only offer a comprehensive assessment result without a certainty measurement. They are unable to deal with the unknown factors as well. He thus promoted a comprehensive assessment method based on the D-S evidence theory, which is able to manage two different kinds of uncertainty (inconsistency and non-specificity) compared to Probability Theory which can only manage randomness. Zhuo (2012) adopted the entropy method to calculate weights. Some research applies variable coefficient to expand the internal differences in weights so as to increase the differentiation among the classes (Liu et al., 2012). On the whole, the methods can be divided into subjective weighting method (Delphi method, grey conjunction analysis, AHP, etc.) and objective weighting method (mean square deviation algorithm, range method, entropy method, etc.) (Guo, 2002) .Subjective weighting method means hiring experts who possess land knowledge to grade the indexes and then calculate the weights, while objective weighting method implies the adoption of mathematical theory and method to calculate the weights from observation data. One of the prior works for land suitability assessment is to integrate the merits of the two methods and overcome their demerits, such as the fuzziness and randomness of experts’ understanding towards the indexes and weights, also the over-emphasis on quantitative method while ignoring the subjective attitude of decision-makers (Hu et al., 2007a).
3. THE UNCERTAINTY OF THE ASSESSMENT RESULT CLASSIFICATION
As the final step of the land suitability assessment, the raster weighted overlay analysis is critical as the result acts as a bridge between mappers to decision-makers. Uncertainty in inherent in map classification and can generate an unreliable spatial pattern. However, uncertainty is largely ignored in choropleth mapping (Koo et al., 2017). The classed map is a medium that displays the specific land suitability conditions of a region to urban planners, public officials and also the public. Neglecting the uncertainty of the classification will definitely impact the accuracy of the assessment, leading to decision risk.
Loidl, 2012). The acceptance of the misclassification level of a map is determined by the purpose of the map (Xiao et al., 2007). As a result, the production of a choropleth map must put great emphasis on the application purpose and the corresponding users (Mark, 1974). Some papers focus on the uncertainty of the choropleth map classification and related solutions are proposed (Jenks and Caspall, 1971; Xiao et al., 2007). It is certain that data inaccuracy and the error propagation during information processing can bring doubt into the reliability of the classification.
The reliability of GIS tools demands emphasis as well. The process of spatial analysis follows a series of well-defined stages: problem formulation, planning, data gathering, exploratory analysis hypothesis formulation, modeling and testing, consultation and review, etc. However, GIS related software tools only address the middle sections of the process. Besides, GIS software places almost no constraints upon a user’s selection of classification method although classification should be interpreted in terms of purpose as well as method (Smith et al., 2015). As a result, some resulting maps might fail to properly reflect data-inherent patterns and a part of which might even indicate spatial configurations that have no reliable statistical or contextual logic (Maceachren and Ganter, 1990).
Uncertainty also exists during the final classification of the land suitability assessment result. Multiple factors influence the certainty of the classification, such as data type, class numbers, intervals and the autocorrelation of the spatial data (Slocum et al., 2005; Traun and Loidl, 2012; Smith et al., 2015). Planners ought to avoid the pure application of the software and select the most suitable classification method according to the data feature and the actual demand of planning.
3.2 The uncertainty of data classification based on ArcGIS
3.2.1 The various methods for data classification based on ArcGIS: ArcGIS provides a variety of classification methods for raster data, including manual, equal interval, defined interval, quantile, natural breaks, geometrical interval and standard deviation. A brief introduction of the methods can be checked in table 1 (ESRI, 2014).
Methods Description/application
Manual
The analyst allows users to define their own classes, they can manually add class breaks and set class ranges that are appropriate for their data.
Equal interval
Equal interval divides the range of attribute values into equal-sized subranges. It is best applied to familiar data ranges, such as percentages and temperature.
Defined interval
Defined interval allows users to specify an interval size used to define a series of classes with the same value range. ArcMap will determine the number of classes based on the interval size and the range of all field values.
Quantile
Each class contains an equal number of features. The method is well suited to linearly distributed data. Quantile assigns the same number of data values to each class.
Natural breaks
Classes are based on natural groupings inherent in the data. Class breaks are identified that best group similar values and that maximize the differences between
classes. It is data-specific classification and not useful for comparing multiple maps built from different underlying information.
Geometrical interval
The method scheme creates class breaks based on class intervals that have a geometrical series. This algorithm was specifically designed to accommodate continuous data.
Standard deviation
The Standard deviation classification method shows users how much a feature's attribute value varies from the mean. ArcMap calculates the mean and standard deviation. Table 1. A brief introduction of classification methods provided
by ArcGIS. (The content is derived from ArcGIS 10.2 Help: Classifying Numerical Fields for Graduated Symbology.)
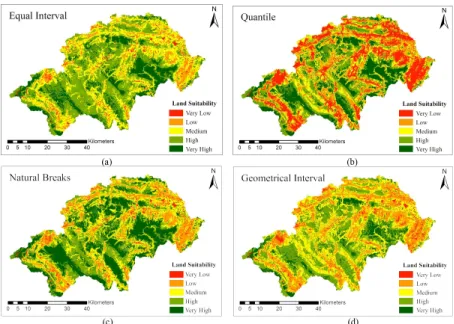
The difference among the classification methods for univariate analysis is remarkable (Chang,1978; Brewer and Pickle, 2002). The paper takes the land suitability assessment result of Shennongjia Forest District in China to demonstrate the various methods provided by ArcGIS. Equal interval, quantile, natural breaks and geometrical interval allow users to define the class numbers. The paper divides the raster data into 5 classes according to the research conclusion suggested in 3.3.1. Fig 2 shows that the results vary a lot from each other although they apply the same raster data into the same numbers of classes. Defined interval and standard deviation automatically determine the number of classes as 6 (Fig 3). The classification results differ from each other as well.
Figure 2. The 5-class land suitability maps of Shennongjia Forest District using (a) Equal interval, (b) Quantile, (c) Natural
breaks, (d) Geometrical interval
Figure 3. The 6-class land suitability maps of Shennongjia Forest District using (a) Defined interval, (b) Standard deviation
methods is essential. The natural breaks (Jenks) is broadly used by planners as a default priority for the classification of raster data (Claggett et al., 2004; Ren, 2012; Chen et al., 2013; Luo, 2016). The next part will explore the applicability of the method in land suitability assessment.
3.2.2 The applicability of the natural breaks (Jenks): The natural breaks method in ArcGIS refers to a classification method for choropleth map put forward by Jenks (Jenks and Caspall, 1971; Jenks, 1977). The method is equivalent to unconstrained clustering (Fisher, 1958). Breaks which are selected to separate values where large changes in value occur are typically uneven. The result can be significantly affected by the number of classes (Smith et al., 2015). The method is extensively applied in GIS packages such as ArcGIS (Dent, 1999; Koo et al., 2017).
Jenks Natural Breaks algorithm (Smith et al., 2015):
“Step 1: The user selects the attribute, x, to be classified and specifies the number of classes required, k;
Step 2: A set of k-1 random or uniform values are generated in the range [min{x}, max{x}]. These are used as initial class boundaries;
Step 3: The mean values for each initial class are computed and the sum of squared deviations of class members from the mean values is computed. The total sum of squared deviations (TSSD) is recorded;
Step 4: Individual values in each class are then systematically assigned to adjacent classes by adjusting the class boundaries to see if the TSSD can be reduced. This is an iterative process, which ends when improvement in TSSD falls below a threshold level, i.e. when the within class variance is as small as possible and between class variance is as large as possible. True optimization is not assured. The entire process can be optionally repeated from Step 1 or 2 and TSSD values compared.”
Although the natural breaks (Jenks) method has been broadly applied in univariate classification, its applicability in the land suitability assessment in planning still requires verification. Research has shown that the method considers only variances among attribute estimates while ignoring their uncertainties (Jenks, 1977; Koo et al., 2017). According to the development and application of the natural breaks (Jenks) method besides the field of suitability assessment, it is generally applied to the classification of some initial data based on their patterns, such as mortality map (Brewer and Pickle, 2002), population density map (Xiao et al., 2007), rainfall map (Golian et al., 2010), median household income map (Koo et al., 2017). The land suitability assessment is a comprehensive analysis which covers index standardization, weight determination and raster weighted overlay before the final classification procedure, making the final classification much more complicated than the applications mentioned above. The accomplishment of the former procedures actually delivers some kind of expectation to the final result. However, the adoption of the natural breaks (Jenks) method will risk ignoring the expectation while purely focus on the pattern of the data itself.
Besides, ESRI (2014) indicates that “natural breaks are data-specific classifications and not useful for comparing multiple maps built from different underlying information”. In terms of land suitability assessment, the assessment rule of different regions should not differ two much from each other as planning site selection follows certain universal law despite of the peculiarity of a region. As a result, the adoption of the natural breaks (Jenks) method might end up distinct difference between the land suitability levels of the same region from two different
scales of analysis. The paper applies the natural breaks (Jenks) in a town named Songbai inside Shennongjia Forest District from the forest district scale and the town scale. The results differ a lot from each other, especially in the low level where the difference in area percentage reach up to 12.2% (Fig 4, Table 2).
Figure 4. Two land suitability maps of Songbai Town. (a) Shennongjia Forest District scale, (b) Songbai Town scale
Classes Forest District scale (%)
Town scale
(%) D-value
Very low 5.2 5.2 0
Low 10.8 23.0 -12.2
Medium 35.1 31.4 3.7
High 30.2 27.0 3.2
Very high 18.7 13.4 5.3
Table 2. The area percentage of the 5 land suitability classes from Shennongjia Forest District scale and Songbai Town scale
3.3 The uncertainty of the assessment result classification 3.3.1 The number of classes: The selection of different numbers of class will definitely leads to different result (Jenks and Caspall, 1971; Slocum et al., 2005; Traun and Loidl, 2012; Smith et al., 2015). As to the land suitability assessment in planning, there is no uniform standard for the numbers of class. The current existing class numbers including 3 classes (Corona, 2008; Liu et al., 2012; Ren, 2012), 4 classes (Chen et al., 1999; Chen et al., 2010) and 5 classes (Zhou et al., 2007; Zhuo, 2012). Research indicates that the number of breaks should be an odd value as even number of classes misses a central class. With a number of classes less than 4 or 5 the level of detail obtained may be too limited while more than 9 classes makes it difficult to distinguish key differences between zones (Smith et al., 2015). Integrating actual applications with expert advice, the paper applies 5 classes for the demonstration.
et al., 2005), K-Means clustering (Zhou et al., 2007) and ant colony optimization (Yu, 2010). The main challenge is to integrate the expectation delivered from the former procedures and the specific pattern of the data to achieve a better result.
3.3.3 The spatial autocorrelation of geographical data: Almost all geographical data possesses the nature of autocorrelation while it is commonly ignored as the classification for choropleth maps is generally based on non-spatial attribute values (Traun and Loidl, 2012). According to Tobler’s first law of geography (Tobler, 1970), attribute values that are close in space tend to have similar values and are more likely to fall into the same class interval (Mak and Coulson, 1991). Research has revealed that land-use spatial data follow the first law of geography and possess certain autocorrelation (Xie et al., 2006; Qiu et al., 2007; Gao et al., 2010). To ensure the accuracy of the land suitability assessment analysis, the data acquired should be as precise as possible. Elevation and slope data derived from DEM ought to get a resolution as high as possible. Consequently, the final result of the assessment might end up being too trivial in some areas (Fig 5), leaving erratic “islands” within a certain class just because the grid value falls slightly above or below the class interval. Traun and Loidl (2012) concluded the current spatially aware classification methods and their possibility of improvement. They also presented a new approach named “Regioclassification”, which adapts to the degree of spatial autocorrelation in data through the combination of the Moran’s I scatter plot with the Fisher– Jenks algorithm. According to the research, the classifications for spatially autocorrelated data utilizing “Regioclassification” are visually less complex than those employing non-spatial classification approaches. The method can be further explored for classification of land suitability.
Figure 5. The erratic “islands” in the land suitability map of Shennongjia Forest District
4. CONCLUSION AND DISCUSSION
Specific to the MCDM planners generally adopt for land suitability assessment, the paper discusses the uncertainties of the index system establishment (the uncertainties of the data itself, the discretization of continuous raster data, index weight determination) and the classification of the final result. Further research can be carried out on the uncertainty of index selection, the quantization of the uncertainty in each link and the uncertainty propagation during the whole process. The
comparison between MCDM and the arising artificial intelligence (AI) approach should as well be considered.
The applicability of machine learning methods like neural network and K-means in classification also demands further investigation. As discussed above, land suitability assessment is much more comprehensive and complicated than pure data classification and clustering. Thus, machine learning methods ought to be modified to integrate the expectation delivered from the former procedures and the specific pattern of the data to achieve a better classification result. Planning possesses high spatiotemporal complexity as a particular application field of spatial data and spatial analysis. The information technology application in this field should integrate this complexity with the actual demand so as to guarantee the equity and accuracy of the analysis, so should the research of the land suitability assessment uncertainty.
ACKNOWLEDGEMENTS
This research is supported by the National Science and Technology Support Project of China (No.2014BAL05B07) and the National Natural Science Foundation of China (No.41331175). Suggestions from anonymous reviewers are also acknowledged.
REFERENCES
Beard, M. K., Buttenfield, B. P., & Leader, I., 1999. Ncgia research initiative 7 visualization of spatial data quality. European Integration Online Papers, 11(6), pp. 677-686.
Box, G. E. P., 1976. Science and statistics. Journal of the American Statistical Association, 71, pp. 791–99.
Bolliger, J., & Mladenoff, D. J., 2005. Quantifying spatial classification uncertainties of the historical wisconsin landscape (usa). Ecography, 28(2), pp. 141–156.
Brail, R.K., & Klosterman, R.E., 2001. Planning Support Systems, ESRI Press, Redlands, CA.
Brewer, C. A., & Pickle, L., 2002. Evaluation of methods for classifying epidemiological data on choropleth maps in series. Annals of the Association of American Geographers, 92(4), pp. 662-681.
Buttenfield, B. P., 1991. Representing data quality. Cartographica the International Journal for Geographic Information & Geovisualization, 30(2-3), pp. 1-7.
Chang, K. T., 1978. Visual aspects of class intervals in choroplethic mapping. The Cartographic Journal, 15(1), pp. 42-48.
Chen, N., Lin, Z. J., Tang, G. A., & Cheng-Ming, L. I., 2005. Analysis of spatial information uncertainty from dem. Bulletin of Surveying & Mapping, 30(12), pp. 172-176.
Chen, J., Yang, S. T., Li, H. W., Zhang, B., & Lv, J. R., 2013. Research on geographical environment unit division based on the method of natural breaks (jenks). ISPRS - International Archives of the Photogrammetry, Remote Sensing and Spatial Information Sciences, XL-4/W3(4), pp. 47-50.
of Land Utilization. Journal of Fujian teachers university (natural science), 15 (3), pp. 99-104.
Chen, Z. A., Luo, Y. Y., & Zhang, L. T., 2010. Application of fuzzy evaluation model on land suitability in guangchang county. Hubei Agricultural Sciences, 49(5), pp. 1278-1280.
Chrisman, N., 2006. Charting the Unknown: How Computer Mapping at Harvard Became GIS. Esri Press.
Claggett, P. R., Jantz, C. A., Goetz, S. J., & Bisland, C., 2004. Assessing development pressure in the chesapeake bay watershed: an evaluation of two land-use change models. Environmental Monitoring & Assessment, 94(1-3), pp. 129-146.
Collins, M. G., Steiner, F. R., & Rushman, M. J., 2001. Land-use suitability analysis in the united states: historical development and promising technological achievements. Environmental Management, 28(5), pp. 611-621.
Corona, P., Salvati, R., Barbati, A., & Chirici, G., 2008. Land Suitability for Short Rotation Coppices Assessed through Fuzzy Membership Functions. Patterns and Processes in Forest Landscapes, pp. 191-211.
Dent, B. D., 1999. Cartography - thematic map design. Wm.c.brown Publishers.
Devillers, R., Stein, A., Bédard, Y., Chrisman, N., Fisher, P., & Shi, W., 2010. Thirty years of research on spatial data quality: achievements, failures, and opportunities. Transactions in Gis, 14(4), pp. 387–400.
Esri., 2014. Classifying Numerical Fields for Graduated Symbology.
Fan, M., Liu, Y. L., Wu, Y. J., & Yang, X. H., 2008. Ecological Impact Evaluation for Land Consolidation Based on Cloud Model. Geomatics and Information Science of Wuhan University, 33(9), pp. 986-989.
Fisher, W. D., 1958. On grouping for maximum homogeneity. Journal of the American Statistical Association, 53(284), pp. 789-798.
GAO, J., 1997. Resolution and accuracy of terrain representation by grid dems at a micro-scale. International Journal of Geographical Information Science, 11(2), pp. 199-212.
Gao, K., Zhou, Z. X., & Yang, Y. P., 2010. Land use structure and its spatial autocorrelation analysis in the yangtze river basin. Resources & Environment in the Yangtze Basin, pp. 13-20.
Golian, S., Saghafian, B., Sheshangosht, S., & Ghalkhani, H., 2010. Comparison of classification and clustering methods in spatial rainfall pattern recognition at northern iran. Theoretical and Applied Climatology, 102(3), pp. 319-329.
Goodchild, M. F., & Gopal, S., 1989. The Accuracy of Spatial Databases.
Guo, Y., 2002. Comprehensive evaluation theory and method. Science Press.
Harvey, D., 1970. Explanation in geography. Geographical Journal, 136(2), pp. 303.
Hopkins, L., 1977. Methods for generating land suitability maps: a comparative evaluation. Journal for American Institute of Planners, 34 (1), pp. 19 - 29.
Hu, S. Y., Li, D. R., Liu, Y. L., & Li, D. Y., 2006. Determination and integration of subjective weights and objective weights of land grading factors. Geomatics & Information Science of Wuhan University, 31(8), pp. 695-699.
Hu, S. Y., Liu, Y. L., & Li, D. R., 2007a. A research into land evaluation uncertainty. Scientific & Technological Management of Land & Resources, 24(4), pp. 11-15.
Hu, S. Y., Li, D. R., Liu, Y. L., & Li, D. Y., 2007b. Mining Weights of Land Evaluation Factors Based on Cloud Model and Correlation Analysis. Geo-spatial Information Science, 10(3), pp. 423-427.
Hu, Y. M., Xue, Y. J., Li, B., Xie, J. W., Chen, F. X., & Bao, S. T., 2005. Extracting fuzzy rules from neural networks for land evaluation. Transactions of the Chinese Society of Agricultural Engineering, 21(12), pp. 93-97.
Hu, Q. H., Yu, D. R., & Xie, Z. X., 2008. Numerical attribute reduction based on neighborhood granulation and rough approximation. Journal of Software, 19(3), pp. 640−649.
Huang, G. Y., Zhao, Q. M., Li, L. L., & Gao, C. H., 2007. An approach for comprehensive evaluation based on d-s evidential theory. Control & Automation, 23(5), pp. 264-266.
Jenks, G. F., & Caspall, F. C., 1971. Error on choroplethic maps: definition, measurement, reduction. Annals, Association of American Geographers, 61 (2), pp. 217–244.
Jenks, G. F., 1977. Optimal data classification for choropleth maps. Department of Geography Occasional Paper no. 2. Lawrence: University of Kansas.
Jiao, L., 2004. Application of fuzzy neural networks to land suitability evaluation. Editorial Board of Geomatics & Information Science of Wuhan University, 29(6), pp. 513-516.
Jones, W. D., 1930. Ratios and isopleth maps in regional investigation of agricultural land occupance. Annals of the American Association of Geographers, 20(4), pp. 177-195.
Klosterman, R.E., 2001. Planning support systems: a new perspective on computer-aided planning. Planning Support Systems, ESRI Press, Redlands, CA, pp. 1 - 35.
Koo, H., Chun, Y., & Griffith, D. A., 2017. Optimal map classification incorporating uncertainty information. Annals of the American Association of Geographers, DOI: 10.1080/24694452.2016.1261688.
Liu, Y. X., Li, C. Y., Ren, Z. Y., & Wen, W., 2012. Land Eco-sensitivity Assessment Based on LUCC in Ecological City. Research of Soil and Water Conservation, 19(4), pp. 125-130.
Liu, X,. 2005. A research on raster based spatial analysis arithmetic and its programme practice. (Master dissertation, Northwestern University).
Luo, T., 2016. Research of land space comprehensive zoning and optimal exploitation at the Shanglin county level base on multiple-planning integration. (Master dissertation, Guangxi Teachers Education University).
Maceachren, A. M., & Ganter, J. H., 1990. A pattern identification approach to cartographic visualization. Cartographica the International Journal for Geographic Information & Geovisualization, 27, pp. 64-81.
Mak, K. and Coulson, M.R.C., 1991. Map-user response to computer-generated choropleth maps:comparative experiments in classification and symbolization. Cartography and GeographicInformation Science, 18 (2), pp. 109–124.
Malczewski, J., 2004. Gis-based land-use suitability analysis: a critical overview. Progress in Planning, 62(1), pp. 3-65.
Mark S. M., 1974. Measures of pattern complexity for choroplethic maps. Cartography and Geographic Information Science, 1(2), pp. 159-169.
Qiu, B. W., Wang, Q. M., Chen, C. C., & Chi, T. H., 2007. Spatial autocorrelation analysis of multi-scale land use in fujian province. Journal of Natural Resources, 22(2), pp. 311-320.
Ren, J. Q., Wang, J. K., & Kong, F. W., 2012. Coordination evaluation between urban land intensive use and economic &social sustainable development in liaoning province. Journal of Shenyang Agricultural University, 43(1), pp. 39-43.
Robinson, A. H., 1960. Elements of cartography. second edition. Soil Science, 90(2), pp. 147.
Rossiter, D. G., 1996. A theoretical framework for land evaluation. Geoderma, 72(96), pp. 165–190.
Shi, W., 2015. Principles of modeling uncertainties in spatial data and spatial analyses. Science Press.
Slocum, T. A., 2005. Thematic cartography and geographic visualization (Upper Saddle River, NJ: Prentice-Hall).
Smith, M. J. D., Goodchild, M. F., & Longley, P., 2015. Geospatial analysis :a comprehensive guide to principles, techniques and software tools. DBLP.
Tang, G., Zhao, M., Li, T. W., Liu, Y., & Xie, Y., 2003. Modeling slope uncertainty derived from dems in loess plateau. Acta Geographica Sinica, 58(6), pp. 824-830.
Tobler, W.R., 1970. A computer movie simulating urban growth in the Detroit region. EconomicGeography, 46, pp. 234– 240.
Traun, C., & Loidl, M., 2012. Autocorrelation-Based Regioclassification – a self-calibrating classification approach for choropleth maps explicitly considering spatial autocorrelation. International Journal of Geographical Information Science, 26(5), pp. 923-939.
Wang, J., & Du, D. S., 2007. A preliminary discussion on uncertainty of the spatial information presentation by using raster data. Geomatics World, 5(2), pp. 50-54.
Wu, L., Yu, H. L., Gao, Z. B., & Cheng, J. C., 2002. The frame of gis uncertainty and methods of gis data uncertainty. Geography & Territorial Research, 18(4), pp. 1-5.
Xiao, N., Calder, C., Armstrong, M., 2007. Assessing the effect of attribute uncertainty on the robustness of choropleth map classification, International Journal of Geographical Information Science, 21(2), pp. 121-144.
Xie, H., Liu, L., Bo, L. I., & Zhang, X., 2006. Spatial autocorrelation analysis of multi-scale land-use changes:a case study in ongniud banner, inner mongolia. Acta Geographica Sinica, 61(4), pp. 389-400.
Yu Jia., 2010. The research and realization of the land-use suitability assessment model based on artificial intelligence. (Doctoral dissertation, East China Normal University).
Zhang, X., Huang, H. Z., & Xu, H., 2010. Multidisciplinary design optimization with discrete and continuous variables of various uncertainties. Structural & Multidisciplinary Optimization, 42(4), pp. 605-618.
Zhang, X., Huang, H. Z., & Xu, H., 2010. Multidisciplinary design optimization with discrete and continuous variables of various uncertainties. Structural & Multidisciplinary Optimization, 42(4), pp. 605-618.
Zhang, J. & Goodchild, M. F., 2002. Uncertainty in Geographical Information (London:Taylor & Francis).
Zhou, J. F., Zeng, G. M., Huang, G. H., Li, Z. W., & Tang, L., 2007. The ecological suitability evaluation on urban expansion land based on uncertainties. Acta Ecologica Sinica, 27(2), pp. 0774-0783.
Zhou, Q. G., Zhang, X. Y., & Wang, Z. L., 2014. Land use ecological risk evaluation in Three Gorges Reservoir Area based on normal cloud model. Transactions of the Chinese Society of Agricultural Engineering, 30(23), pp. 289-297.