GEOMETRIC CORRECTION OF AIRBORNE LINEAR ARRAY IMAGE
BASED ON BIAS MATRIX
M. Wang, J. Hu, M. zhou, J.M. Li, Z. Zhang
Key Laboratory of Quantitative Remote Sensing Information Technology, Academy of Opto-Electronics, Chinese Academy of Sciences, Beijing, China
(mwang, jhu, zhoumei, jmli, zhangzheng)@aoe.ac.cn
Commission VI, WG VI/4
KEY WORDS: Linear Array Image, Geometric Correction,Bias Matrix, Airborne, Misalignment
ABSTRACT:
As the linear array sensor has great potential in disaster monitoring, geological survey, the quality of the image geometric correction should be guaranteed. The primary focus of this paper is to present a new method correcting airbone linear image based on the bias matrix,which is bulit by describing and analysing the errors of airbone linear image included the misalignment. The bias matrix was considered as additional observations to the traditional geometric correction model in our method. And by using control points which have both image coordinate and object coordinate, the solving equation from geometric correction model can be established and the bias matrix can be calculated by adjustment strategy. To avoid the singularity problem in the calculating process, this paper uses quaternion to describe the image's attitude and rotation instead of traditional calculating method which is structured by the Euler angle. Finally, geometric correction of airborne linear array image with high accuracy based on bias matrix can be achieved.
1. INTRODUCTION
Based on ground mission requirements, linear array sensor can obtain a wide range of continuous observation images over the vertical heading direction, and the hyperspectral data can also access, hence it starts to be applied in disaster monitoring, geological survey, battlefield surveillance, target reconnaissance and other areas.
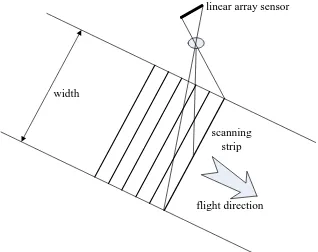
Linear array push broom sensors often obtain an image line by line with the time sequence. Each line of the image is shot at the same moment with a central projection, so each image line has its own exterior orientation and the whole image data is multi-central projected. Usually, with the position and attitude data from the POS system (GPS/IMU) carried on an airborne platform, the geometric correction of linear array images can be achieved by the traditional collinearity equations.
flight direction width
linear array sensor
scanning strip
Figure 1. linear array image acquisition diagram However, for the installation limitation of hardware, the tri-axial of the sensor’s coordinate system can’t be accurately parallel with those of the IMU coordinate system which causes the Misalignment problem, resulting in that each image line observation to be registered with an incorrect attitude. Because the misalignment errors can be modeling by a function of flight height, scan angle and flight direction, it will increase with the
increasing of flight height and topographic inequality, which finally affects the accuracy of image geometric correction, especially in the terrain fluctuation area. As the tri-axial of sensor and IMU are not visible, it’s hard to measure the angle of misalignment by instrument. Meanwhile different from the area array sensor or the three-linear array sensor like ADS40, there are no geometric constraints among each scan linein the linear array image, each line is independently acquired with a different exterior orientation, so a classic bundle adjustment is not realistic, owing to the huge number of unknowns . Aim at the misalignment error in the airborne linear array image, this paper presents a geometric correction method which can be used to correct the linear array image based on the bias matrix.
2. CORRECTION METHOD
2.1 The Misalignment Error Effect Analysis
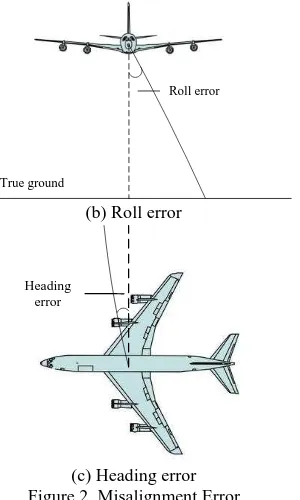
The misalignment error could be divided into there parts: the pitch, the roll and the heading error.
True ground
Pitch error
(a) Pitch error
International Archives of the Photogrammetry, Remote Sensing and Spatial Information Sciences, Volume XL-1/W1, ISPRS Hannover Workshop 2013, 21 – 24 May 2013, Hannover, Germany
True ground Figure 2. Misalignment Error
The pitch error will cause the forward and backward deviation of sensor position relative to the design of sensor imaging, resulting in the forward and backward translational motion occur in the image data; Similarly, the roll error will cause the translational motion in the image data, left and right; the heading error may cause image data rotating on the design imaging surface with a certain angle.
2.2 Imaging Model and Solving Model Establishing
The rigorous imaging model of the line array image is
0
X Y Z
is the position parameters from GPS,( 0, 0,
x y
f)
Tis the inner orientation elements of the sensor,
(
dx dy,
)
Tis the image coordinate distortion,(
X,
Y,
Z)
T is the lever arm,R
sm is the bias matrix,R
cs is the exterior orientation elements,
is the scale factor.But considering variables involved in the imaging model , have cross-correlation between themself, Equation (1) could be simplified as follow:
Then it can be transformed into:
1 function can be formed as
RM
M
'. Finally,by mathematical methods R can be calculated.2.3 Processing Flow
(2) For coordinate system inconsistency,the attitude angles given by IMU,which are different from those of the aerial photogrammetry coordinate system, can’t directly use as the exterior orientation elements. The second step is to transform the IMU angle
(
)
into the photogrammetry angle(
)
. The coordinate conversion process of IMU data is the image coordinate system to the sensor coordinate system to the IMU coordinate system to the navigation coordinate system to the geocentric coordinate system and finally to the mapping coordinate system;(3) Then the Equation(3) can be established, the input parameters of which include the inner orientation elements, the transformed exterior orientation elements and position parameters providing by POS, and the pair coordinates of control points. The result of the equation is the bias matrix translating from the sensor coordinate system to the IMU coordinate system;
(4) With several simultaneous control point equations, the bias matrix can be calculated by adjustment strategy. To avoid the singularity problem in the calculating process, this paper introduces quaternion to describe the image’s attitude and rotation instead of using the traditional euler angle. Finally, geometric correction of airborne linear array image based on bias matrix can be achieved with high accuracy.
Lay Control Points within the Survey Area
Measure (X,Y,Z) & (x,y) Transform the IMU Angle into the Photogrammetry Angle
Build the Solving Equation
Calculate the Equation by Quaternion
Rigorous Imaging Model Bias Matrix
Figure 3. Processing Flow Chart
International Archives of the Photogrammetry, Remote Sensing and Spatial Information Sciences, Volume XL-1/W1, ISPRS Hannover Workshop 2013, 21 – 24 May 2013, Hannover, Germany
2.4 The Quaternion Solution
The quaternion is the useful element in the four-dimensional space, which defines a non-commutative multiplication, i.e., a quaternion q can be considered as a four-dimensional vector, multiplication of two quaternions is defined as:
' ' ' ' ' ' appropriate R with minimum constraints:
2 2
the method of Lagrange factor,the minimization problems solutions can be written as:
(
q Aq
T(1
q q
T))
0
Then we can construct the quaternion rotation matrix with the eigenvector,which is the final bias matrix.3. EXPERIMENTS
To validate efficiency of the method proposed,an experiment was carried out on the images acquired by a linear array sensor developed by the Academy of Opto-Electronics (AOE) on reason why the geometric correction must be carried out. Figure 4(b) is the result image after geometric correction, Contrast
Figure(a) and (b), it’s easy to find out the algorithm effect is
very obvious, distortions on the raw image is well improved, stretched or compressed place also get the better correction, our method could achieve better correction results than the traditonal methods in both roads, buildings, farmland and etc.
(a) raw image
International Archives of the Photogrammetry, Remote Sensing and Spatial Information Sciences, Volume XL-1/W1, ISPRS Hannover Workshop 2013, 21 – 24 May 2013, Hannover, Germany
(b) image after geometric correction Figure 4. Geometric correction result
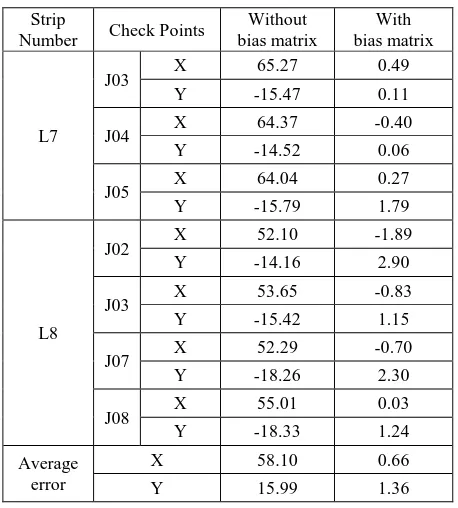
Precision evaluation is also taken by check points.The evaluation results are shown in Table 1:
Strip
Number Check Points
Without bias matrix
With bias matrix
L7
J03 X 65.27 0.49
Y -15.47 0.11
J04 X 64.37 -0.40
Y -14.52 0.06
J05 X 64.04 0.27
Y -15.79 1.79
L8
J02 X 52.10 -1.89
Y -14.16 2.90
J03 X 53.65 -0.83
Y -15.42 1.15
J07 X 52.29 -0.70
Y -18.26 2.30
J08 X 55.01 0.03
Y -18.33 1.24
Average error
X 58.10 0.66
Y 15.99 1.36
Table 1. Evaluation results (Unit: m)
From Table 1,we can see that before bias matrix were taken, the average error of X direction is 58.10m, and Y direction is 1.36m, while after bias matrix process flow has been done, the average error of X direction is 0.66m, and Y direction is 1.36m.The improvement in the direction precision,which is improved by more than ten times, which make that is obvious, the bias matrix could compensate the system error effectively,and the orientation accuracy of final image could reach meter level.
4. CONCLUSIONS
At present, limited by the serious distortion of the image and the immature of rigid geometric correction technology, the application of the linear array image is not widely. As the request for multispectral and hyperspectral data in areas like environment monitoring is increased, linear array sensor is leading the development trend of remote sensing. The experimental results indicate that the proposed correction method, which is based on the bias matrix, can be effectively applied in the geometric correction of linear array images. To further improve the geometric correction accuracy, the calibration method for the linear array sensor is still supposed to be researched based on more fine-grained bias matrix.
REFERENCE
Lee, C. , Theiss, H.J. , Bethel, S.J., and Mikhail, M.E., 2000. Rigorous mathematical modeling of airborne pushbroom imaging systems. Photogrammetric Engineering & Remote Sensing Journal of the American Society for Photogrammetry and Remote Sensing, Vol.66.
Bethel, J.S., Lee, C., and Landgrebe D.A., 2000. Geometric registration and classification of hyperspectral airborne pushbroom data. ISPRS,pp.567-571.
Li, D. and Wang, D.H., 2007. Efficient Ortho Image Generation from ADS40 Level 0 Products. Journal of Remote Sensing, Vol.11, pp.247-251.
Zhu, X.Y., Zhang G., and Tang X.M., 2009. Research and Application of CBRS02B Image Geometric Exterior Calibration. Geography and Geo-Information Science, Vol.25, pp.16-27.
International Archives of the Photogrammetry, Remote Sensing and Spatial Information Sciences, Volume XL-1/W1, ISPRS Hannover Workshop 2013, 21 – 24 May 2013, Hannover, Germany