ii
CERTIFICATION OF APPROVAL
Study on the Flow Dynamics of Nitrogen and Hydrogen Gasses Subjected to Wires Element in Monolithic Microchannel
by
Nur Amirah Binti Mohamed Rashidi 15570
A project dissertation submitted to the Chemical Engineering Programme Universiti Teknologi PETRONAS in partial fulfilment of the requirement for the
BACHELOR OF ENGINEERING (Hons) (CHEMICAL ENGINEERING)
Approved by,
___________________
(Mohd Zamri Abdullah)
UNIVERSITI TEKNOLOGI PETRONAS BANDAR SERI ISKANDAR, PERAK
September 2015
iii
CERTIFICATION OF ORIGINALITY
This is to certify that I am responsible for the work submitted in this project, that the original work is my own except as specified in the references and acknowledgements, and that the original work contained herein have not been undertaken or done by unspecified sources or persons.
_______________________________________
NUR AMIRAH BINTI MOHAMED RASHIDI
iv ABSTRACT
The former method to produce ammonia (NH3) was not sustainable and unenvironmentally friendly since the process required high energy consumption as well as high operating condition. The advanced of technology for the past few decades have enabled the production of NH3 to occur in the ambient condition. The technique to achieve high yield of NH3 is illustrated under nanotechnology and the Magnetic Induction Method (MIM) where induced magnetic fields polarizes the hydrogen (H2) and nitrogen (N2) gasses in the monolithic microchannel to allow the synthesis of NH3. Previous study showed that chaotic advection was successfully induced when wires are arranged axially in different manners along the microreactor.
Hence to further enhance the rate of reaction, design of the monolithic microchannel is improved. Therefore, wires elements with different configurations are introduced in this research where they are arranged in 300 and 900 pitch with different distance and number of wires in the monolithic microchannel to analyse the flow dynamic of H2 and N2. This simulation investigated the result of mixing index with effect of distance between centre of wires, effect of number of wires and effect of wire pitch with the production of ammonia. Based on the result obtained, the square pitch geometry with 13 wires is perceived to produce the most effective dynamic mixing.
The development and design of the five monolithic microchannels are prepared via a computational fluid dynamics (CFD) approach using the software ANSYS 15.0 coupled with CFX module.
v
ACKNOWLEDGEMENT
First and foremost, I am very grateful to Almighty Allah for giving me strength and ability to understand, learn and complete this research throughout these 8 tough months.
I would like to express highest appreciation to my family members especially both of my parents, Noraini @ Sariah binti Kadir and Mohamed Rashidi bin Shafie for giving me a lot of moral support and advice. I would also like to take this opportunity to extend my appreciation towards all other individuals, my siblings, both friends and cliques that have cheered and helped me during the development of this project.
Furthermore, I wanted to express special thanks to my supervisor, Mr Zamri Abdullah and Mr Salman Kashif for their dedication and guidance in assisting me and lead me to produce a better project. Without their help, I may not be able to finish this project. I also appreciate OneBAJA which is a long term grant scheme by Ministry of Education led by UTP’s professors and researchers that have been contributing funds to this project.
Not to forget, I would like to convey my gratefulness to Univesiti Teknologi PETRONAS (UTP) for providing me the platform and facilities for my report completion and knowledge regarding this project. Without the support from UTP, this project would not have been successful and brought me invaluable experience.
vi
TABLE OF CONTENTS
CERTIFICATION OF APPROVAL ii
CERTIFICATION OF ORIGINALITY iii
ABSTRACT iv
ACKNOWLEDGEMENT v
TABLE OF CONTENTS vi
LIST OF ABBREVIATIONS vii
LIST OF FIGURES viii
LIST OF TABLES viii
CHAPTER 1: INTRODUCTION 1
1.1 Background of Study 1
1.2 Problem Statement 5
1.3 Objective 6
1.4 Scope of Study 6
CHAPTER 2: LITERATURE REVIEW 7
2.1 Literature Review and Theory 7
2.2 Physical Properties of Nitrogen and Hydrogen 11
CHAPTER 3: METHODOLOGY 12
3.1 Simulation Methodology 12
3.2 Geometry and Meshing Development 13
3.3 Physics Properties Setup 17
3.4 Methodology Analysis 18
CHAPTER 4: RESULTS AND DISCUSSIONS 21
4.1 Results 21
4.2 Discussions 22
4.2.1 Effect of Distance between Centres of Wires 23 4.2.2 Effect of Number of Wires 27
4.2.3 Effect of Wire Pitch 31
CHAPTER 5: CONCLUSION AND RECOMMENDATIONS 36
5.1 Conclusion 36
5.2 Recommendation 37
REFERENCES 38
APPENDICES 41
vii LIST OF ABBREVIATIONS
t diffusion time of molecules L square of the channel width D diffusion coefficient of a molecule Re Reynolds number
ρ density (kg/m3) V velocity (m/s)
D diameter of cylinder (m) μ fluid viscosity (kg/ms) n number of chemical species
ρn density of each of the component (kg/m3) Vn volume of each component
n number of chemical species xi, xj mole fractions of two species
μi, μj viscosities of two species at specified temperature Mi, Mj molecular weight of two species in g/mol
A subtraction of cross sectional area and total area of void area (m2) P wetted perimeter area (m)
ρmix density of mixture (kg/m3) DH hydraulic diameter (m)
μmix viscosity of the mixture (kg/ms)
variance
Ci mass fraction at sampling point i Cm optimal mixing mass fraction N number of sampling points M mixing index
max maximum variance
viii LIST OF FIGURES
Figure 1.1 Ammonia Usage in Industry 2
Figure 1.2 Haber - Bosch Process 2
Figure 1.3 Microreactor with a Channel Diameter of 5-mm 3
Figure 1.4 Magnetic Induction Method 3
Figure 1.5 New Version of Magnetic Induction Method 4 Figure 1.6 Radial View of Wires Arrangement in Monolithic Microchannel 5
Figure 3.1 Flow of Simulation Methodology 12
Figure 3.2 Location of Planes
Figure 3.3 Mixing Index of Design 1 for Fine, Medium and Coarse Meshing 16
Figure 4.1 Mixing Index of Geometries 35
LIST OF TABLES
Table 2.1 Previous Studies on Microchannel in Microreactor 10 Table 2.2 Physical Properties of Nitrogen and Hydrogen 11
Table 3.1 Velocity Determination 14
Table 3.2 Geometry of Monolithic Microchannels 15
Table 3.3 Flow Parameters Setup 17
Table 4.1 Velocity Contours for N2 Flow in XY-axis 23 Table 4.2 Velocity Contours for H2 Flow in XY-axis 24
Table 4.3 Volume Fraction Contours for N2 Flow 25
Table 4.4 Volume Fraction Contours for H2 Flow 25
Table 4.5 Velocity Contours at Centreline in YZ-axis 26
Table 4.6 Streamline Velocity of N2 and H2 27
Table 4.7 Velocity Contours for N2 Flow in XY-axis 28 Table 4.8 Velocity Contours for H2 Flow in XY-axis 28
Table 4.9 Volume Fraction Contours for N2 Flow 29
Table 4.10 Volume Fraction Contours for H2 Flow 29
Table 4.11 Velocity Contours at Centreline in YZ-axis 30
Table 4.12 Streamline Velocity of N2 and H2 30
Table 4.13 Velocity Contours for N2 Flow in XY-axis 31 Table 4.14 Velocity Contours for H2 Flow in XY-axis 31
ix
Table 4.15 Volume Fraction Contours for N2 Flow 32
Table 4.16 Volume Fraction Contours for H2 Flow 32
Table 4.17 Velocity Contours at Centreline in YZ-axis 33
Table 4.18 Streamline Velocity of N2 and H2 33
Table 6.1 Data of Design 1 for Mixing Index 34
Table 6.2 Data of Design 2 for Mixing Index 41
Table 6.3 Data of Design 3 for Mixing Index 41
Table 6.4 Data of Design 4 for Mixing Index 42
Table 6.5 Data of Design 5 for Mixing Index 42
Table 6.6 Data of Design 1 with Fine Mesh for Mixing Index 43 Table 6.7 Data of Design 1 with Medium Mesh for Mixing Index 43
1
CHAPTER 1 INTRODUCTION
1.1 Background of Study
Ammonia (NH3) is a chemical compound which consists of three atoms of hydrogen (H2) and one atom of nitrogen (N2). This gas substance is known universally in industrial for the various application as an additive such as explosives, detergent and fertilizer industry, chemicals, fibres and plastics, refrigeration, pharmaceutical, pulp and paper and mining and metallurgy [1]. A high percentage of 80% approximately, from the total production of this chemical substance has been applied in synthetic fertilizer, therefore causing a great market demand in the industry business. Consumption of fertilizer increased significantly in 2010 and is expected to grow in a stabilized way during the following years of the forecast period. World demand for total fertilizer is estimated to grow at 2.0 percent per annum from 2011 to 2015 [2].
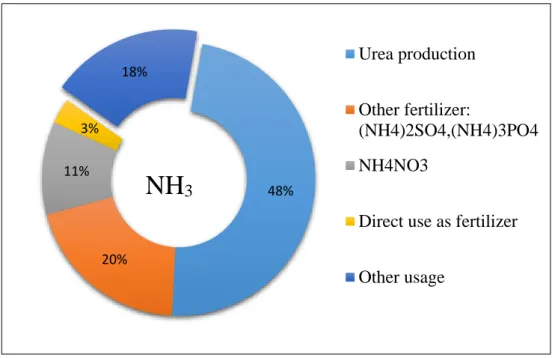
Precisely, 48% of the NH3 produced is deployed in the production of urea (the most commonly used nitrogen fertiliser and basic feedstock for industrial products like plastics, resins and adhesive) while 11% is employed in the production of ammonium nitrate. Production of other fertilisers like ammonium sulfate, ammonium phosphate, diammonium phosphate and monoammonium phosphate contribute about 20% of the ammonia consumption in the fertilizer industry and lastly 3% is directly used as fertiliser.
2
FIGURE 1.1 Ammonia Usage in Industry
Regrettably, the current production is only capable to generate 10-20% of NH3 yields with capital and energy intensive [3]. This process of producing NH3
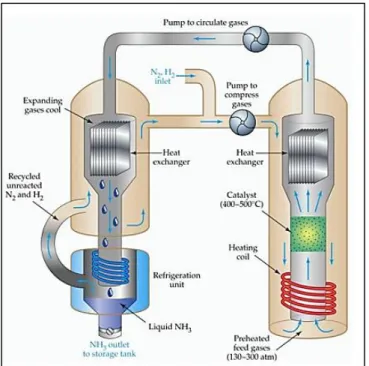
which is known as Haber-Bosch process obliges to operate under a high operating condition temperature (400 – 5000C) and pressure (130 – 300 atm) where such circumstances possess a very careful handling as well as increasing the hazards to the operators and the plant facilities which lead to the high energy consumption.
FIGURE 1.2 Haber - Bosch Process
48%
20%
11%
3%
18%
Urea production Other fertilizer:
(NH4)2SO4,(NH4)3PO4 NH4NO3
Direct use as fertilizer Other usage
NH
33
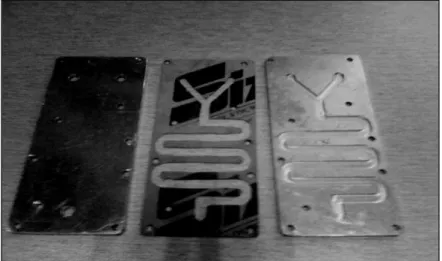
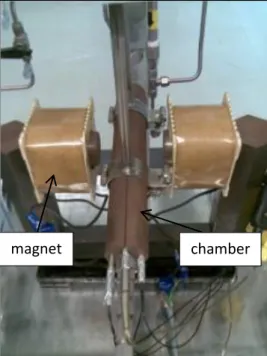
In order to overcome these drawbacks, researches discovers new promising method to attain the high yield of NH3 at ambient condition (at 25°C and 1atm), under the Magnetic Induction Method (MIM) in a microfluidic environment by applying six pairs of Helmholtz coils. The preliminary synthesis of NH3 using this proposed method was previously proven at laboratory scale in which a microreactor containing Mn-based ferrite catalyst under the magnetic induction zone was able to yield 24.8% NH3 [4].
FIGURE 1.3 Microreactor with a Channel Diameter of 5-mm
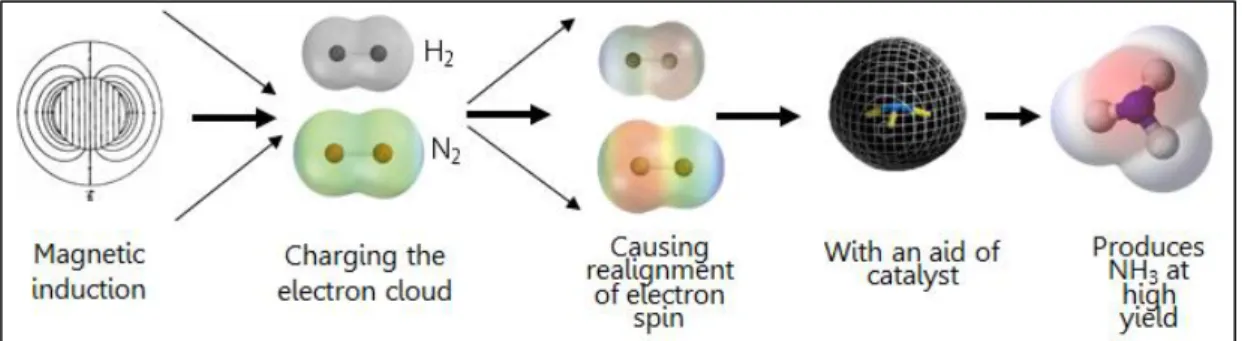
This NH3 synthesis works by charging the electron cloud of hydrogen and nitrogen atoms by magnetic induction as the first step. It is proven that the higher the applied magnetic field is, the more effective the catalytic activity will be as a better alignment of the electron spin of the catalyst (usually catalyst used is iron (III) oxide, Fe2O3) occurs and enhances the adsorption and desorption process. By this new route, synthesis of ammonia at low temperature is realized and offers NH3 producers an economic advantage compared to the classical routes [5].
FIGURE 1.4 Magnetic Induction Method
4
NH3 synthesis has been successfully achieved. The yield was 76% increasing by using the new version of magnetic induction method. The optimum condition in this system is using Mn0.8Zn0.2Fe2O4 and Y3Fe5O12 as nanocatalysts while the room temperature is at 280C and ambient pressure is at 1.01 bar. The magnetic field strength used to attain the high production of NH3 is 1 tesla [4].
FIGURE 1.5 New Version of Magnetic Induction Method
This project also utilised the magnetic induction method with the addition of wires element into the monolithic microchannel to further enhance the rate of reaction of NH3. Using wires element in monolithic microchannel is seen as an alternative to improvise the efficiency of NH3 production by exposing the raw materials, hydrogen and nitrogen to high surface area to volume ratio. Due to their small volume, fast changes of operating conditions can be performed in minimal time demand to reach equilibrium state [6]. This project studied the effect of various geometries of wires in monolithic microchannel and possibility of prevalent gases mixing.
magnet chamber
5 1.2 Problem Statement
In the former project report, the monolithic microchannel consist of varies design with different geometry, mesh and setup applied. The best applicable one is the design consisting of 13 monolithic microchannel that attain the most optimum mixing of H2 and N2 arranged as given in the illustration below. In the MIM, wire placement inside the microchannel that contains catalyst does not induce turbulence.
Previous study shows that arrangement of wires in square pitch configuration would affect flow dynamics. However, with square pitch arrangement, less mixing occur because of low hydraulic diameter. The dynamic flows of both gases are observed to maintain its homogeneousness at almost the entire length of the monolithic microchannel. Parameters such as temperature and pressure of the gases are maintained throughout the design. Several arrangement and configuration is constructed in order to investigate the effect of using wires element for the ammonia synthesis. At the end of this project, we could determine whether the mixing has improved with the presence of wires in the monolithic microchannel.
FIGURE 1.6 Radial View of Wires Arrangement in Monolithic Microchannel
6 1.3 Objectives
This project aims to design a monolithic microchannel that uses wires element as obstructions and support for catalyst that will create greater micromixing dynamics for N2 and H2 gases. This project will also identify arrangements along the monolithic microchannel for the wires in order to increase the efficiency of ammonia productions. Results will be processed in forms of chart, contour plots and profiles.
1.4 Scope of Study
This project will focus on the study of flow regime and the characteristics of H2 and N2 gases through 30° and 90° wires pitch with different distance of centre between the wires that is parallel to the flow. Number of wires element proposed in the monolithic microchannel are 19 wires for three design and 13 wires for two design respectively. Simulation will be done using ANSYS CFX 15.0 software.
Typical methodology in CFD applies such as creation of geometry, development of mesh, and post-solver analysis. Despite the project emphasizes on the ‘synthesis of ammonia’, only flow dynamics without the reaction element will be simulated. It is desirable to create a micro geometry that will generate a great flow for the mixing.
7
CHAPTER 2
LITERATURE REVIEW
2.1 Literature Review and Theory
The problem of difficulties to synthesis ammonia on an industrial scale had been solved by German scientists Fritz Haber and Carl Bosch whom discovered new alternative way to convert nonreactive atmospheric nitrogen to ammonia at the early of ninetieth century. Currently, the Haber-Bosch process is used to produce about 100Tg of reactive nitrogen per year worldwide where most of the substances are used for nitrogen fertilizer manufacturing. Food grown with this fertilizer feeds approximately 2 billion people [7]. Haber-Bosch process shown in equation 1 describes the conversion process from nitrogen (N2) and hydrogen (H2) gases to ammonia (NH3).
𝑁2(𝑔) + 3𝐻2 (𝑔) ⇆ 2𝑁𝐻3 (𝑔) (1)
However, this process involves high pressure and temperature as well as the presence of an iron catalyst which is extensively an energy-consuming process. Iron catalyst such as Fe3O4 and Fe2O3 in Haber - Bosch process requires high temperatures between 400oC to 500oC for efficient catalyst usage. Ammonia production can be entropically enhanced with elevated gas pressure between 130 and 300 atm [5]. Despite the lower conversion and yield (10-20%), the Haber–Bosch process imposes a costly method to produce ammonia because the pressure of the system has significant economic costs as pressure is an expensive commodity.
Besides that, the high temperature in the reactor is occurred due to the highly exothermic energy release from the reaction.
8
In fact, ammonia production is responsible for about 17% of the energy consumed in the chemical and petrochemical sector. In 2004, the ammonia manufacturing industry consumed 5.6 EJ of fossil fuels, of which 2.7 EJ was for energy and 2.9 EJ for feedstock use [8]. Due to this reason, the reactor is typically an isothermal reactor to ensure that the temperature does not go beyond dangerous level.
Since it is operated in high operating conditions, greater safety measurement and control regulation have to be considered while performing this process.
After discovery of the Haber-Bosch process, various processing techniques including conventional and nonconventional have been developed to further improve the conditions which focuses to convert high temperature and pressure to ambient temperature and pressure and process to accommodate certain needs and simplicity of the industry nowadays. One of the alternatives is ammonia synthesis by electrochemical and biological approach. This research designed and tested a bio- electrochemical device that generates NH3 through electrode induced enzyme catalysis. The ammonia creating device comprises of an electrode modified with a polymer that contains whole cell Anabaena variabilis, a photosynthetic cyanobacterium. A. variabilis contains nitrogenase and nitrate (NO3-)/nitrite (NO2-) reductase, catalysts for the production of ammonia. In this system, the electrode supplies driving force and generate a reductive microenvironment near cells to facilitate enzymatic production of NH3 at ambient temperatures and pressures [9].
However, the efficiency of the bioelectrocatalytic device as compared to the efficiency of unaltered cyanobacteria in nature has not been calculated or estimated.
At the same time, more new processes have been developed recently for efficient production of ammonia as the demand of it increases throughout the years.
In one particular research, the use of Magnetic Induction Method (MIM) and Helmholtz coils were used to generate the electromagnetic waves [4]. Besides that, MIM has an advantage because it is able to yield high production of Ammonia while operating under ambient conditions where the temperature and pressure is respectively at 25°C and 1atm. This method also uses micro reactors to improve the efficiency of the production.
9
As the technology in chemicals industries evolve, the usage of micro reactor proven to be more effective than normal size reactors. Micromachining technologies are being applied to the design of miniature devices for chemical synthetic applications such as microreactor. A microreactor is equipment that has microchannel, which in this project is known as monolithic microchannel on the order of micrometers and that enables chemical reactions to be performed in reaction space several orders of magnitude smaller than conventional batch reactor [10]. The downscaling of devices has brought attractive features to microreactors such as equipment installation time has been reduced as well as it higher yields achievement and product quality improvement.
Mixing is hardly achieved in microsystem without modification of geometry.
Mixing plays a significant role to increase the conversion of N2 and H2 to form NH3. Mainly the importance is to reduce inhomogeneity that leads to secondary effects such as reaction and change in properties [11, 12]. Furthermore, great flow dynamic is preferred in a channel if intimate mixing is desired between two streams [13].
Thus, one of the main purposes of using this device is the mixing efficiency varies accordingly to the different geometry of wires arrangement. This mixing performance can be explained in equation 2 known as mixing index relationship.
𝑡 ∝ 𝐿𝐷2 (2)
where,
t = diffusion time of molecules L = square of the channel width D = diffusion coefficient of a molecule
Thus, following the equation above, t is to proportional to L. To elaborate more, when L is reduced to 1/10, the diffusion time is reduced to 1/100 and the fluids, in this case are hydrogen and nitrogen gasses can be mixed 100 times faster.
10
Other than that continuous flow in microreactors enables reaction processes to be monitored, controlled, analysed and intermediate storage to be reduced. Hence, the hazards and process safety risks may be reduced since the quantity of substances in the microreactor is much more less. Furthermore, the product profile improvement can be observed and using microreactor also creates constant product output quality [10].
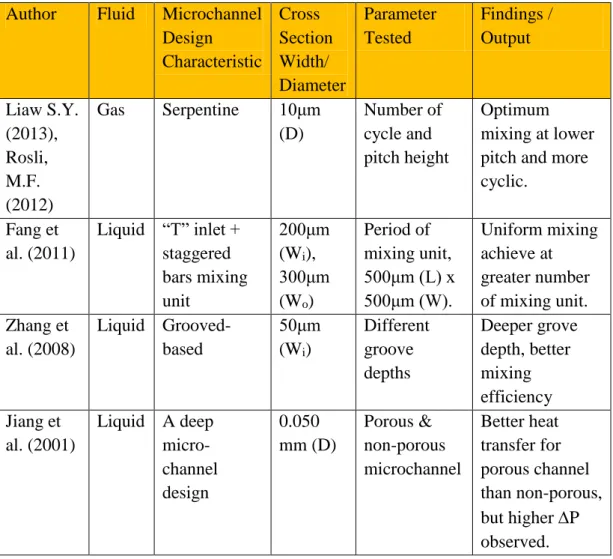
As microreactor provides huge advantages to the output product, numerous researchers are interested to further investigate about microreactor and create variety of studies using different type of fluid flowing in the microchannel as well as using different design characteristic such as serpentine and grooved-based. The researchers explore new parameter that will produce their own findings and output with the different cross section of the microchannel.
TABLE 2.1 Previous Studies on Microchannel in Microreactor Author Fluid Microchannel
Design Characteristic
Cross Section Width/
Diameter
Parameter Tested
Findings / Output
Liaw S.Y.
(2013), Rosli, M.F.
(2012)
Gas Serpentine 10μm (D)
Number of cycle and pitch height
Optimum mixing at lower pitch and more cyclic.
Fang et al. (2011)
Liquid “T” inlet + staggered bars mixing unit
200μm (Wi), 300μm (Wo)
Period of mixing unit, 500μm (L) x 500μm (W).
Uniform mixing achieve at greater number of mixing unit.
Zhang et al. (2008)
Liquid Grooved- based
50μm (Wi)
Different groove depths
Deeper grove depth, better mixing efficiency Jiang et
al. (2001)
Liquid A deep micro- channel design
0.050 mm (D)
Porous &
non-porous microchannel
Better heat transfer for porous channel than non-porous, but higher P observed.
11
As the project is developed under micro environment, the Reynolds number obtained is low and contributes to laminar flows in the microchannel. Hence, the mixing of the two gasses is controlled by molecular diffusion which means longer time and length of the channel is necessary that leads to high cost and pressure drop [14]. To avoid this from happening, this project signifies the usage of MIM in the development of the monolithic microchannel to obtain efficient and active mixing even at low Reynolds numbers.
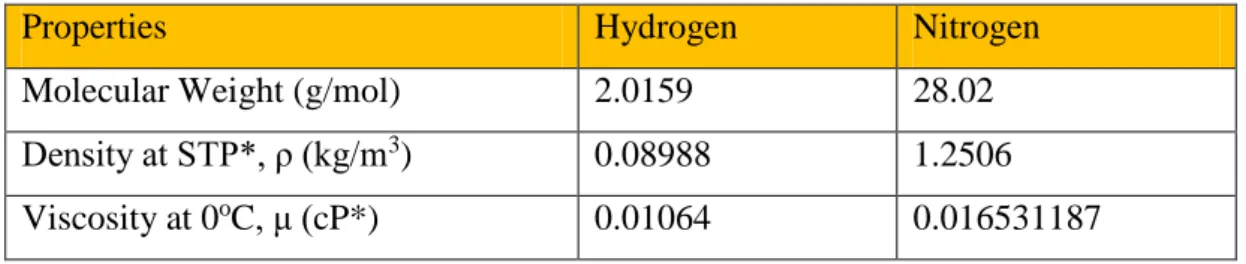
2.2 Physical Properties of Nitrogen and Hydrogen
The main components used in this project which are hydrogen gas (H2) and nitrogen gas (N2) comprises of different physical properties. By identifying several properties, the Reynolds number for the mixture is determined easily.
TABLE 2.2 Physical Properties of Nitrogen and Hydrogen
Properties Hydrogen Nitrogen
Molecular Weight (g/mol) 2.0159 28.02
Density at STP*, ρ (kg/m3) 0.08988 1.2506 Viscosity at 0oC, μ (cP*) 0.01064 0.016531187
*STP - Standard Temperature and Pressure - is defined as 0oC and 1 atm
*1 cP (Centipoise) = 10-3 Pa s
12
CHAPTER 3 METHODOLOGY
3.1 Simulation Methodology
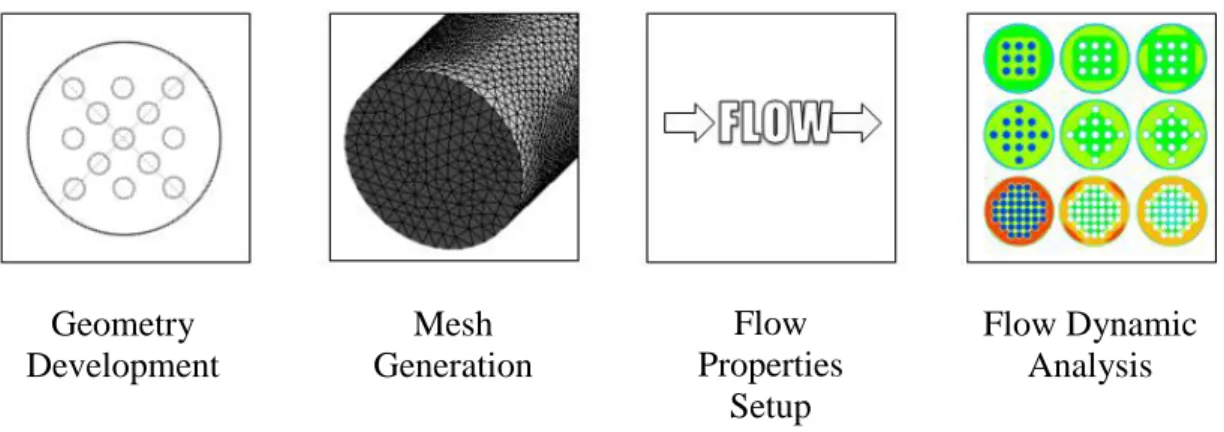
To proceed with the methodology, the flow of simulation methodology is determined. Fluid Flow (CFX) Design Modeller is used to develop five geometry designs in millimetre unit. Then, the simulation proceeded to mesh generation where the meshing were created with different relevance centre which are fine, medium and coarse via Meshing. In this stage, minimum and maximum size of the meshing is inputted accordingly and nodes, elements and orthogonal quality statistics were ensured not to exceed the limit. The flow properties is set up via CFX-PRE were the inlet, outlet and wall were defined as domain. The value of volume fraction of nitrogen and hydrogen gasses and pressure are constant for all geometry while the velocity of gas flow were differ for 13 wires and 19 wires design. CFX-SOLVER calculated volume fraction, momentum and mass for the geometry using the Navier- Stokes equation. Finally, flow dynamic analysis can be performed in the form of contour plots, profiles and mixing index with the help of CFX-POST.
FIGURE 3.1 Flow of Simulation Methodology Geometry
Development
Mesh Generation
Flow Dynamic Analysis Flow
Properties Setup
13 3.2 Geometry and Meshing Development
Five designs were developed in this project and the flow dynamics of the nitrogen and hydrogen gasses will be observed and recorded. Basically, the monolithic microchannel will be designed in cylindrical manner where the wires will be arranged according to the wire layout of 30°. Even though it is called 30o triangular pitch, the inner angle for the triangle is 60°. It is also known as equilateral triangle. While one of the geometry design will be in 90° square pitch to compare the result with previous studies. As it is arranged in parallel order, there is no intersection of wires and no change in wires path. The microchannel has a dimension of 10 mm in diameter and the length of the channel has been determined which is 50 mm while the diameters of the wires are 1 mm. The wires assembly started at a distance on 3 mm from the inlet and ended 3 mm before the outlet as a mean to induce pre-mixing upon flowing inside.mm length located at the centre of microchannel which are constant for all five design. The wires are arranged parallel to the microchannel with different distance between the centres of the wires, different number of wires and different pitch aimed to create higher mixing efficiency.
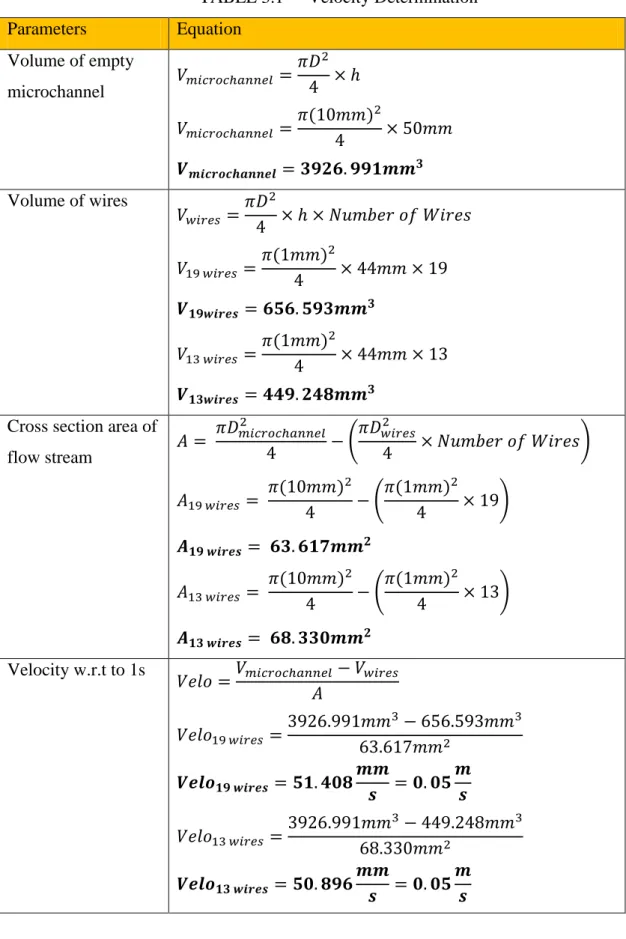
An initial velocity before facing the obstacles is expected to result in better dynamic mixing. In order to calculate velocity of the flow stream with respect to 1s, these parameters is determined in advance:
1. Volume of empty microchannel 2. Volume of wires
3. Cross section area of flow stream 4. Number of wires
14
TABLE 3.1 Velocity Determination
Parameters Equation
Volume of empty
microchannel 𝑉𝑚𝑖𝑐𝑟𝑜𝑐ℎ𝑎𝑛𝑛𝑒𝑙 = 𝜋𝐷2 4 × ℎ 𝑉𝑚𝑖𝑐𝑟𝑜𝑐ℎ𝑎𝑛𝑛𝑒𝑙 = 𝜋(10𝑚𝑚)2
4 × 50𝑚𝑚 𝑽𝒎𝒊𝒄𝒓𝒐𝒄𝒉𝒂𝒏𝒏𝒆𝒍 = 𝟑𝟗𝟐𝟔. 𝟗𝟗𝟏𝒎𝒎𝟑 Volume of wires
𝑉𝑤𝑖𝑟𝑒𝑠= 𝜋𝐷2
4 × ℎ × 𝑁𝑢𝑚𝑏𝑒𝑟 𝑜𝑓 𝑊𝑖𝑟𝑒𝑠 𝑉19 𝑤𝑖𝑟𝑒𝑠 = 𝜋(1𝑚𝑚)2
4 × 44𝑚𝑚 × 19 𝑽𝟏𝟗𝒘𝒊𝒓𝒆𝒔 = 𝟔𝟓𝟔. 𝟓𝟗𝟑𝒎𝒎𝟑
𝑉13 𝑤𝑖𝑟𝑒𝑠 =𝜋(1𝑚𝑚)2
4 × 44𝑚𝑚 × 13 𝑽𝟏𝟑𝒘𝒊𝒓𝒆𝒔 = 𝟒𝟒𝟗. 𝟐𝟒𝟖𝒎𝒎𝟑
Cross section area of
flow stream 𝐴 = 𝜋𝐷𝑚𝑖𝑐𝑟𝑜𝑐ℎ𝑎𝑛𝑛𝑒𝑙2
4 − (𝜋𝐷𝑤𝑖𝑟𝑒𝑠2
4 × 𝑁𝑢𝑚𝑏𝑒𝑟 𝑜𝑓 𝑊𝑖𝑟𝑒𝑠) 𝐴19 𝑤𝑖𝑟𝑒𝑠 = 𝜋(10𝑚𝑚)2
4 − (𝜋(1𝑚𝑚)2
4 × 19) 𝑨𝟏𝟗 𝒘𝒊𝒓𝒆𝒔 = 𝟔𝟑. 𝟔𝟏𝟕𝒎𝒎𝟐
𝐴13 𝑤𝑖𝑟𝑒𝑠 = 𝜋(10𝑚𝑚)2
4 − (𝜋(1𝑚𝑚)2
4 × 13) 𝑨𝟏𝟑 𝒘𝒊𝒓𝒆𝒔 = 𝟔𝟖. 𝟑𝟑𝟎𝒎𝒎𝟐
Velocity w.r.t to 1s
𝑉𝑒𝑙𝑜 =𝑉𝑚𝑖𝑐𝑟𝑜𝑐ℎ𝑎𝑛𝑛𝑒𝑙 − 𝑉𝑤𝑖𝑟𝑒𝑠 𝐴
𝑉𝑒𝑙𝑜19 𝑤𝑖𝑟𝑒𝑠= 3926.991𝑚𝑚3− 656.593𝑚𝑚3 63.617𝑚𝑚2
𝑽𝒆𝒍𝒐𝟏𝟗 𝒘𝒊𝒓𝒆𝒔 = 𝟓𝟏. 𝟒𝟎𝟖𝒎𝒎
𝒔 = 𝟎. 𝟎𝟓𝒎 𝒔
𝑉𝑒𝑙𝑜13 𝑤𝑖𝑟𝑒𝑠 =3926.991𝑚𝑚3− 449.248𝑚𝑚3 68.330𝑚𝑚2
𝑽𝒆𝒍𝒐𝟏𝟑 𝒘𝒊𝒓𝒆𝒔 = 𝟓𝟎. 𝟖𝟗𝟔𝒎𝒎
𝒔 = 𝟎. 𝟎𝟓𝒎 𝒔
15
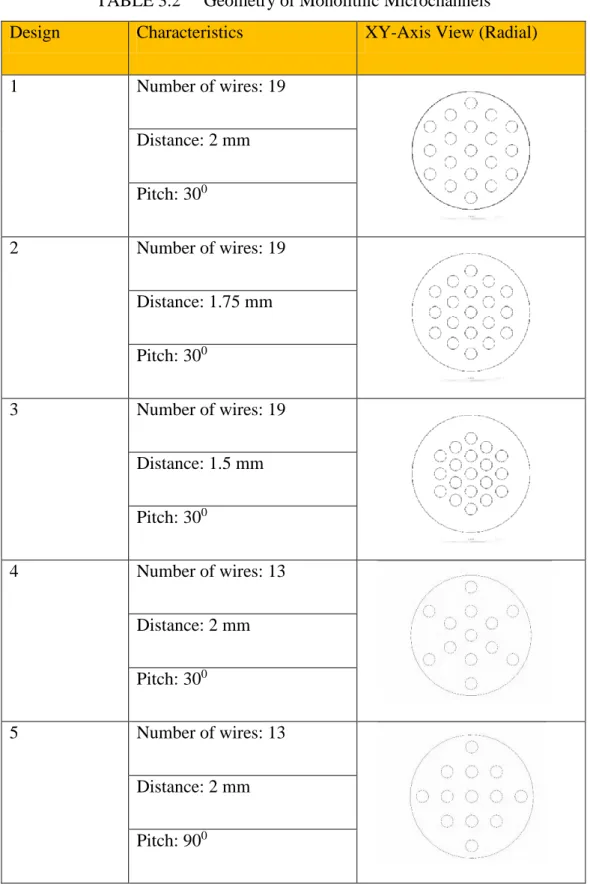
Table 3.2 illustrated the dimensional characteristics of the monolithic microchannel with the embedded wires. The types of wires configured in the radial direction (XY-axis) for Design 1, 2, 3, 4 and 5.
TABLE 3.2 Geometry of Monolithic Microchannels
Design Characteristics XY-Axis View (Radial)
1 Number of wires: 19
Distance: 2 mm Pitch: 300
2 Number of wires: 19
Distance: 1.75 mm Pitch: 300
3 Number of wires: 19
Distance: 1.5 mm Pitch: 300
4 Number of wires: 13
Distance: 2 mm Pitch: 300
5 Number of wires: 13
Distance: 2 mm Pitch: 900
16
Figure 3.2 displayed the location of plane 1, 2, 3 and 4 along the monolithic microchannel which are similar for all five designs. Plane 1, 2, 3 and 4 are located at Z-axis where the position are 5.56 mm, 16.67 mm, 27.78 mm and 38.89 mm from the inlet respectively
3 mm 44 mm 3 mm
10 mm
Plane 1 Plane 2 Plane 3 Plane 4
FIGURE 3.2 Location of Planes
The mesh properties for geometry 1 were set up to fine, coarse and medium.
According to the orthogonal factor, mixing index and time taken to run the program, coarse mesh was selected to be the relevance centre for all design were the mixing is more dynamic and steady as shown in Figure 3.3.
FIGURE 3.3 Mixing Index of Design 1 for Fine, Medium and Coarse Meshing 60
65 70 75 80 85 90 95 100 105 110
0 10 20 30 40 50 60
Mixing Index (%)
Axial Distance (mm)
D1 FINE D1 MEDIUM D1 COARSE
17 3.3 Physics Properties Setup
Once the geometry designs for the five configurations are accomplished, several pre-setup inputs are required by ANSYS before stimulating the design. The meshing parameters were selected so that the nodes are less than 512,000 due to license limitations. The simulation will have the inputs of hydrogen and nitrogen gases at a ratio of 3 atoms of hydrogen gas to 1 atom of hydrogen gas. The gas inlet velocity is the same for all type of design. . K-epsilon (k-ε) turbulence model is used in this simulation as it is the most common model used in Computational Fluid Dynamics (CFD) to simulate mean flow characteristics for turbulent flow conditions.
This project will not consider any magnetic induction in the simulation. The physics are listed in the Table 3.3.
TABLE 3.3 Flow Parameters Setup
Parameter Flow Properties
Gas Inlet Velocity 0.05 m/s
Gas Inlet Ratio H2 : N2 = 3 : 1
Volume Fraction H2 : N2 = 0.75 : 0.25
Temperature 250C
Pressure 1 atm
Heat Transfer Model Isothermal
Buoyancy Model Non-buoyant
Fluid Morphology Continuous Fluids Model
Turbulence Model K-Epsilon
Simulation Mode Steady State
System Reactivity Non-reactive System
18 3.4 Methodology Analysis
The analysis of the flow dynamics was based upon the volume fraction and velocity contour plots for each gasses selected at four plane at different axial location (YZ-axis). However the effect of magnetic induction field and reaction were not considered in this project. Other than that, to identify the mixing efficiency of each design, the Reynolds number need to be determined using equation 3.
𝑅𝑒 = 𝜌𝑉𝐷𝜇 (3)
where,
ρ = density (kg/m3) V = velocity (m/s)
D = diameter of cylinder (m) μ = fluid viscosity (kg/ms)
Generally, this equation uses the overall diameter of the cylinder to obtain the Reynolds number. However, this may not be suitable to this research as the project intention is to insert wires as obstacles in the monolithic microchannel. Thus, modification of equation is necessary to obtain the accurate project result. The density of mixture can be calculated based on equation 4.
𝜌𝑚𝑖𝑥 = 𝜌1𝑉1𝑉+𝜌2𝑉2+⋯+𝜌𝑛𝑉𝑛
1+𝑉2+⋯+𝑉𝑛 (4)
where,
n = number of chemical species
ρn = density of each of the component (kg/m3) Vn = volume of each component
19
Next step is the modification of the viscosity of the mixture using equation 5 and 6.
𝜇𝑚𝑖𝑥 = ∑ ∑ 𝑥𝑖𝑥𝑢𝑖
𝑗𝜑𝑖𝑗 𝑛𝑗=1
𝑛𝑖=1 (5)
𝜑𝑖𝑗 = 1
√8(1 +𝑀𝑀𝑖
𝑗)−
1
2(1 + (𝜇𝜇𝑖
𝑗)
1 2(𝑀𝑀𝑗
𝑖)
1 4)
2
(6)
where,
n = number of chemical species xi, xj =mole fractions of two species
μi, μj = viscosities of two species at specified temperature Mi, Mj = molecular weight of two species in g/mol
The diameter represented in the Reynolds number equation earlier is the hydraulic diameter which means diameter for a circular tube or wire. The diameter is calculated via equation 7.
𝐷𝐻 =4𝐴𝑃 (7)
where,
A = subtraction of cross sectional area and total area of void area (m2) P = wetted perimeter area (m)
20
After considering all equation that has been modified due to the project’s aim, the new Reynolds number equation is formed as equation 8.
𝑅𝑒 =𝜌𝑚𝑖𝑥𝜇 𝑉𝐷𝐻
𝑚𝑖𝑥 (8)
where,
ρmix = density of mixture (kg/m3) V = velocity (m/s)
DH = hydraulic diameter (m)
μmix = viscosity of the mixture (kg/ms)
In order to quantify the mixing efficiency, data from CFD simulation is extracted from the location of each line that have been constructed in the monolithic microchannel. From the 40 lines, 10 samples are taken from each line that denoted as volume fraction of hydrogen are used to calculate the mixing index. Then, based on the points taken, mixing index graph will be created using equation 9 and 10.
𝛾 = √𝑁1∑(𝐶𝑖− 𝐶𝑚)2 (9)
where,
= variance
Ci = volume fraction at points/nodes i Cm = optimal mixing volume fraction N = number of points/nodes
𝑀 = 1 − √𝛾𝛾2
𝑚𝑎𝑥2 (10)
where,
M = mixing index
2 = maximum variance
21
CHAPTER 4
RESULTS AND DISCUSSION
4.1 Results
The volume fraction and velocity of both nitrogen and hydrogen gases are extracted from the simulation in the form of contour plots in radial and axial manner.
Each radial arrangement consists of four planes which are measured equally to observe the mixing of both gasses. Mixing index for each geometry are calculated and presented in line chart to show which geometry create greater mixing to produce ammonia. The range of velocity profile is standardized from 0 ms-1 until 0.09 ms-1 and the range for volume fraction from 0 to 1. The results are taken from Post-CFX.
The results obtained are:
1. Velocity Contours for Nitrogen Flow in XY-axis 2. Velocity Contours for Hydrogen Flow in XY-axis 3. Volume Fraction Contours for Nitrogen Flow 4. Volume Fraction Contours for Hydrogen Flow 5. Velocity Contours at Centreline in YZ-axis 6. Streamline Velocity of Nitrogen and Hydrogen 7. Mixing Index Line Chart
22 4.2 Discussion
Based on the results obtained from the simulation, effect of distance between centre of wires, effect of number of wires and effect of wire pitch are investigated.
Design 1, 2 and 3 comprises the same geometry with different distance between centres of wires of 2 mm, 1.75 mm and 1.5 mm. Design 1 and 4 is studied with different number of wires, 19 wires and 13 wires respectively. For Design 4 and 5 different type of wire pitch is arranged for 30o triangle pitch and 90o square pitch.
Tables 4.1. 4.2, 4.7, 4.8, 4.13 and 4.14 indicating the velocity contours of nitrogen and hydrogen gases at four different planes created along the monolithic microchannel with different configuration of wires element accordingly. An active dynamic mixing was expected if the tone of the contour for both gases achieve similarities based on the set velocity which is shown at the legend on the right side of the tables.
On the other hand, volume fractions for nitrogen and hydrogen gases are presented in table 4.3, 4.4, 4.9, 4.10, 4.15 and 4.16 respectively. Since synthesizing ammonia requires 1 mole of nitrogen and 3 mole of hydrogen, the fraction of the gases should be in the ratio of 0.25:0.75. Therefore, lesser or higher fraction of the gases will result to lower the yield of ammonia when the actual reaction occurs in the microchannel [15].
Velocity of nitrogen and hydrogen can be visualize in an altered angle in Tables 4.5, 4.11 and 4.17 where the contour is obtained at the point Z = 0 on YZ- axis, showing the radial centreline of the movement for both gases. Similar hue of contour for nitrogen and hydrogen contours along the microchannel indicating good mixing among the gases. When a good mixing occurred, the velocity streamline shown in Tables 4.6, 4.12, 4.18 provide better characterization of the gases flowing downstream.
Mixing Index plotted in Figure 4.1 will become the last reference to acknowledged which design provide better mixing based on the parameter of volume
23
fraction and velocity contours at ten different axial distance distributed evenly throughout the monolithic microchannel.
4.2.1 Effect of Distance between Centres of Wires
According to the XY-axis velocity contour for nitrogen gas, from Design 1, 2 and 3, Design 1 having the most stable velocity while Design 2 and 3 shows inconsistent velocity at the centre of the channel as the arrangement of the wires as closely packed at that position providing less space for mixing and the velocity become less than the set velocity.
TABLE 4.1 Velocity Contour for Nitrogen Flow
Plane D1 D2 D3
1
2
3
4
24
For velocity contour of Design 1, the hydrogen gas moves at faster speed between 0.063 ms-1 and 0.072 ms-1 throughout the channel while Design 2 and 3 having lower velocity of hydrogen at the centre of microchannel than at the wall at Plane 1 and 4 around 0.06 ms-1 which lead to non-homogeneous mixing.
TABLE 4.2 Velocity Contour for Hydrogen Flow
Plane D1 D2 D3
1
2
3
4
For the volume fraction results, Design 1, 2 and 3 are not able to produce consistent volume fraction of nitrogen and hydrogen ratio, 3:1 except at plane 1.
25
TABLE 4.3 Volume Fraction Contour for Nitrogen Flow
Plane D1 D2 D3
1
2
3
4
TABLE 4.4 Volume Fraction Contour for Hydrogen Flow
Plane D1 D2 D3
1
2
3
4
26
From the velocity contours at centreline in YZ-axis, Design 1 is seen to have constant velocity of nitrogen while the hydrogen possesses higher velocity than the set velocity. For Design 2 and 3, velocity of hydrogen gas is higher at the outlet of the channel.
TABLE 4.5 Velocity Contours at Centerline
D1 N2
H2
D2 N2
H2
D3 N2
H2
27
Observing the velocity streamline of both gasses, Design 3 presented higher literal shift of gasses which mean more chaotic advection occur in this design compare to Design 1 and 2. Unfortunately, the advection only occurs at the centre of the microchannel and not producing an even mixing.
TABLE 4.6 Streamline Velocity of Nitrogen and Hydrogen
Design N2 H2
1
2
3
4.2.2 Effect of Number of Wires
From the results presented, Design 4 is having more uniform velocity of nitrogen and hydrogen at 0.05 ms-1 while Design 1 possess velocity of hydrogen flow approximately at 0.065 ms-1 which is higher than the set velocity. Since the velocity of nitrogen and hydrogen for Design 4 is nearly similar, it will lead to more uniform mixing.
28
TABLE 4.7 Velocity Contour for Nitrogen Flow
Plane D1 D4
1
2
3
4
TABLE 4.8 Velocity Contour for Hydrogen Flow
Plane D1 D4
1
2
3
4
29
Other than that, Plane 1 and 2 in Design 4 showed suitable volume fraction for nitrogen and hydrogen gasses which is 0.25:0.75 compare to Design 1 where only at Plane 1 it achieve the appropriate volume fraction.
TABLE 4.9 Volume Fraction Contour for Nitrogen Flow
Plane D1 D4
1
2
3
4
TABLE 4.10 Volume Fraction Contour for Hydrogen Flow
Plane D1 D4
1
2
3
4
30
Based on the velocity contours at centreline in YZ-axis nitrogen and hydrogen gasses achieve similar velocity where an active mixing may occur along the channel.
TABLE 4.11 Velocity Contours at Centerline
D1 N2
H2
D4 N2
H2
The velocity streamline for Design 1 and 4 illustrated similar shifting of gasses because the distance between centres of wires is the same for both geometries.
TABLE 4.12 Streamline Velocity of Nitrogen and Hydrogen
Design N2 H2
1
4
31 4.2.3 Effect of Wire Pitch
The velocity contour for Design 5 showed dissimilar velocity of nitrogen and hydrogen gasses at Plane 4 while Design 4 is having velocity that is constant throughout the monolithic microchannel.
TABLE 4.13 Velocity Contour for Nitrogen Flow
Plane D4 D5
1
2
3
4
TABLE 4.14 Velocity Contour for Hydrogen Flow
Plane D4 D5
1
2
3
4
32
However, this unlike wire pitch presented similar contours for volume fraction of hydrogen and nitrogen for Design 5 and Design 4.
TABLE 4.15 Volume Fraction Contour for Nitrogen Flow
Plane D4 D5
1
2
3
4
TABLE 4.16 Volume Fraction Contour for Hydrogen Flow
Plane D4 D5
1
2
3
4
33
The velocity contours at centerline and streamline of hydrogen and nitrogen gasses producing alike readings for Design 4 and 5 where good mixing is achieved for both designs.
TABLE 4.17 Velocity Contours at Centerline
D4 N2
H2
D5 N2
H2
TABLE 4.18 Streamline Velocity of Nitrogen and Hydrogen
Design N2 H2
4
5
34
According to Figure 4.1 mixing index of Design 1 is observed to be higher compare to Design 2 and 3. Therefore, Design 4 and 5 are created using 2 mm as the distance of centres between wires same as Design 1 as the results produce good convergence among the three designs.
The graph illustrated that Design 4 achieved greater dynamic mixing than Design 1. In this point of view, we can conclude that lower number of wires, 13 contributes to better mixing efficiency than 19 wires.
However, based on the mixing index calculation, it is indicated that Design 4 provided better mixing compare to Design 5 when the arrangement is in triangle pitch form.
FIGURE 4.1 Mixing Index of Geometries 60
65 70 75 80 85 90 95 100
0 10 20 30 40 50 60
Mixing Index (%)
Axial Distance (mm)
D1 D2 D3 D4 D5
35
CHAPTER 5
CONCLUSION AND RECOMMENDATIONS
5.1 Conclusion
Among the five geometries, Design 4 showed the best mixing result with uniform speed and volume fraction and high mixing index throughout the monolithic microchannel. The hydrogen and nitrogen gasses are distributed uniformly along the monolithic microchannel.
Dynamic mixing was successfully induced when appropriate properties of parameters were used in this project. When the wires are configured in a different manner, the simulation presented different mixing index and contours accordingly.
By placing obstructions to the flow, chaotic advection occurs and the flow direction of the gas stream altered laterally [16].
It is proven that creating suitable obstruction with larger obstruction space enhanced the mixing and rate of reaction between hydrogen and nitrogen gasses to synthesis ammonia [17]. Therefore the objectives of this project are achieved successfully with the appropriate methods that have been used.
36 5.2 Recommendation
1. More detail study need to be conduct to correct the minimum and maximum size of meshing to produce more accurate result.
2. The design parameters can be studied thoroughly to enable better understanding on the effect of design parameters on flow of hydrogen and nitrogen gasses to yield ammonia.
3. More design can be produced that can provide an active mixing and turbulent flow regime in the hydrogen and nitrogen stream.
4. The type of obstruction in the monolithic microchannel also can be improvised to provide suitable space and time for mixing of the two gasses to occur.
5. Mathematical model can be developed in order to obtain a better picture of mixing process for hydrogen and nitrogen gases.
6. Besides, MIM can be applied to the best design created in order to prove the simulation result.
37 REFERENCE
[1] C. Egenhofer and L. Schrefler, “For a Study on Composition and Drivers of Energy Prices and Costs in Energy Intensive Industries”, The Case of the Chemical Industry – Ammonia, 2014
[2] FAO, “Current World Fertilizer Trends and Outlook to 2015”, Food and Agriculture Organization of the United Nations Rome, 2011
[3] P. Puspitasari, J. A. Razak, N. Yahya, “Ammonia Synthesis Using Magnetic Induction Method (MIM)”, American Institute of Physics, 2012
[4] N. Yahya, P. Puspitasari, K. Koziol, N. A. M. Zabidi, and M. F. Othman, “Novel Electromagnetic Microreactor Design for Ammonia Synthesis”, International Journal of Basic and Applied Science, vol. 10, pp. 60-64, 2010
[5] N. Yahya, “Magnetically Induced Reaction for Green Ammonia Synthesis”, Available:http://www.utp.edu.my/icfas2012/images/stories/docs/noorhana_abstr act.pdf, 2012
[6] Y. A. Cengel, “Introduction to Thermodynamics and Heat Transfer”, Mc Graw Hill, 1997.
[7] S. Fields, Global nitrogen – “Cycling out of Control”, Environmental Health Perspectives, vol. 112 (10), pp. A556-A563, 2004
[8] International Energy Agency (IEA), “Ammonia”, Tracking Industrial Energy
Efficiency and CO2 Emissions, Available:
http://ietd.iipnetwork.org/content/ammonia, 2007
[9] T. M. Paschkewitz, “Ammonia Production at Ambient Temperature and Pressure: An Electrochemical and Biological Approach”, University of Iowa, 2012
38
[10] Y. Asano, S. Togashi, H. Tsudome and S. Murakami, “Microreactor Technology: Innovations in Production Processes”, International Society for Pharmaceutical Engineering, vol. 30, 2010
[11] N. Nguyen and Z. Wu, “Micromixers”, Journal of Micromechanics and Microengineering, vol. 15, 2005
[12] N. Nguyen, “Micromixers Fundamentals, Design and Fabrication”, William Andrew, 2012.
[13] P. L. Mills, D. J. Quiram, J. F. Ryley, “Microreactor Technology and Process Miniaturization For Catalytic Reactions—A Perspective On Recent Developments And Emerging Technologies”, Chemical Engineering Science, vol. 62, pp. 6692-7010, 2007
[14] A. Alam, A. Afzal and K. Y. Kim, “Mixing Performance of a Planar Micromixer with Circular Obstructions in a Curved Microchannel”, Chemical Engineers Research and Design, vol. 92, pp. 423-434, 2014
[15] M. Z. Abdullah, S. Kashif and L. S. Tan, “Characterizing the Mixing Dynamic of N2 and H2 Gases in a Monolithic Microchannel Impacted by the Wires Assembly”, FluidsChe 2015, 2015
[16] H. Shou-Shing and H. Yi-Cheng, “Passive Mixing in Micro-channels with Geometric Variations through μPIV and μLIF Measurements”, Journal of Micromechanics and Microengineering, vol. 18, p. 065017, 2008.
[17] W. W.-F. Leung and Y. Ren, “Crossflow and Mixing in Obstructed and Width- constricted Rotating Radial Microchannel”, International Journal of Heat and Mass Transfer, vol. 64, pp. 457-467, 2013.
39
[18] I. L. S. Yik, “Investigation of the Flow Behavioral Dynamics of Ammonia Component Gases in a Microreactor via Computational Fluid Dynamics (CFD) Approach”, Universiti Teknologi PETRONAS, 2013
[19] M. F. Rosli and M. Z. Abdullah. “CFD Modelling of the Micro-mixing Process for the One-Step Magnetically Induced Urea Synthesis I”, Universiti Teknologi PETRONAS, 2012
[20] W. F. Fang, M. H. Hsu, Y. T. Chen and J. T. Yang, “Characterization of Microfluidic Mixing and Reaction in Microchannels via Analysis of Cross- sectional Patterns”, 2011
[21] Z. Zhang, C. Yim, M. Lin and X. Cao, “Quantitative Characterization of Micromixing Simulation”, Biomicrofluidics, vol.2, 2008
[22] Jiang, Pei-Xue, Fan, Ming-Hong, S. Guang-Shu and R. Ze-Pei, “Thermal- Hydraulic Performance of Small Microchannel and Porous Media Heat Exchanger”, International Journal of Heat and Mass Transfer, 2001
[23] Chemgeneration, “Haber - Bosch Process”, Available:
http://www.chemgeneration.com/milestones/the-haber-bosch-process.html,2011 [24] M. Junkers, “Microreactor Technology”, ChemFiles, vol. 9 (4) Available:
http://www.sigmaaldrich.com/technical-
documents/articles/chemfiles/microreactor-technology.html
[25] R. K. Shah & D. Sekulic, “Fundamentals of Heat Exchanger Design”, John Wiley & Sons, Inc, 2003
[26] M. A. Ansari and K. Y. Kim, “A Numerical Study of Mixing in a Microchannel with Circular Mixing Chambers, Fluid Mechanics and Transport Phenomena, 2009
40 APPENDICES
Table 6.1 Data of Design 1 for Mixing Index
Axial Distance Mixing Index
0.00000 78.9620060
5.5555552 95.9872818
11.11111 92.1833706
16.6666652 91.5314049
22.2222204 91.2658523
27.7777756 91.0343305
33.3333309 90.7812707
38.8888879 90.4684746
44.4444432 89.8007017
49.9999984 98.7723088
Table 6.2 Data of Design 2 for Mixing Index
Axial Distance Mixing Index
0.00000 67.0952428
5.5555552 99.2441104
11.11111 95.3897065
16.6666652 93.1666549
22.2222204 91.5483739
27.7777756 90.5900886
33.3333309 90.1683140
38.8888879 90.0331906
44.4444432 89.7033729
49.9999984 99.9999930
Table 6.3 Data of Design 3 for Mixing Index
Axial Distance Mixing Index
0.00000 68.9068508
5.5555552 99.2200559
11.11111 94.9773916
16.6666652 92.9035451
22.2222204 91.4346443
27.7777756 90.5977994
33.3333309 90.3054150
38.8888879 90.3734315
44.4444432 90.0264452
49.9999984 99.9999966
41
Table 6.4 Data of Design 4 for Mixing Index
Axial Distance Mixing Index
0.00000 75.8977890
5.5555552 99.4816973
11.11111 96.3385958
16.6666652 94.4869045
22.2222204 93.1908758
27.7777756 92.4509036
33.3333309 92.1368027
38.8888879 92.0128499
44.4444432 91.7832820
49.9999984 99.0574372
Table 6.5 Data of Design 5 for Mixing Index
Axial Distance Mixing Index
0.00000 74.9405229
5.5555552 99.5154150
11.11111 96.3094125
16.6666652 94.4473237
22.2222204 93.1400963
27.7777756 92.3942163
33.3333309 92.0826618
38.8888879 92.0101235
44.4444432 91.8532044
49.9999984 99.1283896
42
Table 6.6 Data of Design 1 with Fine Mesh for Mixing Index
Axial Distance Mixing Index
0.00000 63.6098880
5.5555552 99.3567387
11.11111 93.5021581
16.6666652 91.3523257
22.2222204 90.3370678
27.7777756 90.2076187
33.3333309 90.4180149
38.8888879 90.2229702
44.4444432 88.8628677
49.9999984 98.1823015
Table 6.7 Data of Design 1 with Medium Mesh for Mixing Index
Axial Distance Mixing Index
0.00000 64.3333161
5.5555552 99.2710670
11.11111 93.3655383
16.6666652 91.0669005
22.2222204 89.9402122
27.7777756 89.7814673
33.3333309 90.0970223
38.8888879 90.1730210
44.4444432 89.2843898
49.9999984 98.4279116