MOHAMMAD AMIR ABDUL RASID B.TECH. (HONS) BUSINESS INFORMATION SYSTEM MAY 2012
MATHEMATICAL LEARNING GAMES APPLICATION FOR SLOW LEARNER CHILDREN
BUSINESS INFORMATION SYSTEM UNIVERSITI TEKNOLOGI PETRONAS
MAY 2012
MOHAMMAD AMIR ABDUL RASID
ii
CERTIFICATION OF APPROVAL
Mathematical Learning Game for Slow Learner Children
by
Mohammad Amir Bin Abdul Rasid
A project dissertation submitted to the Business Information System Programme
Universiti Teknolgi PETRONAS in partial fulfilment of the requirement for the
BACHELOR OF TECHNOLOGY (Hons) (BUSINESS INFORMATION SYSTEM)
Approved by,
___________________________________
(Assoc. Prof. Dr. Wan Fatimah Wan Ahmad)
UNIVERSTI TEKNOLOGI PETRONAS TRONOH, PERAK
Mei 2012
iii
CERTIFICATION OF ORIGINALTIY
This is to certify that I am responsible for the work submitted in this project, that the original work is my own except as specified in the reference and acknowledgements, and that the original work contained herein have not been undertaken or done by unspecified sources or person.
___________________________
Mohammad Amir bin Abdul Rasid
iv
Abstract
The main objective of this project is to develop an Android application that will be beneficial to the slow learner children. There are 3 main objectives that need to achieve, 1) To research on game theory regarding on mathematic subject that is suitable to attract children interest, 2) To develop an attractive mathematics game application that is suitable for children in primary school, and 3) To test and get the feedback from the user based on user’s own experience in using the application.
Mathematics is one of the core subjects that are important but least favourable by children. This is mainly due to its difficulty in learning the subject. The slow learner children are a group of children that has the IQ level below than normal children.
But, they are not Mentally Retarded or having Learning Disability. Because they are slow to catch up with the other children, they tend to be overlooked. There is no specific tool used in aiding these children in their learning. Thus, this application is develop to assist this group of children in their learning process. The target user for this application is from the slow learner children where age range is between 7 to 9 years old. The application will be develop using prototyping methodology which consists of four key elements which are planning, analysing, developing and implementing.
v
Acknowledgement
I would like to take this opportunity to acknowledge all parties who had contributed and involved for the completion of my Final Year Project (FYP). For the past seven months, I have learnt a lot of new things and it has been an amazing experience for me. There has been up and down throughout the journey but all these experience will help me in becoming a better person ahead.
First and foremost, I would like to express my deepest gratitude and appreciation to my supervisor, Associate Professor Dr. Wan Fatimah binti Wan Ahmad for the eternal helps and support she had given me throughout the completion of my FYP. She has been guiding me in from time to time in other to ensure there are not much obligations and complications in completing my project. She has been the major forces for me in completing this FYP. She keeps on giving me advices, ideas and suggestions endlessly which contributed and helped me a lot in getting ideas of developing this application.
In addition, I would like to thanks my family especially my parents. They have been such outstanding supporter to me and motivating me throughout the session. Their endless support will always be remembered.
Last but not least, I want to take this opportunity to thanks all my colleagues that have been helping in developing the application. Lot of things I learnt from them and their willingness to help me really ease me in completing this project. Not to forget, the students that have been choose in helping me to test my application and giving me the feedbacks. Your kindness will never be forgotten.
Thank you.
vi
TABLE OF CONTENTS
Certification of Approval ii
Certification of Originality iii
Abstract iv
Acknowledgement v
List of Figures viii
List of Tables ix
Chapter 1: INTRODUCTION
1.1 World with Smartphones 1
1.2 Problem Statement
1.2.1 Children Are Not Interested in Learning Mathematic 1 1.2.2 No Special tools in Learning Mathematic
For Slow Learner Children 2
1.3 Objectives and Scope of Study
1.3.1 Objectives 2
1.3.2 Scope of Study 2
1.4 The Relevancy and Feasibility of the Project 3
Chapter 2: LITERATURE REVIEW
2.1 Children with a Slow Learner Disease 5
2.2 Children Need Playing Time 5
2.3 ICT as A Medium to Help Slow Learners 6
2.4 Android Devices Increasing Popularity 7 2.5 Android Development and Opportunity 9
2.6 Growth of Android Games 10
2.7 The Usability Testing 12
vii Chapter 3: METHODOLOGY
3.1 Research Methodology 14
3.2 Project Activities
3.2.1 Project Progress 15
3.3 Time Frame for the Project Development 16
3.4 Key Milestone 16
3.5 Tools
3.5.1 Android Platform 17
3.5.2 Hardware 17
3.5.3 Software 18
3.6 Questionnaire Survey Analysis 18
Chapter 4: RESULT AND DISCUSSION 4.1 Deliverable’s Interface
4.1.1 Main Screen 22
4.1.2 Instruction Screen 23
4.1.3 Question Screen 24
4.1.4 Correct Answer 25
4.1.5 Incorrect Answer 26
4.1.6 Other Screen 27
4.1.7 Congratulation Screen 28
4.1.8 Game over Screen 29
4.2 Survey and Interview Result
4.2.1 Usability Testing 30
4.2.2 User Acceptance Testing 33
Chapter 5: CONCLUSION 36
REFERENCES 37
APPENDICES 39
viii
LIST OF FIGURES PAGE
Figure 1: Statistics on User Session by Device 4
Figure 2.1: Statistics on U.S Smartphone User Growth by OS 2009-2012 8 Figure 2.2: Statistics on Daypart Comparison on Total User-Base 9
Figure 2.3: Pie Chart on Smartphone Market Share 11
Figure 2.4: Pie Chart on U.S Mobile App Consumption, Time Spent per Category 12 Figure 2.5: Info Graph on Top 10 Categories of Apps Downloaded from Market 13
Figure 3.1: Prototyping Methodology 14
Figure 4.1: Main Menu Screen 23
Figure 4.2: Question Screen 24
Figure 4.3: Correct Answer Screen 25
Figure 4.4: Incorrect Answer Screen 26
Figure 4.5: Congratulation Screen 27
Figure 4.6: Game Over Screen 28
Figure 4.7: Rating for instruction in application 29
Figure 4.8: Rating for ease of use and user friendliness 30
Figure 4.9: Rating for suitability of font size 31
Figure 4.10: Rating for the quality of image used in game 31 Figure 4.11: Rating for overall design and layout of the game 32 Figure 4.12: Rating on attractiveness using mobile phones in learning Maths 33 Figure 4.13: Rating on impact of application in helping the students 34 Figure 4.14: Percentage on how many of them willing to promote the game 34
ix
LIST OF TABLES PAGE
Table 1: Time Frame of the Project 16
Table 2: FYP1 Milestone 17
Table 3: FYP2 Milestone 17
Table 4: Questionnaire Survey Analysis 19-22
.
1
Chapter 1 Introduction
1.1 World with Smartphones
We are living in the world of gadget around us. We can see hundreds of gadget been used by people around the world from all range of ages. One of the hottest gadgets around at the moment is the smartphones. There are number of brands of smartphones people are using and these smartphones run with their own Operating System (OS).
Among various OS around, one of the highest users is the Android device. Android OS is developed by Google Inc. and the Android itself is being used by several big smartphones manufacture like Samsung, HTC and Motorola. Unlike iPhone, Android devices offer you more flexibility in developing your own phone.
At first, the usages of smartphones are more concentrated on the X Generation people. However, as time goes by, lot of teenager even kids own their own smartphone. With the function of calling and messaging are the basic function used, the main attraction for these young group to buy the smartphones is because of the games that available.
1.2 Problem Statement
1.2.1 Children Are Not Interested in Learning Mathematic
Mathematic is one of the crucial subjects that need to be learned by the children since the early age. This is because most of the subjects that will be taken later in secondary school and college or university deals with calculation. Even nurses, bankers, economists and people in various other job positions use math on a regular basis. When ask the children in school their least favourite subject, they simply reply
“math”. They feel that math is very dull and dry. The numbers and formulae all tend to fuse together, causing many children to tune out (M. Martin, 2010).
2
1.2.2 No Special tools in Learning Mathematic for Slow Learner Children
Slow learner children require extra attention from teacher in order for them to understand what they are learning. However, teacher also needs to find a tool that can enhance the understanding of the subject. The use of technology in this situation can play a part in developing the learning growth of the children. The flexibility or learning implemented will eventually help the children to love the subject and understand it quicker (W. C. Marissa & H. Mazlan, 2007). There are no proper tool adopt in helping these children in learning. By using mobile gadget like tablet might assist the teacher in teaching them.
1.3 Objectives and Scope of Study 1.3.1 Objectives
There are three main objectives to be achieved in this project:
To research on game theory regarding on mathematic subject that is suitable to attract children interest.
To develop an attractive mathematics game application that is suitable for children in primary school.
To test and get the feedback from the user based on user’s own experience in using the application.
1.3.2 Scope of Study The scopes of study include:
1. Slow Learner Children on the Primary School
The author is focusing the target user for this application for the slow learner children who are in the primary school ages between 7 – 12 years old. This group of children require extra attention from the beginning to help them motivate and build the interest in the subject. An early exposure will help them to build confidence and interest to study mathematic.
3
2. Arcade Game-Typed for Mathematic in Android
The author want to take advantage based on the current flow of technology nowadays by developing the mathematical application games that is mobile and suitable to be played by children. The author specifies its platform and chooses Android over iOS and other platform due to Android simplicity in developing the games, acquiring permission and the increase of the Android devices user. As there are several categories of games, the author pick up the arcade-based game category in developing the mathematic game due to its high popularity of categories of game downloaded by users in the Android Market.
1.4 The Relevancy and Feasibility of the Project
Is it worth for us to develop the application for Android? The answer is yes without a doubt. But, you need to fulfil the criteria that required in order your application able to compete and sustain in the market. There was once when the iPhone was the leading smartphone with thousands of ‘cool’ apps you could download and there was no match for them back then. However, as time change, Android has giving the iPhone a serious fight in matching with those capabilities.
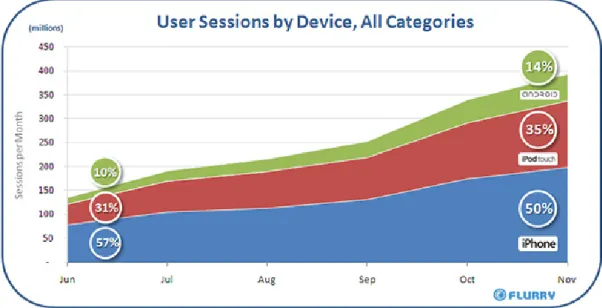
Figure 1: Statistics on User Session by Device
4
Based on the research done by Flurry Blog, the statistic above shows clearly that the user sessions by device is leading by the Android devices followed by iPod Touch and iPhone. This indicates that Android devices able to compete and match with Apple devices thus create an opportunity for the freelance developer to develop their apps.
In addition, the development of the Android application codes is written in Java programming language. Based on the background of subject taken previously, we are already being exposed and taught about the concept of Java programming and architecture. Though it is totally different environment, but the similarities are there.
With this, we can able to cope with the development technology better.
5
Chapter 2 Literature Review
2.1 Children With a Slow Learner Disease
Majority of the children grow without having any problem in their development. If we look at the primary school, most of the children who are attending the school able to learn how to read and calculate without any hiccup. However, there are few among those children are quite slow in catching up with their friend when learning.
This small group of children we called as the slow learner children.
About 1 out of 5 children are slow learners. They are often delayed in walking or talking. Most of the slow learners are born with problem such as severe head injuries, meningitis, or the mother’s use of alcohol or cocaine during the pregnancy which leads to the slow learner to the children. These children are often overlooked since they do not have Learning Disability or Mentally Retarded. In fact, we see them like a normal child.
Being a slow learner is a lifelong problem. A slow learner is a child whose IQ is low enough to cause considerable difficulty in keeping up in the classroom. An average IQ is 100. Slow learners score between 70 and 90 on IQ tests. Less than 70 is considered Mentally Retarded and slow learners are not Mentally Retarded (Don Eastmead, M.D, 2004).
2.2 Children Need Playing Time
As a parent, they may have concerns when see their child playing games or doing other activities that are not related to education. It is normal as parent worried that their child may spend too much time playing rather than studying. That is why some of the parents control their children and restrict them from having a playing time for them. It is actually not a good practice.
6
Play is linked to growth in memory, self-regulation, oral language, and recognizing symbols. It has been linked to higher levels of school adjustment and increased social development. Play has also been linked to increased literacy skills and other areas of academic learning (D. J. Leong PhD & E. Bodrova PhD, 2011). Thus, parents need to be considerate when dividing the time for their kids between study and playing.
2.3 ICT As A Medium To Help Slow Learners
Information and Communication Technology (ICT) is a term that includes any communication device or application, encompassing: radio, television, cellular phones, computer and network hardware and software. ICTs are often spoken in a particular context, such as ICTs in education, health care, or libraries.
With the advantage of the nowadays growth on the technology devices, particularly in mobile devices such as smartphones and tablets, it gives a new dimension to implementing the technology in assisting to tackle the problems such as in education sector. Through ICT, images can easily be used in teaching and improving the retentive memory of students. It also helps the teachers to easily explain complex instructions and ensure students’ comprehension. In addition, with ICT, teachers are able to create interactive classes and make the lessons more enjoyable, which could improve student attendance and concentration.
According to Cyraine Marissa and Hasan Mazlan, who are the Assistant Professor and Senior Instructional Designer respectively in National Institute of Education of Singapore, had conduct a research regarding the efficacy of the use of ICT for slow learners in Singapore primary schools. They find out with the implementation of the ICT in education learning for the teacher, it offers the slow learner the ability to move at his or her own pace. Large or complex tasks can be broken into components.
Levels in games and quizzes give learners the chance to explore and discover new levels of meaning incrementally along the way. The teachers can even use this as a form or reinforcement or remediation to help learners with their progress of difficult concepts.
7 2.4 Android Devices Increasing Popularity
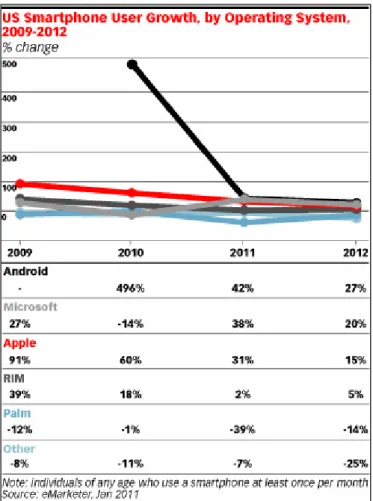
Android devices are one of the hottest topics that we can hear on the lips of almost every people nowadays. Android devices have become one of the most fast growing gadgets in this world. With variety of smartphones manufacture participate in producing devices based on Android OS, there is no joke that the amount of the Android users is increasing. According to The eMarketer Blog, the amount of Android usage exploded in 2010, experiencing a 496% growth in users and obtaining 24% of the US smartphone market, according to eMarketer data published in June 2011. Android usage will continue to grow this year, achieving 42% growth in users and 28% market share. Meanwhile, Apple will hold steady with 31% growth in users and 30% share in 2011.
Figure 2.1: Statistics on U.S Smartphone User Growth by OS 2009-2012
8
The above stat supports the statement that Android devices popularity is increasing and in-time of building its own empire. With an exceptional entering amount of users in 2010, the future of android cannot be seen any better with the figure keep on increasing from year to year.
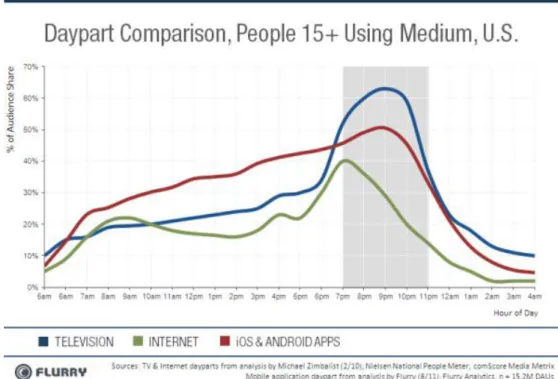
Figure 2.2: Statistics on Daypart Comparison on Total User-Base
The above comparison chart is taken from the research done by Flurry Blog shows that the percent of its own total user-base that a given medium reaches, each hour of the day, stating at 5 am. The above chart is done only to those age 15 years old and above who owns mobile device. The combination of iOS and Android apps dominate almost the entire portion of the day.
It proves that people now are tends to do almost everything with their mobile devices such as web browsing, email checking, and even doing their daily business process.
This will further help in developing the Android development into even bigger phase.
9 2.5 Android Development and Opportunity
“The open-source Android OS requires no licensing fee and allows handset manufacturers and wireless carriers considerable latitude to customize the user interface according to their desired specifications,” said Noah Elkin, eMarketer principal analyst. “With a growing roster of manufacturer and carrier partners in every major market and market segment, scale for Android is coming quickly in terms of device, market share, apps and ad revenues.”
This will create a bright future for developer whether it is company-based or freelance as this growth gives them the opportunity to make profit for themselves.
This could also be a jumping stone to any individuals or small company to establish their name and reputation in this field of business.
The BlackBerry and iPhone, which have appealing and high-volume mobile platforms, are addressing opposite ends of a spectrum. The BlackBerry is rock-solid for the enterprise business user. For a consumer device, it's hard to compete with the iPhone for ease of use and the "cool factor." Android, a young and yet-unproven platform, has the potential to play at both ends of the mobile-phone spectrum and perhaps even bridge the gulf between work and play.
Today, many network-based or network-capable appliances run a flavor of the Linux kernel. It's a solid platform: cost-effective to deploy and support and readily accepted as a good design approach for deployment. The UI for such devices is often HTML- based and viewable with a PC or Mac browser.
As the development for the Android can be said cost-effective, everyone could give it a try if they want to invent and create a new application for Android. Another plus is that most of the UI is viewable and readable via Windows or Mac which make it user friendly. Most of the freelance developer and student out there are using Windows or Mac OS based and some may use Linux based. So, it does not require the developer to own a dedicated physical platform to develop the applications.
10 2.6 Growth of Android Games
We cannot denied that one of the main attraction of the Apple devices like iPod Touch and iPhone is the games they offer are extremely interesting and addicting.
However, since Android has develop into one of the main pioneer in smartphones market, the games application in Android OS have also developing and becoming bigger each year.
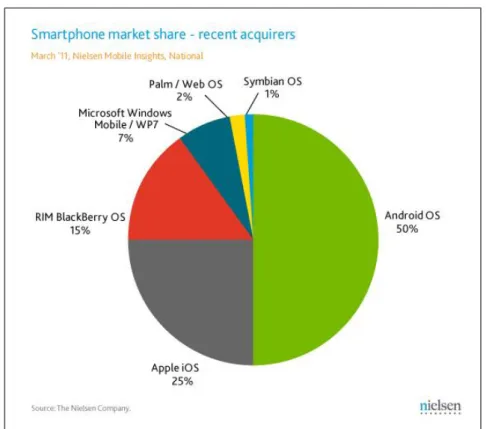
Figure 2.3: Pie Chart on Smartphone Market Share
The chart above, taken from the PCWorld article titled Android Market Share Growth Accelerating, shows how much portion Android OS have gain and beating its rivals such as iOS and RIM Blackberry OS.
Most of the games offers in iOS are available in Android. Developers who at first resist to develop for Android, was then slowly bow down and listen to the demand that increased for the Android devices. They want to make profit thus it is a big loss for them if they do not take this opportunity to grab as much profit as possible.
11
The large portions of mobile application are focused on Games and Social Networking with the Games category edge Social Networking category by 47% to 32% respectively. The below pie chart is taken from the Flurry Blog to show the clear view of the Mobile App Consumption, Time Spent per Category.
Figure 2.4: Pie Chart on U.S Mobile App Consumption, Time Spent per Category Based on all the application downloaded from the Android Market, Games category conquering the chart by 25.6% compares to other 9 categories. As in the Games category, it consist of 6 type of games Android offers which are Arcade, Brain/Puzzle, Casual, Cards, Racing and Sports Games. Arcade based game sitting on top of the chart followed by the Brain/Puzzle type of games. This shows that users are more interested in playing or spending their time in playing based on these 2 types of games. As the Brain/Puzzle types are in the second spot, there is future for this type of game to be developed further with innovation and creativity to sustain in market. Below is the info graphic showing the download history of the Android apps in Android Market.
12
Figure 2.5: Info Graph on Top 10 Categories of Apps Downloaded from Market 2.7 The Usability Testing
The usability testing is one of the important phases that every developer needs to perform. This testing is to determine whether the product developed is suitable to the users and customers. There is no use if the system is able to perform its functionality perfectly but the user unable to use it because they find it difficult to use. Usability can be defined as the quality attribute that assesses how easy user interface are to use. The word usability also refers to methods for improving ease-of-use during the design process (Nielsen, J.). In usability testing, there are five important components which consist of Learnability, Efficiency, Memorability, Errors, and Satisfaction.
Learnability to see how easy is it for users to accomplish basic tasks the first time they encounter the design. On efficiency, we look on how fast experienced users can accomplish tasks. The memorability key is when users return to the design after a period of not using it, does the user remember enough to use it efficiently the next time, or does the user have to start over again learning everything. Errors will help to determine how many errors do user make, how severe these errors and how easily can they recover from the errors and last but not least, satisfaction will look on how much does the user like using the system. The usability testing is crucial in order to
13
identify any usability problems. The goal for this testing is to identify the usability problems, collect quantitative data on participants’ performance, as well as determine user satisfaction with the product or system. To put it in a simple way, if a website is difficult to navigate or does not clearly have a purpose, users will leave. To ensure that the users do not leave, makes testing on the website is necessary. In order to improve the usability, there are three components that require:
Get yourself a representative user, such as customer or user.
Ask the user to perform representative tasks with the design.
Observe what the users do, where they succeed, and where they have difficulties with the user interface. Just remain silence and let the user do the talking.
It is important to test users individually and let them solve any problems on their own. If you help them or direct their attention to any particular part of the screen, you have contaminated the test results (Nielsen, J.).
14
Chapter 3 Methodology
3.1 Research Methodology
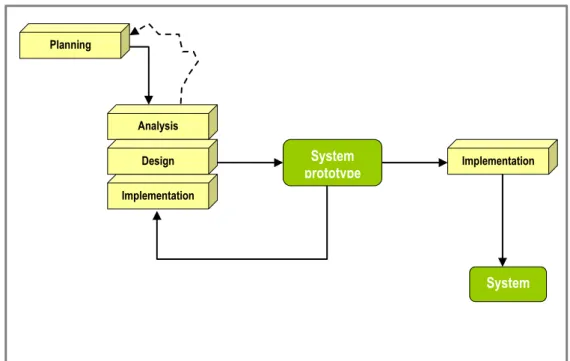
For developing this project, we need to use one methodology that suits with the condition in developing this Android application. There are few methodology available such as waterfall, prototyping, and agile. However, the methodology that will be implemented throughout this project is the Prototyping Methodology.
Figure 3.1: Prototyping Methodology
This methodology is divided into 4 phases which are Planning, Analysis, Design and Implementation. We need to go through all the 4 phases in order to build a complete and successful application.
Planning
Analysis
Implementation
Design System Implementation
prototype
System
15 Planning:
For this phase, we are required to come out with the ideas on what we are going to develop. We need to set up goals, timeframe, list down the key milestones and other important components that are required for us to pursue with this development.
Analysis:
For this phase, we are required to do data gathering from different sources on the topic that we want to develop in. There few sources we could get such as journals, articles, newspapers, internet and magazines. Then, we need to use all these data to analytical thinking and come out with the result that will help and benefit us throughout the development.
Design:
Come to this phase, we will have to start with the design of the application. The interface design and develop the apps all happen in this phase. We will come out with the prototype and do several tests. If there are errors and bugs, we need to solve it back and ensure the application is stable enough to be implemented.
Implementation:
This is the last phase before we are going to send the application to run live in System. Usually when it comes to this stage, almost 90% of the application can be run and if there is minor bug it will be solved by updating it later.
3.2 Project Activity
The activities that involve throughout in developing this project are based on the methodology we have chosen before. It will begin from the starting point of brainstorming of the ideas, choosing the best application to develop, gathering all the require information regarding the project; do some data analysis, until the end point of it which is implementation.
3.2.1 Project Progress
The current progress of the project is on the data gathering and analysing phase. The targeted user has been decided and the categories of game that want to be developed
16
also have been made. The author is currently analyse all the information and consults with the supervisor on the workflow of the game. Once the idea of the game has been decided, the beginning of development of the application will start soon.
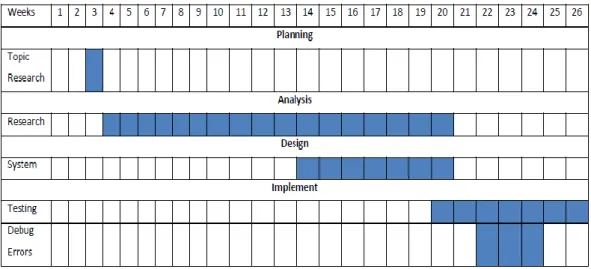
3.3 Time Frame for the Project Development
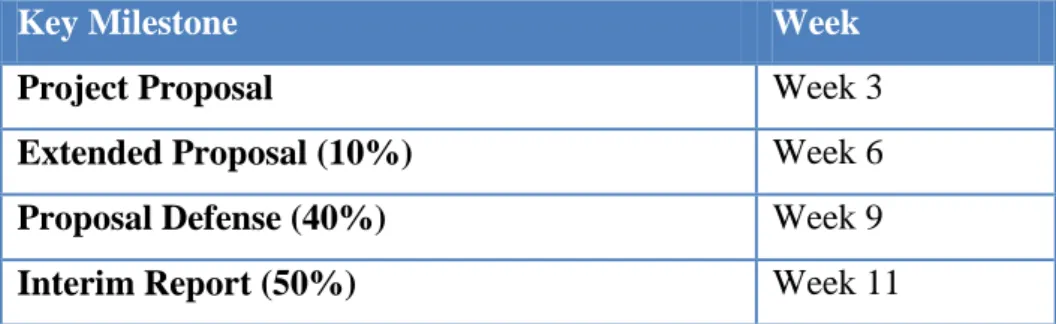
Table 1: Time Frame of the Project 3.4 Key Milestone
Table below shows the key milestone that the author needs to achieve during two semesters in final year project 1 (FYP1) and final year project 2 (FYP2).
Key Milestone Week
Project Proposal Week 3
Extended Proposal (10%) Week 6
Proposal Defense (40%) Week 9
Interim Report (50%) Week 11
Table 2: FYP1 Milestone
17
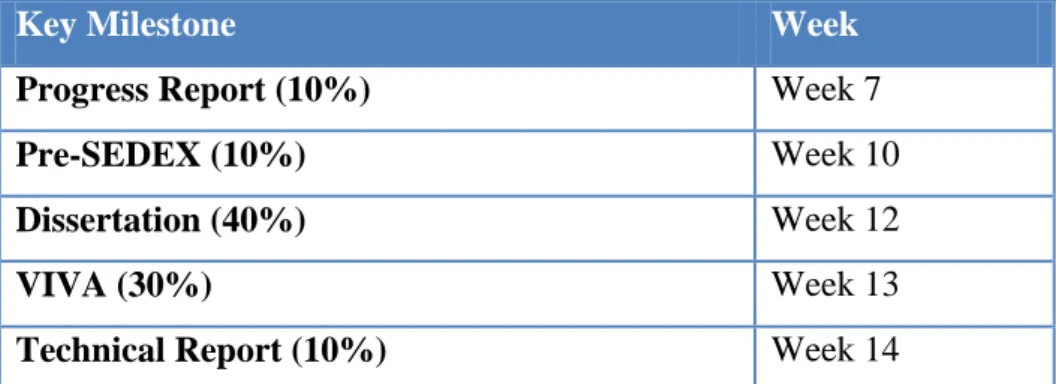
Key Milestone Week
Progress Report (10%) Week 7
Pre-SEDEX (10%) Week 10
Dissertation (40%) Week 12
VIVA (30%) Week 13
Technical Report (10%) Week 14
Table 3: FYP2 Milestone 3.5 Tools
3.5.1 Android Platform
The version history of the Android operating system began with the release of the Android 1.0 beta in November 2007. Android is a mobile operating system developed by Google and the Open Handset Alliance, and has seen a number of updates to its base operating system since its original release. The updates typically fix bugs and add new features.
Since April 2009, each Android version has been developed under a codename based on a dessert item. These versions have release alphabetical order: Cupcake, Donut, Éclair, Froyo, Gingerbread, Honeycomb and Ice Cream Sandwich. The pre-release versions of Android were dubbed Astro and Bender, but these names could not ultimately be used for trademark reason. The most recent update to the Android OS was v4.0.3, which was released in December 2011.
3.5.2 Hardware
To develop the Android application, only two things are require for the hardware.
The first one is the Android device. We will be using the Samsung Galaxy S II which runs with 2.3.6 Gingerbread OS as the testing device. Another hardware that we will be using is the personal computer where we will do all the coding and application development in here.
18
Yes 65%
No 35%
3.5.3 Software
In developing the Android application, there are several softwares that are required.
The easiest way to start developing Android is to download the Android SDK and the Eclipse IDE. Android development can take place on Microsoft Windows, Mac OS X or Linux. Android applications are written in the Java language, but compiled and executed in the Dalvik VM (a non-Java virtual machine). The other software tool used in developing the Android app is using AppInventor provide by the Massachusetts Institute of Technology (MIT).
3.6 Questionnaire Survey Analysis
Questionnaire form is distributed to the targeted group of users. This group of slow learner children are age range between 7 to 9 years old where consist of Standard 1 up to Standard 3 primary school students. This survey is conducted to have a better understanding of the current trend on mobile phones application or game of the children and their interest in Mathematics. Table shows the analysis of each question.
Question Pie Chart Analysis
1. Do you or your parents
have an
Android
device? (e.g.
Samsung, HTC)
65% of the students
themselves or their parents have the Android devices.
This shows
majority of the students have easy access to use the devices. Yet, there are still around 35% of them who are not owned any of these devices.
19 Yes 75%
No 25%
Yes 95%
No 5%
Everyday 70%
Twice a week
20%
Once a week
7%
I do not play game
3%
2. Do you like to play games
that have
educational concept in it?
75% of the students love the implementation of educational
concept in games as it will help them improve as well as challenge
themselves. But, still there are 25%
that do not like it as they take games
solely for
entertainment purpose.
3. Do you play
games on
your/parents mobile phones?
On this question, almost all of them play games on the mobile phones.
This is due most of the games are entertaining and addictive. There is still minor of 5%
who does not play as they do not own the device.
4. How often do you play the games?
Majority of them which are around 70% play games everyday. It follows by 20% of them palying twice a week, 7% on once a week and lastly 3% said they do not play game.
The high number of playing games too often is due to the addictiveness of the students toward the game played.
20
Less than 2 hours 2-5 hours 50%
34%
More than 5 hours
13%
I do not play game
3%
Strongly Agree
30%
Agree 40%
Neutral 15%
Disagree 10%
Strongly Disagree
5%
5. How long do you spend each
time you
playing games?
Half of the students play the games for less than 2 hours.
Around 34% of them play for 2 to 5 hours. Only 13%
of them play more than 5 hours and lastly, 3% of them claim that they do not play. This shows that these kids spend almost every single hour of their free time playing games.
6. Do you think that learning through game is fun?
30% of the students strongly agree that learning a subject through game is fun. 40 % of them are agree followed by 15%
are not sure. 10%
of them disagree and 5% of the remaining strongly disagree with the statement. Total of 70% of them agree that this way of learning is fun as it create a much entertaining way of learning compare to the conventional method.
21
Strongly Agree Agree 57%
20%
Neutral 13%
Disagree 6%
Strongly Disagree
4%
Strongly Agree
64%
Agree 23%
Neutral 8%
Disagree 5%
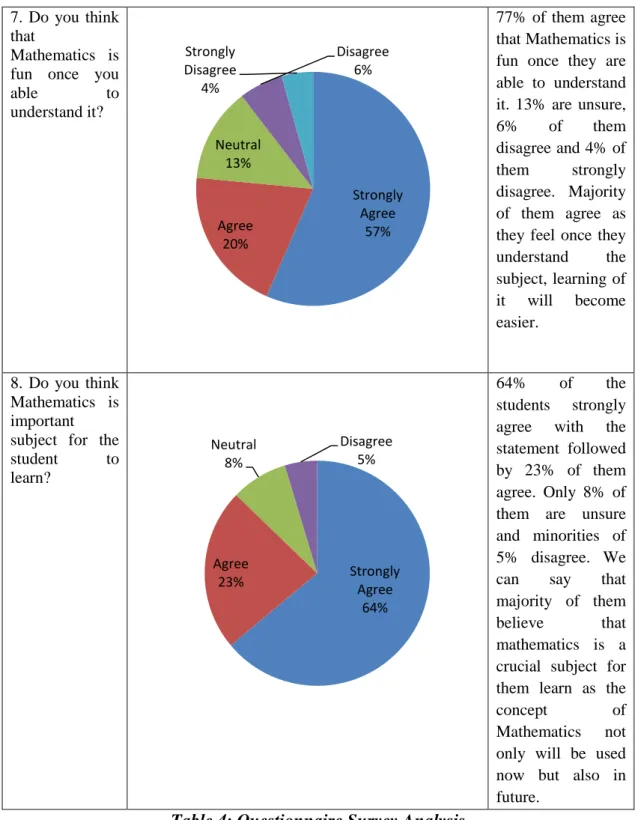
7. Do you think that
Mathematics is fun once you
able to
understand it?
77% of them agree that Mathematics is fun once they are able to understand it. 13% are unsure, 6% of them disagree and 4% of them strongly disagree. Majority of them agree as they feel once they understand the subject, learning of it will become easier.
8. Do you think Mathematics is important subject for the student to learn?
64% of the students strongly agree with the statement followed by 23% of them agree. Only 8% of them are unsure and minorities of 5% disagree. We can say that majority of them believe that mathematics is a crucial subject for them learn as the
concept of
Mathematics not only will be used now but also in future.
Table 4: Questionnaire Survey Analysis
22
Chapter 4
Result and Discussion
4.1 Deliverable’s Interface
The Mathematical Learning Games for Android has been developed and delivered to the target group. These are interfaces that have been developed.
4.1.1 Main Screen
Figure 4.1 shows the screen of the main menu in Mathematical Learning Game.
There are 2 buttons in the main menu. For the ‘Start’ button, it will lead the user to the next screen of the game and the user will see the first level of the game. Another button which is ‘Instruction’ button, it will help and guide the first time user on how the game works.
Figure 4.1
23 4.1.2 Instruction Screen
Figure 4.2 shows the screen for the instruction of the game. The instruction basically tells users on how the flow of the game and what the users need to do to accomplish each level.
Figure 4.2
24 4.1.3 Question Screen
Figure 4.3 shows the layout question in Mathematical Learning Game. In this screen, user will see the main layout of the game which is adapted from the mole mash arcade game. The conventional way of playing this game is user need to hit the mole whenever it appears at the hole randomly. The same concept is adapted here as the user requires hitting the mole in order to answer the questions. Below the game layout, user can see the given question and there are three buttons available. The
‘Submit’ button will decide whether the user answer the question correctly or not.
The ‘Next’ button will change the question to another question and last but not least, the ‘Reset’ button is used for user to reset the answer back to 0 if the accidently over hitting the mole which will result in incorrect answer. Initially, the user will start the game with 4 lives to survive throughout all 3 levels.
Figure 4.3
25 4.1.4 Correct Answer
Figure 4.4 shows the screen layout when the user enters a correct answer. Once the user click on the ‘Submit’ button, the app will reveal whether it is correct or not. If the answer is correctly answered, the user will gain 4 points and will be update in the score.
Figure 4.4
26 4.1.5 Incorrect Answer
Figure 4.5 shows the screen layout if the user answered the question wrongly. The app will indicate the user that the answer submitted is incorrect. Every time the user answers it wrongly, the user will lose one of the heart lives.
Figure 4.5
27 4.1.6 Other Screen
Figure 4.6 and Figure 4.7 shows that the transition screens that will appear each time the user able to complete each level. Figure 4.8 and Figure 4.9 show the screens of Level 2 and Level 3 respectively. Each time the user proceeds to the next level, the difficulty of the questions will be harder and the amount of hole will also increase.
Figure 4.6 Figure 4.7
Figure 4.8 Figure 4.9
28 4.1.7 Congratulation Screen
Figure 4.5 shows the congratulation screen if the user able to completes each level of the game. In order for the user to complete each level, user require to answer all the questions given in all 3 levels without losing all the lives provided.
Figure 4.10
29 4.1.8 Game Over
Figure 4.6 shows the screen layout of game over. This screen will be displayed if the user unable to meet the requirement given. This screen will be displayed for around 10 seconds and later will switch to the Main Screen back. The record will be reset and the user will able to start again.
Figure 4.6
30 4.2 Survey and Interview Result
In order to meet up with the objectives of the project, survey and interview had been conducted to a target user group to measure the suitability and effectiveness of the application. A survey and were conducted with selected 20 primary school students age range between 7 to 9 years old. These categories of student consist of student from standard one up to standard three. The reason behind this is because the mathematics games syllabus cover up until addition and subtraction only. The multiplication and division only be taught later in standard three. Every students are given chance to play with Mathematic Learning Game using several android devices such as phones and tablets. At the end of the session, survey form is distributed to the students. The data gathered from the survey are used to analysed and discussed.
4.2.1 Usability Testing
For the following analysis, Scale 1 represents the lowest score while Scale 5 represents the highest score.
Figure 4.7: Rating for instruction in application
Figure 4.7 shows the graph conducted for the first question. The users were asked regarding their understanding on the instruction on how to play with this game.
Result shows 9 students rated with Scale 4 and 6 students rated Scale 5. This shows that majority of the users understand on how the game works and know how to play
0 2 4 6 8 10
Scale 1 Scale 2 Scale 3 Scale 4 Scale 5
Do you understand the instruction of
playing this game?
31
with it. Minority with of the students have difficulty in understanding it for the first time which result 2 student on Scale 2 and 3 students on Scale 3.
Figure 4.8: Rating for ease of use and user friendliness
Figure 4.8 shows that there are 10 of the students who rated for ease of use and user friendly at the Scale of 4. There are another 2 students rated it at Scale 5. This shows that over half of the users found the game is user friendly and easy for them to use even for the first time. Apart from that, around 6 students found the game moderately easy to use at the Scale of 3 and remaining 2 students find it difficult to use at first by scaling at Scale 1 and Scale 2 respectively.
0 2 4 6 8 10
Scale 1 Scale 2 Scale 3 Scale 4 Scale 5
Ease of use and user friendly
32
Figure 4.9: Rating for suitability of font size
Figure 4.9 shows that there are 9 students feel the font size used in this game are suitable and comfortable for them. Another 6 students rate it on the Scale of 4 and the remaining of the students rated on Scale 3. Overall, students find that sizes of the fonts used are suitable and acceptable enough for them. But, there is still room for improvement in future.
Figure 4.10: Rating for the quality of image used in game
Figure 4.10 shows on how the students rate the quality of images used in making this game. 11 students rated on Scale 4 for the quality of the images used and 5 of the students rated on Scale 5. The remaining of them rated it at the Scale of 3. Although
0 1 2 3 4 5 6 7 8 9
Scale 1 Scale 2 Scale 3 Scale 4 Scale 5
Suitability of font sizes
0 2 4 6 8 10 12
Scale 1 Scale 2 Scale 3 Scale 4 Scale 5
How do you find the quality of images in
this game?
33
majority of the students feel the quality of image used are satisfying, there is still improvement in future can be made in designing a more high quality of game.
Figure 4.11: Rating for overall design and layout of the game
Figure 4.11 shows the overall rating on the design and layout of the game developed.
13 out of 20 students rated the game’s overall layout as excellent at Scale of 5. They feel that the designs are attractive and clean. Remaining 5 of students rated it at Scale 4 while the other 2 students at Scale 3. The result can be said as satisfactory but room for improvement for the future in developing a better layout of game is highly possible.
4.2.2 User Acceptance Testing
After the usability testing has been conducted, the targeted users are also been asked on the user acceptance testing survey. Like the previous survey, the Scale 1 represents the lowest score and Scale 5 represents the highest score.
0 2 4 6 8 10 12 14
Scale 1 Scale 2 Scale 3 Scale 4 Scale 5
Overall design and layout of the game
34
Figure 4.11: Rating on attractiveness using mobile phones in learning Maths Figure 4.11 shows the respond of students on how they find on using mobile phones as tool for them to learn Mathematics subject. Large portion of them, consist of 14 students agree that using mobile phones is an attractive way of learn for them compare to the conventional method. 4 of the students rated on Scale 4 while remaining two rated on Scale 2 and Scale 3 respectively.
Figure 4.12: Rating on impact of application in helping the students
Figure 4.12 shows on the result whether the application developed, in this case a Mathematical Learning Game, useful in helping the targeted group of users in
0 2 4 6 8 10 12 14
Scale 1 Scale 2 Scale 3 Scale 4 Scale 5
Attractiveness of using mobile phones as tool for learning Mathematics
0 5 10 15
Scale 1 Scale 2 Scale 3 Scale 4 Scale 5
Is slow learner students found the application useful in helping them in
learning Mathematics?
35
improving their learning in Mathematics. Over than half of the students, which is 15 students, rated the application really helpful for learning the subject and improve the performance of their study in the subject. Another remaining 5 students also found it helpful by rated it at the Scale of 4.
Figure 4.13: Percentage on how many of them willing to promote the game Figure 4.12 shows the pie chart on the percentage of targeted users who will promote this game to their families and friends. Based on the result, 75% of the users are believed will share and eventually promote this game to their friends and family who are on the same range of age with them. This shows a promising future in increasing the number of users using this application in future time. However, there is still around 25% of the students say that they might not promote the game to their other friends and family. This is mainly due to unavailability of the device by their friend that requires the game to run.
Based on the survey and interview that has been conducted on the targeted users, we can conclude that the development of this application helps the targeted users to improve and boost their interest in learning Mathematics. The results also give a promising future for the developer to develop a much more attractive application or game that is suitable other range of users. There is still room for improvement in making a better application to help that unfortunate group of people in developing their skills.
Yes 75%
No 25%
Will you share/promote this game to your
friends?
36
Chapter 5 Conclusion
The development of this application will contribute and help the slow learners children in helping and guiding them in mathematic. It will bring a new way for the teachers and parents to help these children during their developing stage. All the parties involve such as teacher, parent and children need to work together thus, tackle the problems like 1) Children Are Not Interested in Learning Mathematic, and 2) No Special tools in Learning Mathematic for Slow Learner Children effectively.
It is important to come out with the best solution and to ensure that, all the objectives need to be met which are 1) to research on game theory regarding on mathematic subject that is suitable to attract children interest, 2) to develop an attractive mathematics game application that is suitable for children in primary school, and 3) to test and get the feedback from the user based on user’s own experience in using the application.
By able to meet all the objectives as well as solving the problems mentioned earlier, it is hope that this project will be developed successfully. By that, it can offer a better development for the slow learners’ children to better.
37
References
1. Michelle Martin. “Why Is Math So Important For Kids?” Retrieved from http://www.livestrong.com/article/255620-why-is-math-so-important-for- kids/
2. Deborah J. Leong PhD & Elena Bodrova PhD. “Why Children Need Play”.
Retrieved from http://www.scholastic.com/teachers/article/why-children- need-play-0#top
3. “ICT (information and communications technology)”. Retrieved from http://searchcio-midmarket.techtarget.com/definition/ICT
4. “What is ICT in Education?” Retrieved from http://www.elmoglobal.com/en/html/ict/01.aspx
5. Sultan Muhammad Khan. “Education of Slow Learner”. Retrieved from http://research-education-edu.blogspot.com/2008/08/education-of-slow-learner.html 6. Wettasinghe Cyraine Marissa & Hasan Mazlan. “Investigating the Efficacy of
the Use of ICT for Slow Learners: Case Studies in Singapore Primary Schools.” Retrieved from the Conference ICL, 2007.
7. “Android Version History”. Retrieved from
http://en.wikipedia.org/wiki/Android_version_history
8. Charles Newark-French. “Mobile App Usage Further Dominates Web, Spurred by Facebook”. Retrieved from
http://blog.flurry.com/?Tag=Usage%20Statistics
9. Stephanie Reese. “Quick Stat: Android Users to Increase by 42% This Year”.
Retrieved from http://www.emarketer.com/blog/index.php/quick-stat- android-users-increase-42-year/
10. Ed Oswald. “Android Market Share Growth Accelerating, Nielsen Finds”.
Retrieved from
http://www.pcworld.com/article/226339/android_market_share_growth_accel erating_nielsen_finds.html
11. Jesse Blauer. “Android Market Growth and Downloads History”. Retrieved from http://technorati.com/technology/android/article/android-market- growth-and-downloads-history/
38
12. Frank Ableson. “Introduction to Android Development. The Open Source Application Platform”. Retrieved from
http://www.ibm.com/developerworks/opensource/library/os-android-devel/
13. Jakob Nielsen. “Introduction to Usability”. Retrieved from http://www.useit.com/alertbox/20030825.html
14. Marissa Peacock. “The What, Why and How of Usability Testing”. Retrieved from http://www.cmswire.com/cms/web-engagement/the-what-why-and-how-of- usability-testing-007152.php
39
Appendix
Gantt Chart
.