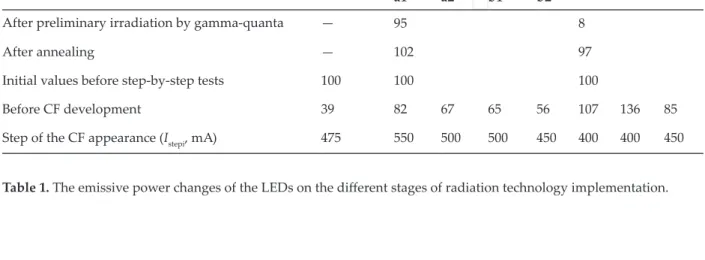
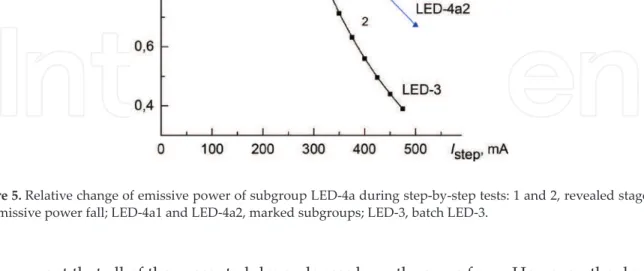
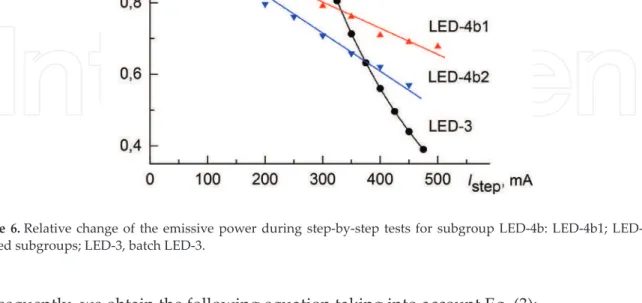
Furthermore, Figure 5 illustrates for comparison the variation of the emitting power of LEDs without pre-irradiation (batch LED-3) during operation. Changes in the emitting power of LEDs at different stages of the implementation of radiation technology.
Preliminary irradiation by fast neutrons
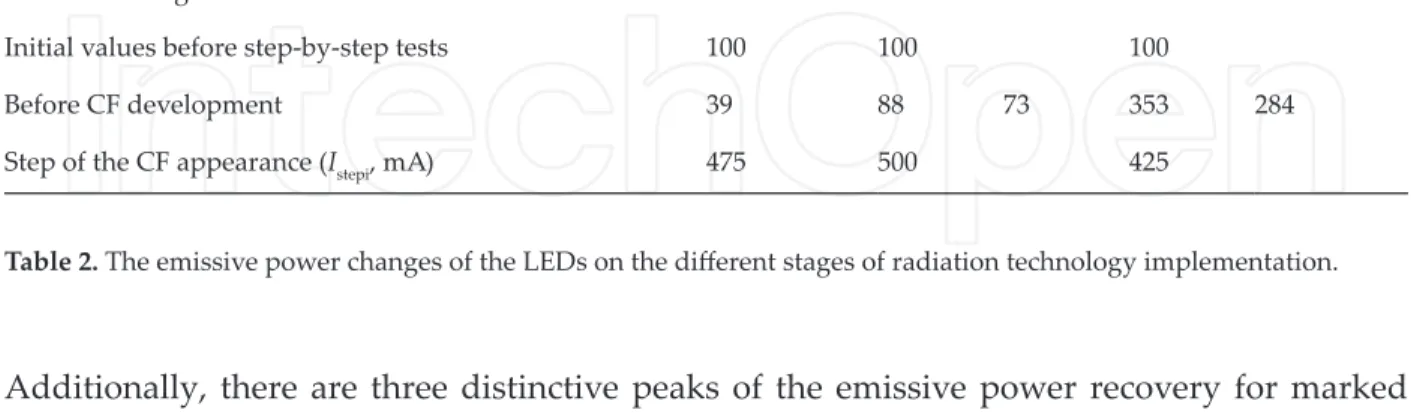
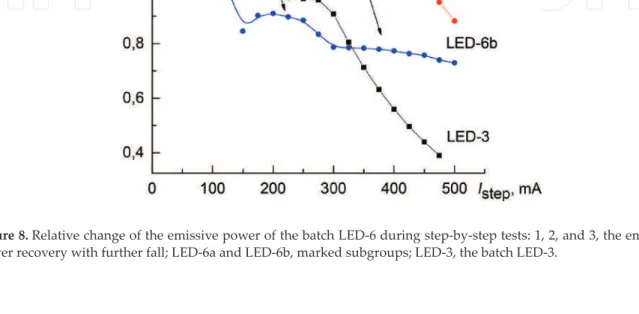
In addition, there are three distinctive peaks of emissivity recovery for marked subgroups of the LED-6 batch. Next, Figure 9 shows the change of the emissivity of the LED-7 batch during step-by-step testing.
Conclusion
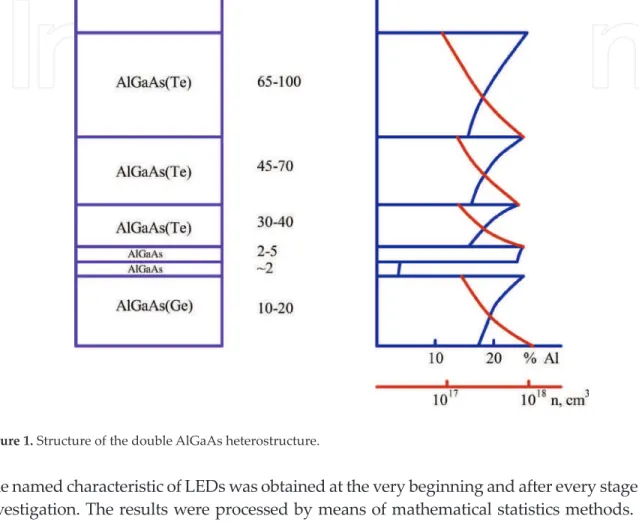
Accordingly, the division of the original LEDs into distinctive subgroups has been established while investigating the influence of preliminary irradiation from fast neutrons with further annealing on the operational characteristics of the LEDs. This technology is based on preliminary irradiation with fast neutrons and further annealing to improve the operating parameters of the LEDs.
Acknowledgements
Author details
Influence of irradiation by 60Co gamma-quanta on the reliability of IR-LEDs based on AlGaAs heterostructures. Study of the "memory effect" in 3 cm band Gunn diodes under fast neutron irradiation.
TOP 1%
Applicability of Quantum Dots in Biomedical Science
Introduction
Properties of QDs have generated great interest in biology and medicine in recent years [3]. However, major concerns about the potential toxicity of QDs have cast doubt on their practical use in biology and medicine [3].
The band gap energy
The negative energy is proportional to the Rydberg energy (Ry = 13.6 eV) and inversely proportional to the square of the size-dependent dielectric constant, εr. Using these models and spectroscopic measurements of the emitted photon energy E, it is possible to measure the band gap of QDs.
Biomedical application of quantum dots
- Photophysical properties of quantum dots
One of the most common features of QDs is the photoluminescence redshift relative to absorption, known as the Stokes shift. The large separation between the excitation and emission spectra of the QDs improves the detection sensitivity, as the full emission spectra of QDs can be detected.
![Figure 2. Band gap energy and size dependent wavelength of CdSe quantum dot [12].](https://thumb-ap.123doks.com/thumbv2/1libvncom/9201459.0/27.918.134.790.244.694/figure-band-energy-size-dependent-wavelength-cdse-quantum.webp)
Core/shell structure quantum dot
- Surface coatings and water-solubility
Quantum yield is a measure of the "brightness" of a fluorophore and is defined as the ratio of the number of photons emitted to the number of photons absorbed. QDs are relatively efficient with respect to the conversion of excitation light to emission, with quantum yields generally above 50%. Some of the techniques used to achieve solubility include ligand exchange, surface silanization, and phase transfer method [29].
This process did not affect the optical characters of the QDs compared to the original QDs. The hydrophobic alkyl chains of the polymer interdigitate with the alkyl groups on the QDs surface, while the hydrophilic groups orient outward to achieve water solubility. This process did not affect the optical characters of the QDs compared to the original hydrophobic surfactant layer.
![Figure 7. Band gap energy core/shell/ligand structure [12].](https://thumb-ap.123doks.com/thumbv2/1libvncom/9201459.0/31.918.141.788.248.495/figure-band-gap-energy-core-shell-ligand-structure.webp)
Functionalization of quantum dots
- Covalent linkage
- Electrostatic interaction
- Non-specific adsorption
- Mercapto exchange
Biomolecules, such as proteins, peptides and antibodies, were conjugated to the free functional groups by cross-linking to the reactive amine. In this case, the protein of interest can be fused to a positively charged domain, which in turn will bind electrostatically to the negatively charged surface of the QDs [6]. Therefore, conjugates prepared in this way are not suitable for in vivo or ex vivo cell labeling due to the possible interference with positively charged proteins [42].
Simple small molecules such as oligonucleotides and various serum albumins were found to readily adsorb to the surface of water-soluble QDs [6]. The conjugated biomolecules can break off and the QDs can precipitate out of the solution [6]. The surface of QDs is decorated with various biomolecules: proteins, peptides, nucleic acids, ligands or other biomolecules to achieve bioconjugation that mediates specific interactions with living tissues.
![Figure 10. Functionalization of hydrophilic quantum dots [ 16 ].](https://thumb-ap.123doks.com/thumbv2/1libvncom/9201459.0/34.918.110.817.245.540/figure-functionalization-hydrophilic-quantum-dots.webp)
Toxicity of quantum dots
- Nontoxic quantum dots
This adsorption is non-specific and depends on ionic strength, pH, temperature and surface charge of the molecule [5]. An unstable surface coating can expose the core of the QD to UV damage or air oxidation. Studies in cell lines have shown that QDs do not affect cell growth under normal media conditions, and short-term administration of QDs to animals does not appear to affect animal metabolism and behavior [48].
At a concentration of 20 nM, which is twice the concentration used in the fluorescence cell imaging assay, cytotoxicity was negligible. There are also concerns about the toxicity associated with the molecules used to surface functionalize QDs [6]. However, to date, there are very few studies reporting the use of InP QDs in bioimaging applications, as they are difficult to prepare due to the sensitivity of precursors and surfactants to the reaction environment in obtaining quality InP QDs [52].
Adventures of quantum dots compared to conventional fluorophores
Si QDs are produced in non-polar solvents with hydrophobic ligands on their surface to protect the Si core. Thus, fabricating good water-dispersed Si QDs with stable optical characters is vital for their applications in bioimaging studies.
Conclusion
Surface passivation of luminescent colloidal quantum dots with poly(dimethylaminoethyl methacrylate) by a ligand exchange process. Semiconductor quantum dots as fluorescent probes for in vitro and in vivo biomolecular and cellular imaging. Antibody conjugation of luminescent quantum dots using an engineered adapter protein to provide novel reagents for fluoroimmunoassays.
Folate receptor-mediated delivery of InP quantum dots for bioimaging using confocal and two-photon microscopy.
Hydrogen Gas Detection by Mini-Raman Lidar
Hydrogen generation – controlled and unprepared
The use of hydrogen energy is ongoing, which is mainly led by the Natural Resources and Energy Agency of the Ministry of Economy, Trade and Industry, Japan to promote the proliferation of fuel cell vehicles (FCV) and fuel cell systems for home use. Hydrogen gas is stored in a high pressure tank at 35 MPa in hydrogen station and FCV. Hydrogen gas on the nuclear reactor is generated by the other process against the above.
Generally, the nuclear fuel rod boils water with its high temperature in nuclear reaction. Although the nuclear fuel rod was coated with zirconium, it reacted with water at the high temperature. Under the controlled condition of generating the electricity or the unforeseen circumstances, hydrogen gas monitoring is essential and should prevent the accident.
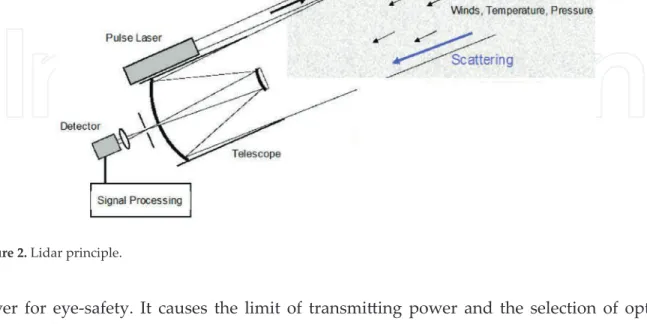
Optical sensing for hydrogen gas
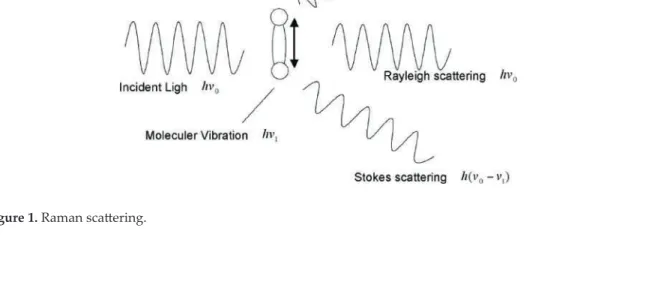
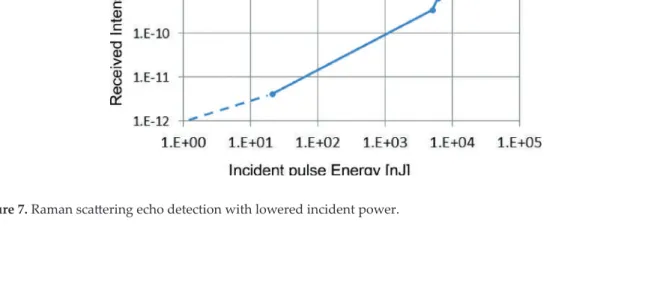
Raman scattering shifts the wavelength of the scattered light from the wavelength of the incident light. In general, the intensity of Raman scattering is 3 orders of magnitude lower than the intensity of Mie scattering [14, 15]. A small fraction of such photons is scattered with a frequency different from the original frequency of the incident photons.
Energy absorption of molecules causes Stokes scattering, while energy loss of molecules generates anti-Stokes scattering. In this study, the Stokes distribution of hydrogen gas is chosen for the purpose of lidar detection under these backgrounds. When the concentration of hydrogen gas is a negligible amount than that of atmospheric nitrogen, the ratio between the Raman scattering intensities of hydrogen gas and atmospheric nitrogen can indicate the concentration of hydrogen gas quantitatively.
Compact Raman lidar
Our goal is the detection of the hydrogen gas concentration of 1% within the observation range of 0–50 m. The interference filters of the wavelength widths of 3 nm are fixed on their PMTs. The nearest echo in 0–1.5 m in Figure 4(a) is spoiled due to the misalignment and the aberration of the lenses.
Figure 4(b) shows the beam-corrected nitrogen Raman echo, which is corrected by the square of the distance and the overlap function between the transmitter and the receiver. Hydrogen gas was filled in a 10 cm cubic gas cell, the window of which is quartz. The fluctuation in echo intensity was mainly due to background light, unstable laser beam power and thermal noise of the detector.
LED-based mini-Raman lidar
The concentration of hydrogen gas was controlled by adjusting the gas pressure in the cell. This observation range design comes from the space of a nuclear reactor facility to detect the leakage of hydrogen gas. Quantitative measurement of hydrogen gas was performed with a large gas chamber as shown in Figure 10.
The hydrogen gas concentration was adjusted by purging the air inside the chamber to 0.5 Pa and introducing 100% hydrogen. The echo numbers of the hydrogen gas Raman signal were subtracted from the reference echo (0% hydrogen gas). The change of hydrogen Echo Raman is calculated depending on the concentration of hydrogen gas. a) Echo changes at each detected distance.
Discussions
Conclusions
The authors then repeated the quantitative measurement with a larger chamber at the outdoor field. When the DPSS laser-based lidar is fixed in a sunshade area, it will perform with sufficient accuracy. Inside, the artificial light was no effect for Raman signal detection by excluding for its direct insertion into the detector, even if it was in the case of the LED-based lidar.
Development of remote sensing technology for measuring hydrogen gas concentration using Raman scattering effect. Selection of our books indexed in the Book Citation Index in the Web of Science™ Core Collection (BKCI).
Investigating the Nature of Insulator-Metal Transition in Neutron-Transmutation-Doped Ge:Ga
- Effect of ionizing radiation on the electrical properties of semiconductors
- Mott metal-insulator transition (MIT)
- Experimental part
- Experimental results
- Conclusions
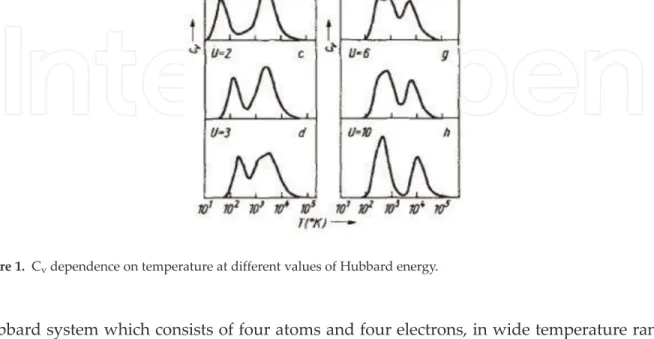
The outer shell of the Co atom has an electronic configuration of 3d4s and that of the O atom is 2S2P, which means that the number of electrons per unit cell is an odd number. With the discovery of high TC superconductors in cuprates and the rediscovery of enormous magnetoresistance in manganite, the situation changed. The main problem of Mott insulators is to find the electron correlation energy.
This is the Hubbard energy U for double occupancy of the same orbital on the same atomic site with two electrons. In an antiferromagnetic insulator, the size of the Hubbard gap is not greatly affected when the temperature passes through the Neel point TN. Mott addressed the metal-insulator junction problem by treating the electron gas as a screen for the positive charge on the donors, so that the potential energy seen by electrons in heavily doped semiconductors is of the form.
W)/KT, when1≤r2 and W is the hopping energy of the order of half the bandwidth of the states. In the case of a = 2 Å, he predicted the minimum metallic conductivity to be in the range 2–5000 (Ω.cm) 1 , and he considered this to be the smallest conductivity expected unless the density of states is broadened by disorder.
![Figure 1. Size-dependent band gap energy [2].](https://thumb-ap.123doks.com/thumbv2/1libvncom/9201459.0/25.918.134.785.243.583/figure-size-dependent-band-gap-energy.webp)
![Figure 6. Fluorescence lifetime quantum dots and organic fluorophore [19].](https://thumb-ap.123doks.com/thumbv2/1libvncom/9201459.0/29.918.133.778.867.1172/figure-fluorescence-lifetime-quantum-dots-organic-fluorophore.webp)
![Figure 5. Fluorescence lifetime [2].](https://thumb-ap.123doks.com/thumbv2/1libvncom/9201459.0/29.918.138.784.244.543/figure-fluorescence-lifetime.webp)
![Figure 8. Core/shell/ligand structure of hydrophobic quantum dot [12].](https://thumb-ap.123doks.com/thumbv2/1libvncom/9201459.0/32.918.136.784.233.569/figure-core-shell-ligand-structure-hydrophobic-quantum-dot.webp)
