Applied Statistics and Probability for E (1)
Teks penuh
Gambar

Garis besar
Dokumen terkait
One can glean from the two examples above that the sample information is made available to the analyst and, with the aid of statistical methods and elements of probability,
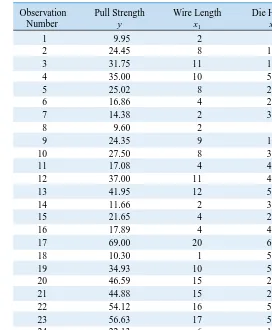
Suppose that n measurements have been taken on the random variable under consideration (eg number of syntax errors, downloading time).. Denote these measurements by
In other words, a conditional probability relative to a subspace A of S may be calculated directly from the probabilities assigned to the elements of the original sample space S ....
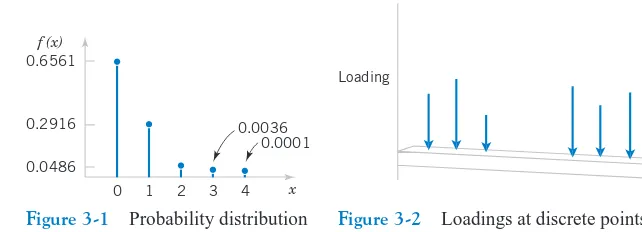
In the case of tossing a coin three times, the variable X, representing the number of heads, assumes the value 2 with probability 3/8, since 3 of the 8 equally likely sample
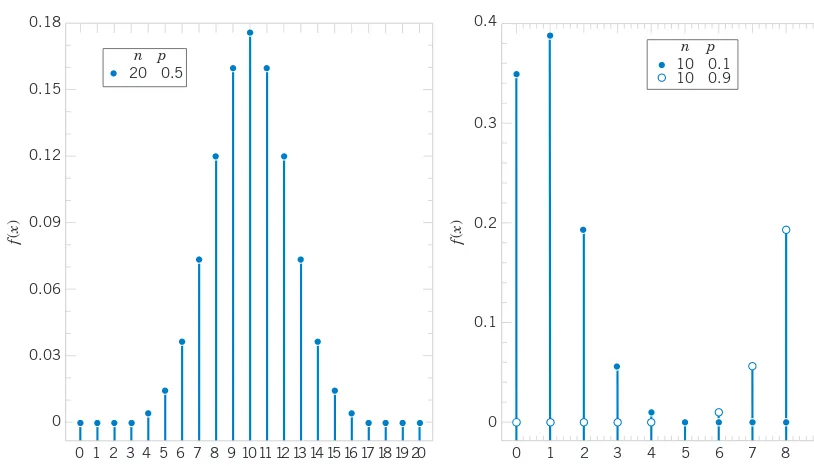
The probability distribution of this discrete random variable is called the binomial distribution , and its values will be denoted by b ( x ; n, p ) since they depend on the number
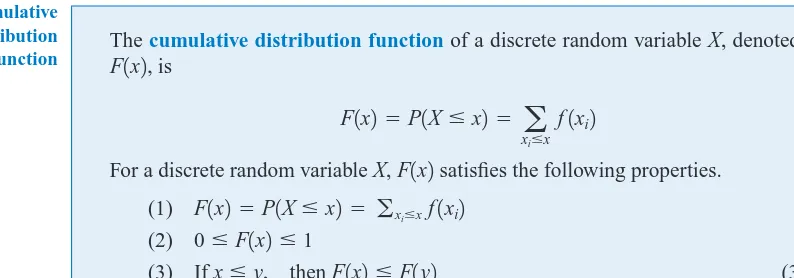
Another way to find the desired probability that an event occurs is to use a probability density function when we have continuous random variables or a probability mass function
NPTEL Syllabus Probability and Statistics - Video course COURSE OUTLINE Algebra of sets, introduction to probability, random variables, probability distributions, moments, moment
The properties of the event operations are: 1.02 Classic Probability Models Given a random experiment and the associated sample space S, the primary objective of probability
