Probability & Statistics for
Engineers & Scientists
N I N T H
E D I T I O N
Ronald E. Walpole
Roanoke College
Raymond H. Myers
Virginia Tech
Sharon L. Myers
Radford University
Keying Ye
University of Texas at San Antonio
Probability
2.1
Sample Space
In the study of statistics, we are concerned basically with the presentation and interpretation of chance outcomes that occur in a planned study or scientific investigation. For example, we may record the number of accidents that occur monthly at the intersection of Driftwood Lane and Royal Oak Drive, hoping to justify the installation of a traffic light; we might classify items coming off an as-sembly line as “defective” or “nondefective”; or we may be interested in the volume of gas released in a chemical reaction when the concentration of an acid is varied. Hence, the statistician is often dealing with either numerical data, representing counts or measurements, or categorical data, which can be classified according to some criterion.
We shall refer to any recording of information, whether it be numerical or categorical, as an observation. Thus, the numbers 2, 0, 1, and 2, representing the number of accidents that occurred for each month from January through April during the past year at the intersection of Driftwood Lane and Royal Oak Drive, constitute a set of observations. Similarly, the categorical data N, D, N, N, and D, representing the items found to be defective or nondefective when five items are inspected, are recorded as observations.
Statisticians use the wordexperimentto describe any process that generates a set of data. A simple example of a statistical experiment is the tossing of a coin. In this experiment, there are only two possible outcomes, heads or tails. Another experiment might be the launching of a missile and observing of its velocity at specified times. The opinions of voters concerning a new sales tax can also be considered as observations of an experiment. We are particularly interested in the observations obtained by repeating the experiment several times. In most cases, the outcomes will depend on chance and, therefore, cannot be predicted with certainty. If a chemist runs an analysis several times under the same conditions, he or she will obtain different measurements, indicating an element of chance in the experimental procedure. Even when a coin is tossed repeatedly, we cannot be certain that a given toss will result in a head. However, we know the entire set of possibilities for each toss.
Given the discussion in Section 1.7, we should deal with the breadth of the term experiment. Three types of statistical studies were reviewed, and several examples were given of each. In each of the three cases,designed experiments,observational studies, andretrospective studies, the end result was a set ofdatathat of course is
subject touncertainty. Though only one of these has the wordexperimentin its description, the process of generating the data or the process of observing the data is part of an experiment. The corrosion study discussed in Section 1.2 certainly involves an experiment, with measures of corrosion representing the data. The ex-ample given in Section 1.7 in which blood cholesterol and sodium were observed on a group of individuals represented an observational study (as opposed to adesigned experiment), and yet the process generated data and the outcome is subject to un-certainty. Thus, it is an experiment. A third example in Section 1.7 represented a retrospective study in which historical data on monthly electric power consump-tion and average monthly ambient temperature were observed. Even though the data may have been in the files for decades, the process is still referred to as an experiment.
Definition 2.1: The set of all possible outcomes of a statistical experiment is called thesample
spaceand is represented by the symbolS.
Each outcome in a sample space is called an element or a member of the sample space, or simply asample point. If the sample space has a finite number of elements, we maylistthe members separated by commas and enclosed in braces. Thus, the sample space S, of possible outcomes when a coin is flipped, may be written
S={H, T},
where HandTcorrespond to heads and tails, respectively.
Example 2.1: Consider the experiment of tossing a die. If we are interested in the number that shows on the top face, the sample space is
S1={1,2,3,4,5,6}.
If we are interested only in whether the number is even or odd, the sample space is simply
S2={even, odd}.
Example 2.1 illustrates the fact that more than one sample space can be used to describe the outcomes of an experiment. In this case,S1provides more information thanS2. If we know which element inS1 occurs, we can tell which outcome inS2 occurs; however, a knowledge of what happens inS2is of little help in determining which element inS1 occurs. In general, it is desirable to use the sample space that gives the most information concerning the outcomes of the experiment. In some experiments, it is helpful to list the elements of the sample space systematically by means of a tree diagram.
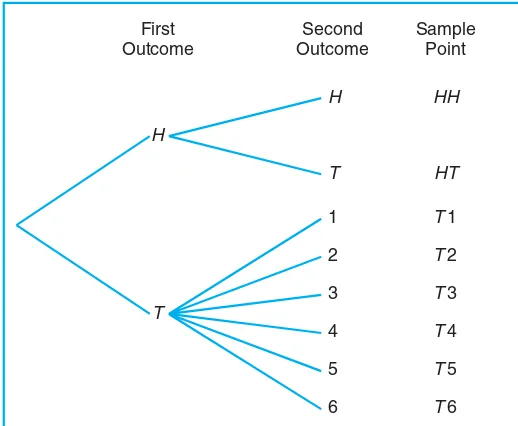
Example 2.2: An experiment consists of flipping a coin and then flipping it a second time if a head occurs. If a tail occurs on the first flip, then a die is tossed once. To list the elements of the sample space providing the most information, we construct the tree diagram of Figure 2.1. The various paths along the branches of the tree give the distinct sample points. Starting with the top left branch and moving to the right along the first path, we get the sample point HH, indicating the possibility that heads occurs on two successive flips of the coin. Likewise, the sample point T3 indicates the possibility that the coin will show a tail followed by a 3 on the toss of the die. By proceeding along all paths, we see that the sample space is
H
T
H HH
T HT
T1
T2
T3
T4
T5
T6 1
2 3 4 5 6 First
Outcome
Second Outcome
Sample Point
Figure 2.1: Tree diagram for Example 2.2.
Many of the concepts in this chapter are best illustrated with examples involving the use of dice and cards. These are particularly important applications to use early in the learning process, to facilitate the flow of these new concepts into scientific and engineering examples such as the following.
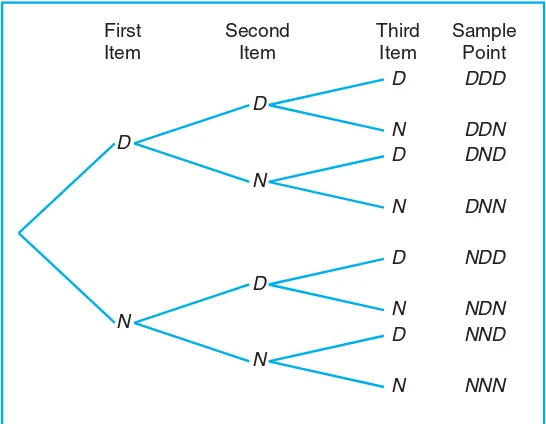
Example 2.3: Suppose that three items are selected at random from a manufacturing process. Each item is inspected and classified defective, D, or nondefective,N. To list the elements of the sample space providing the most information, we construct the tree diagram of Figure 2.2. Now, the various paths along the branches of the tree give the distinct sample points. Starting with the first path, we get the sample point DDD, indicating the possibility that all three items inspected are defective. As we proceed along the other paths, we see that the sample space is
S={DDD, DDN, DN D, DN N, N DD, N DN, N N D, N N N}.
Sample spaces with a large or infinite number of sample points are best de-scribed by astatement or rule method. For example, if the possible outcomes of an experiment are the set of cities in the world with a population over 1 million, our sample space is written
S={x|xis a city with a population over 1 million},
which reads “S is the set of all xsuch that xis a city with a population over 1 million.” The vertical bar is read “such that.” Similarly, ifSis the set of all points (x, y) on the boundary or the interior of a circle of radius 2 with center at the origin, we write therule
D
N
D
N
D
N
D DDD
N DDN
D DND
N DNN
D NDD
N NDN
D NND
N NNN
First Item
Second Item
Third Item
Sample Point
Figure 2.2: Tree diagram for Example 2.3.
Whether we describe the sample space by the rule method or by listing the elements will depend on the specific problem at hand. The rule method has practi-cal advantages, particularly for many experiments where listing becomes a tedious chore.
Consider the situation of Example 2.3 in which items from a manufacturing process are either D, defective, or N, nondefective. There are many important statistical procedures called sampling plans that determine whether or not a “lot” of items is considered satisfactory. One such plan involves sampling untilk defec-tives are observed. Suppose the experiment is to sample items randomly until one defective item is observed. The sample space for this case is
S={D, N D, N N D, N N N D, . . .}.
2.2
Events
For any given experiment, we may be interested in the occurrence of certainevents
rather than in the occurrence of a specific element in the sample space. For in-stance, we may be interested in the eventAthat the outcome when a die is tossed is divisible by 3. This will occur if the outcome is an element of the subsetA={3,6}
of the sample spaceS1 in Example 2.1. As a further illustration, we may be inter-ested in the event B that the number of defectives is greater than 1 in Example 2.3. This will occur if the outcome is an element of the subset
B={DDN, DN D, N DD, DDD}
of the sample spaceS.
Definition 2.2: Aneventis a subset of a sample space.
Example 2.4: Given the sample space S = {t | t ≥ 0}, where t is the life in years of a certain electronic component, then the eventAthat the component fails before the end of the fifth year is the subsetA={t|0≤t <5}.
It is conceivable that an event may be a subset that includes the entire sample spaceS or a subset ofS called the null set and denoted by the symbolφ, which contains no elements at all. For instance, if we let A be the event of detecting a microscopic organism by the naked eye in a biological experiment, then A = φ. Also, if
B ={x|xis an even factor of 7},
thenBmust be the null set, since the only possible factors of 7 are the odd numbers 1 and 7.
Consider an experiment where the smoking habits of the employees of a man-ufacturing firm are recorded. A possible sample space might classify an individual as a nonsmoker, a light smoker, a moderate smoker, or a heavy smoker. Let the subset of smokers be some event. Then all the nonsmokers correspond to a different event, also a subset ofS, which is called thecomplementof the set of smokers.
Definition 2.3: Thecomplementof an event Awith respect to S is the subset of all elements
ofS that are not inA. We denote the complement ofA by the symbolA′.
Example 2.5: LetRbe the event that a red card is selected from an ordinary deck of 52 playing cards, and let S be the entire deck. Then R′ is the event that the card selected
from the deck is not a red card but a black card.
Example 2.6: Consider the sample space
S={book, cell phone, mp3, paper, stationery, laptop}.
Let A = {book, stationery, laptop, paper}. Then the complement of A is A′ =
{cell phone, mp3}.
We now consider certain operations with events that will result in the formation of new events. These new events will be subsets of the same sample space as the given events. Suppose thatAandB are two events associated with an experiment. In other words,AandB are subsets of the same sample spaceS. For example, in the tossing of a die we might letA be the event that an even number occurs and B the event that a number greater than 3 shows. Then the subsets A={2,4,6}
andB ={4,5,6} are subsets of the same sample space
S={1,2,3,4,5,6}.
Note that bothAandB will occur on a given toss if the outcome is an element of the subset{4,6}, which is just the intersectionofAandB.
Definition 2.4: Theintersection of two eventsA andB, denoted by the symbol A∩B, is the
event containing all elements that are common toAandB.
Example 2.8: LetV ={a, e, i, o, u}andC ={l, r, s, t}; then it follows thatV ∩C=φ. That is, V andC have no elements in common and, therefore, cannot both simultaneously occur.
For certain statistical experiments it is by no means unusual to define two events, AandB, that cannot both occur simultaneously. The eventsAandB are then said to bemutually exclusive. Stated more formally, we have the following definition:
Definition 2.5: Two events A andB aremutually exclusive, or disjoint, if A∩B =φ, that
is, ifAandB have no elements in common.
Example 2.9: A cable television company offers programs on eight different channels, three of which are affiliated with ABC, two with NBC, and one with CBS. The other two are an educational channel and the ESPN sports channel. Suppose that a person subscribing to this service turns on a television set without first selecting the channel. LetAbe the event that the program belongs to the NBC network and B the event that it belongs to the CBS network. Since a television program cannot belong to more than one network, the eventsAandBhave no programs in common. Therefore, the intersection A ∩ B contains no programs, and consequently the events AandB are mutually exclusive.
Often one is interested in the occurrence of at least one of two events associated with an experiment. Thus, in the die-tossing experiment, if
A={2,4,6}andB ={4,5,6},
we might be interested in eitherAorBoccurring or bothAandBoccurring. Such an event, called theunionofAand B, will occur if the outcome is an element of the subset{2,4,5,6}.
Definition 2.6: Theunionof the two eventsAandB, denoted by the symbolA∪B, is the event
containing all the elements that belong toAorB or both.
Example 2.10: LetA={a, b, c}andB ={b, c, d, e}; thenA∪B={a, b, c, d, e}.
Example 2.11: LetP be the event that an employee selected at random from an oil drilling com-pany smokes cigarettes. Let Q be the event that the employee selected drinks alcoholic beverages. Then the event P∪Qis the set of all employees who either drink or smoke or do both.
Example 2.12: IfM ={x|3< x <9} andN ={y|5< y <12}, then
M∪N ={z| 3< z <12}.
The relationship between events and the corresponding sample space can be illustrated graphically by means of Venn diagrams. In a Venn diagram we let the sample space be a rectangle and represent events by circles drawn inside the rectangle. Thus, in Figure 2.3, we see that
A B
C
S
1
4 3
2
7 6
5
Figure 2.3: Events represented by various regions.
A∪C= regions 1, 2, 3, 4, 5, and 7, B′∩A= regions 4 and 7,
A∩B∩C= region 1,
(A∪B)∩C′= regions 2, 6, and 7,
and so forth.
A
B C
S
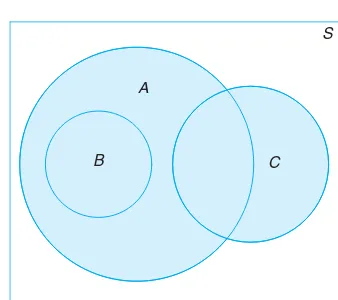
Figure 2.4: Events of the sample spaceS.
In Figure 2.4, we see that events A, B, and C are all subsets of the sample space S. It is also clear that event B is a subset of eventA; eventB∩C has no elements and henceB andCare mutually exclusive; event A∩C has at least one element; and event A∪B = A. Figure 2.4 might, therefore, depict a situation where we select a card at random from an ordinary deck of 52 playing cards and observe whether the following events occur:
42 Chapter 2 Probability
B: the card is the jack, queen, or king of diamonds, C: the card is an ace.
Clearly, the event A∩C consists of only the two red aces.
Several results that follow from the foregoing definitions, which may easily be verified by means of Venn diagrams, are as follows:
1. A∩φ=φ.
2.1 List the elements of each of the following sample spaces:
(a) the set of integers between 1 and 50 divisible by 8; (b) the setS={x|x2+ 4
x−5 = 0};
(c) the set of outcomes when a coin is tossed until a tail or three heads appear;
(d) the setS={x|xis a continent}; (e) the setS={x|2x−4≥0 andx <1}.
2.2 Use the rule method to describe the sample space S consisting of all points in the first quadrant inside a circle of radius 3 with center at the origin.
2.3 Which of the following events are equal? (a)A={1,3};
2.4 An experiment involves tossing a pair of dice, one green and one red, and recording the numbers that come up. If x equals the outcome on the green die andythe outcome on the red die, describe the sample spaceS
(a) by listing the elements (x, y); (b) by using the rule method.
2.5 An experiment consists of tossing a die and then flipping a coin once if the number on the die is even. If the number on the die is odd, the coin is flipped twice. Using the notation 4H, for example, to denote the out-come that the die out-comes up 4 and then the coin out-comes up heads, and 3HT to denote the outcome that the die
comes up 3 followed by a head and then a tail on the coin, construct a tree diagram to show the 18 elements of the sample spaceS.
2.6 Two jurors are selected from 4 alternates to serve at a murder trial. Using the notationA1A3, for
exam-ple, to denote the simple event that alternates 1 and 3 are selected, list the 6 elements of the sample spaceS.
2.7 Four students are selected at random from a chemistry class and classified as male or female. List the elements of the sample space S1, using the letter
M for male andF for female. Define a second sample spaceS2 where the elements represent the number of
females selected.
2.8 For the sample space of Exercise 2.4,
(a) list the elements corresponding to the eventAthat the sum is greater than 8;
(b) list the elements corresponding to the eventBthat a 2 occurs on either die;
(c) list the elements corresponding to the eventCthat a number greater than 4 comes up on the green die; (d) list the elements corresponding to the eventA∩C; (e) list the elements corresponding to the eventA∩B; (f) list the elements corresponding to the eventB∩C; (g) construct a Venn diagram to illustrate the
intersec-tions and unions of the eventsA,B, andC.
2.9 For the sample space of Exercise 2.5,
(a) list the elements corresponding to the eventAthat a number less than 3 occurs on the die;
(b) list the elements corresponding to the eventBthat two tails occur;
Exercises 43
(d) list the elements corresponding to the eventA′∩B; (e) list the elements corresponding to the eventA∪B.
2.10 An engineering firm is hired to determine if cer-tain waterways in Virginia are safe for fishing. Samples are taken from three rivers.
(a) List the elements of a sample space S, using the lettersF for safe to fish andN for not safe to fish. (b) List the elements of S corresponding to event E that at least two of the rivers are safe for fishing. (c) Define an event that has as its elements the points
{F F F, N F F, F F N, N F N}.
2.11 The resum´es of two male applicants for a college teaching position in chemistry are placed in the same file as the resum´es of two female applicants. Two po-sitions become available, and the first, at the rank of assistant professor, is filled by selecting one of the four applicants at random. The second position, at the rank of instructor, is then filled by selecting at random one of the remaining three applicants. Using the notation M2F1, for example, to denote the simple event that
the first position is filled by the second male applicant and the second position is then filled by the first female applicant,
(a) list the elements of a sample spaceS;
(b) list the elements ofScorresponding to eventAthat the position of assistant professor is filled by a male applicant;
(c) list the elements ofScorresponding to eventBthat exactly one of the two positions is filled by a male applicant;
(d) list the elements ofScorresponding to eventCthat neither position is filled by a male applicant; (e) list the elements of S corresponding to the event
A∩B;
(f) list the elements of S corresponding to the event A∪C;
(g) construct a Venn diagram to illustrate the intersec-tions and unions of the eventsA,B, andC.
2.12 Exercise and diet are being studied as possi-ble substitutes for medication to lower blood pressure. Three groups of subjects will be used to study the ef-fect of exercise. Group 1 is sedentary, while group 2 walks and group 3 swims for 1 hour a day. Half of each of the three exercise groups will be on a salt-free diet. An additional group of subjects will not exercise or re-strict their salt, but will take the standard medication. UseZ for sedentary,W for walker,S for swimmer,Y for salt, N for no salt, M for medication, andF for medication free.
(a) Show all of the elements of the sample spaceS.
(b) Given that A is the set of nonmedicated subjects and B is the set of walkers, list the elements of A∪B.
(c) List the elements ofA∩B.
2.13 Construct a Venn diagram to illustrate the pos-sible intersections and unions for the following events relative to the sample space consisting of all automo-biles made in the United States.
F: Four door,S: Sun roof,P: Power steering.
2.14 If S = {0,1,2,3,4,5,6,7,8,9} and A = {0,2,4,6,8}, B = {1,3,5,7,9}, C = {2,3,4,5}, and D={1,6,7}, list the elements of the sets correspond-ing to the followcorrespond-ing events:
(a)A∪C;
2.15 Consider the sample spaceS={copper, sodium, nitrogen, potassium, uranium, oxygen, zinc} and the events
A={copper, sodium, zinc}, B={sodium, nitrogen, potassium}, C={oxygen}.
List the elements of the sets corresponding to the fol-lowing events: ple space S. Using Venn diagrams, shade the areas representing the following events:
2.18 Which of the following pairs of events are mutu-ally exclusive?
(a) A golfer scoring the lowest 18-hole round in a 72-hole tournament and losing the tournament. (b) A poker player getting a flush (all cards in the same
suit) and 3 of a kind on the same 5-card hand. (c) A mother giving birth to a baby girl and a set of
twin daughters on the same day.
(d) A chess player losing the last game and winning the match.
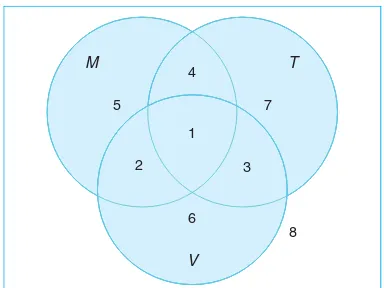
2.19 Suppose that a family is leaving on a summer vacation in their camper and thatM is the event that they will experience mechanical problems, T is the event that they will receive a ticket for committing a traffic violation, and V is the event that they will ar-rive at a campsite with no vacancies. Referring to the Venn diagram of Figure 2.5, state in words the events represented by the following regions:
(a) region 5;
(b) region 3;
(c) regions 1 and 2 together; (d) regions 4 and 7 together;
(e) regions 3, 6, 7, and 8 together.
2.20 Referring to Exercise 2.19 and the Venn diagram of Figure 2.5, list the numbers of the regions that rep-resent the following events:
(a) The family will experience no mechanical problems and will not receive a ticket for a traffic violation but will arrive at a campsite with no vacancies. (b) The family will experience both mechanical
prob-lems and trouble in locating a campsite with a va-cancy but will not receive a ticket for a traffic vio-lation.
(c) The family will either have mechanical trouble or arrive at a campsite with no vacancies but will not receive a ticket for a traffic violation.
(d) The family will not arrive at a campsite with no vacancies.
M T
V
1
2 3
4
5 7
6
8
Figure 2.5: Venn diagram for Exercises 2.19 and 2.20.
2.3
Counting Sample Points
Rule 2.1: If an operation can be performed inn1ways, and if for each of these ways a second operation can be performed inn2ways, then the two operations can be performed together in n1n2 ways.
Example 2.13: How many sample points are there in the sample space when a pair of dice is thrown once?
Solution:The first die can land face-up in any one ofn1= 6 ways. For each of these 6 ways, the second die can also land face-up inn2 = 6 ways. Therefore, the pair of dice can land inn1n2= (6)(6) = 36 possible ways.
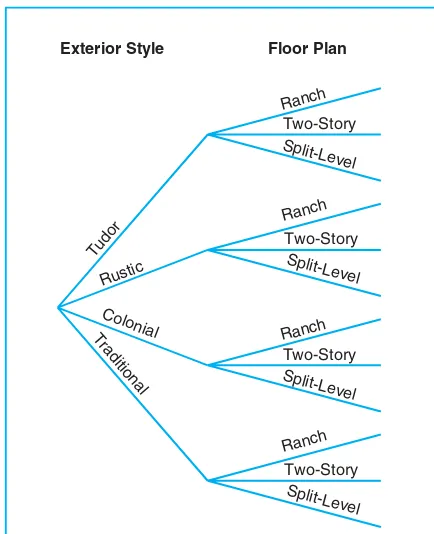
Example 2.14: A developer of a new subdivision offers prospective home buyers a choice of Tudor, rustic, colonial, and traditional exterior styling in ranch, two-story, and split-level floor plans. In how many different ways can a buyer order one of these homes?
Exterior Style Floor Plan
Tudor
Rustic
Colonial Traditional
Split-Level
Split-Level
Two-Story
Two-Story
Ranch
Ranch
Split-Level
Split-Level
Two-Story
Two-Story
Ranch
Ranch
Figure 2.6: Tree diagram for Example 2.14.
Solution:Sincen1= 4 andn2= 3, a buyer must choose from
n1n2= (4)(3) = 12 possible homes.
in Example 2.14 there will be n1 = 4 branches corresponding to the different exterior styles, and then there will be n2 = 3 branches extending from each of these 4 branches to represent the different floor plans. This tree diagram yields the n1n2 = 12 choices of homes given by the paths along the branches, as illustrated in Figure 2.6.
Example 2.15: If a 22-member club needs to elect a chair and a treasurer, how many different ways can these two to be elected?
Solution: For the chair position, there are 22 total possibilities. For each of those 22 pos-sibilities, there are 21 possibilities to elect the treasurer. Using the multiplication rule, we obtainn1×n2= 22×21 = 462 different ways.
The multiplication rule, Rule 2.1 may be extended to cover any number of operations. Suppose, for instance, that a customer wishes to buy a new cell phone and can choose from n1 = 5 brands,n2= 5 sets of capability, and n3= 4 colors. These three classifications result in n1n2n3 = (5)(5)(4) = 100 different ways for a customer to order one of these phones. The generalized multiplication rule
coveringkoperations is stated in the following.
Rule 2.2: If an operation can be performed in n1 ways, and if for each of these a second operation can be performed in n2 ways, and for each of the first two a third operation can be performed in n3 ways, and so forth, then the sequence of k operations can be performed inn1n2· · ·nk ways.
Example 2.16: Sam is going to assemble a computer by himself. He has the choice of chips from two brands, a hard drive from four, memory from three, and an accessory bundle from five local stores. How many different ways can Sam order the parts?
Solution:Sincen1= 2,n2= 4, n3= 3, and n4= 5, there are
nl×n2×n3×n4= 2×4×3×5 = 120
different ways to order the parts.
Example 2.17: How many even four-digit numbers can be formed from the digits 0, 1, 2, 5, 6, and 9 if each digit can be used only once?
Solution:Since the number must be even, we have onlyn1= 3 choices for the units position. However, for a four-digit number the thousands position cannot be 0. Hence, we consider the units position in two parts, 0 or not 0. If the units position is 0 (i.e., n1= 1), we haven2= 5 choices for the thousands position,n3= 4 for the hundreds position, and n4= 3 for the tens position. Therefore, in this case we have a total of
n1n2n3n4= (1)(5)(4)(3) = 60
even four-digit numbers. On the other hand, if the units position is not 0 (i.e., n1= 2), we haven2= 4 choices for the thousands position,n3= 4 for the hundreds position, and n4= 3 for the tens position. In this situation, there are a total of
even four-digit numbers.
Since the above two cases are mutually exclusive, the total number of even four-digit numbers can be calculated as 60 + 96 = 156.
Frequently, we are interested in a sample space that contains as elements all possible orders or arrangements of a group of objects. For example, we may want to know how many different arrangements are possible for sitting 6 people around a table, or we may ask how many different orders are possible for drawing 2 lottery tickets from a total of 20. The different arrangements are calledpermutations.
Definition 2.7: Apermutationis an arrangement of all or part of a set of objects.
Consider the three lettersa, b, and c. The possible permutations are abc,acb, bac,bca,cab, andcba. Thus, we see that there are 6 distinct arrangements. Using Rule 2.2, we could arrive at the answer 6 without actually listing the different orders by the following arguments: There aren1= 3 choices for the first position. No matter which letter is chosen, there are always n2 = 2 choices for the second position. No matter which two letters are chosen for the first two positions, there is onlyn3= 1 choice for the last position, giving a total of
n1n2n3= (3)(2)(1) = 6 permutations by Rule 2.2. In general,ndistinct objects can be arranged in
n(n−1)(n−2)· · ·(3)(2)(1) ways.
There is a notation for such a number.
Definition 2.8: For any non-negative integern,n!, called “nfactorial,” is defined as
n! =n(n−1)· · ·(2)(1),
with special case 0! = 1.
Using the argument above, we arrive at the following theorem.
Theorem 2.1: The number of permutations ofnobjects isn!.
The number of permutations of the four lettersa, b, c, and dwill be 4! = 24. Now consider the number of permutations that are possible by taking two letters at a time from four. These would beab, ac, ad,ba,bc, bd,ca,cb, cd, da, db, and dc. Using Rule 2.1 again, we have two positions to fill, with n1= 4 choices for the first and thenn2= 3 choices for the second, for a total of
n1n2= (4)(3) = 12
permutations. In general,ndistinct objects takenrat a time can be arranged in
n(n−1)(n−2)· · ·(n−r+ 1)
ways. We represent this product by the symbol
nPr=
As a result, we have the theorem that follows.
Theorem 2.2: The number of permutations ofndistinct objects takenrat a time is
nPr=
n! (n−r)!.
Example 2.18: In one year, three awards (research, teaching, and service) will be given to a class of 25 graduate students in a statistics department. If each student can receive at most one award, how many possible selections are there?
Solution: Since the awards are distinguishable, it is a permutation problem. The total number of sample points is
25P3= 25! (25−3)! =
25!
22! = (25)(24)(23) = 13,800.
Example 2.19: A president and a treasurer are to be chosen from a student club consisting of 50 people. How many different choices of officers are possible if
(a) there are no restrictions;
(b) A will serve only if he is president; (c) B andC will serve together or not at all; (d) D andE will not serve together?
Solution: (a) The total number of choices of officers, without any restrictions, is
50P2= 50!
48! = (50)(49) = 2450.
(b) SinceAwill serve only if he is president, we have two situations here: (i)Ais selected as the president, which yields 49 possible outcomes for the treasurer’s position, or (ii) officers are selected from the remaining 49 people withoutA, which has the number of choices49P2= (49)(48) = 2352. Therefore, the total number of choices is 49 + 2352 = 2401.
(c) The number of selections whenB andC serve together is 2. The number of selections when bothB andC are not chosen is48P2= 2256. Therefore, the total number of choices in this situation is 2 + 2256 = 2258.
Permutations that occur by arranging objects in a circle are called circular permutations. Two circular permutations are not considered different unless corresponding objects in the two arrangements are preceded or followed by a dif-ferent object as we proceed in a clockwise direction. For example, if 4 people are playing bridge, we do not have a new permutation if they all move one position in a clockwise direction. By considering one person in a fixed position and arranging the other three in 3! ways, we find that there are 6 distinct arrangements for the bridge game.
Theorem 2.3: The number of permutations ofnobjects arranged in a circle is (n−1)!.
So far we have considered permutations of distinct objects. That is, all the objects were completely different or distinguishable. Obviously, if the lettersband c are both equal to x, then the 6 permutations of the letters a, b, and c become axx,axx,xax,xax,xxa, andxxa, of which only 3 are distinct. Therefore, with 3 letters, 2 being the same, we have 3!/2! = 3 distinct permutations. With 4 different letters a, b, c, and d, we have 24 distinct permutations. If we let a=b =xand c=d=y, we can list only the following distinct permutations: xxyy,xyxy,yxxy, yyxx,xyyx, andyxyx. Thus, we have 4!/(2! 2!) = 6 distinct permutations.
Theorem 2.4: The number of distinct permutations of nthings of whichn1 are of one kind, n2 of a second kind, . . .,nk of a kth kind is
n! n1!n2!· · ·nk!
.
Example 2.20: In a college football training session, the defensive coordinator needs to have 10 players standing in a row. Among these 10 players, there are 1 freshman, 2 sopho-mores, 4 juniors, and 3 seniors. How many different ways can they be arranged in a row if only their class level will be distinguished?
Solution:Directly using Theorem 2.4, we find that the total number of arrangements is
10!
1! 2! 4! 3! = 12,600.
Often we are concerned with the number of ways of partitioning a set of n objects intorsubsets calledcells. A partition has been achieved if the intersection of every possible pair of the r subsets is the empty set φ and if the union of all subsets gives the original set. The order of the elements within a cell is of no importance. Consider the set{a, e, i, o, u}. The possible partitions into two cells in which the first cell contains 4 elements and the second cell 1 element are
{(a, e, i, o),(u)},{(a, i, o, u),(e)},{(e, i, o, u),(a)},{(a, e, o, u),(i)},{(a, e, i, u),(o)}.
The number of partitions for this illustration is denoted by the symbol
where the top number represents the total number of elements and the bottom numbers represent the number of elements going into each cell. We state this more generally in Theorem 2.5.
Theorem 2.5: The number of ways of partitioning a set ofnobjects intorcells withn1elements in the first cell,n2 elements in the second, and so forth, is
Example 2.21: In how many ways can 7 graduate students be assigned to 1 triple and 2 double hotel rooms during a conference?
Solution:The total number of possible partitions would be
In many problems, we are interested in the number of ways of selectingrobjects from n without regard to order. These selections are called combinations. A combination is actually a partition with two cells, the one cell containing the r objects selected and the other cell containing the (n−r) objects that are left. The number of such combinations, denoted by
n
r, n−r
, is usually shortened to n
r
,
since the number of elements in the second cell must be n−r.
Theorem 2.6: The number of combinations ofndistinct objects takenrat a time is
Example 2.22: A young boy asks his mother to get 5 Game-BoyTM
cartridges from his collection of 10 arcade and 5 sports games. How many ways are there that his mother can get 3 arcade and 2 sports games?
Solution:The number of ways of selecting 3 cartridges from 10 is
10 3
= 10!
3! (10−3)! = 120.
The number of ways of selecting 2 cartridges from 5 is
5 2
Exercises 51
Using the multiplication rule (Rule 2.1) with n1 = 120 and n2 = 10, we have (120)(10) = 1200 ways.
Example 2.23: How many different letter arrangements can be made from the letters in the word STATISTICS?
Solution:Using the same argument as in the discussion for Theorem 2.6, in this example we can actually apply Theorem 2.5 to obtain
10
3,3,2,1,1
= 10!
3! 3! 2! 1! 1! = 50,400.
Here we have 10 total letters, with 2 letters (S,T) appearing 3 times each, letter I appearing twice, and lettersA andC appearing once each. On the other hand, this result can be directly obtained by using Theorem 2.4.
Exercises
2.21 Registrants at a large convention are offered 6 sightseeing tours on each of 3 days. In how many ways can a person arrange to go on a sightseeing tour planned by this convention?
2.22 In a medical study, patients are classified in 8 ways according to whether they have blood typeAB+, AB−,A+
,A−,B+
,B−,O+
, orO−, and also accord-ing to whether their blood pressure is low, normal, or high. Find the number of ways in which a patient can be classified.
2.23 If an experiment consists of throwing a die and then drawing a letter at random from the English alphabet, how many points are there in the sample space?
2.24 Students at a private liberal arts college are clas-sified as being freshmen, sophomores, juniors, or se-niors, and also according to whether they are male or female. Find the total number of possible classifica-tions for the students of that college.
2.25 A certain brand of shoes comes in 5 different styles, with each style available in 4 distinct colors. If the store wishes to display pairs of these shoes showing all of its various styles and colors, how many different pairs will the store have on display?
2.26 A California study concluded that following 7 simple health rules can extend a man’s life by 11 years on the average and a woman’s life by 7 years. These 7 rules are as follows: no smoking, get regular exer-cise, use alcohol only in moderation, get 7 to 8 hours of sleep, maintain proper weight, eat breakfast, and do
not eat between meals. In how many ways can a person adopt 5 of these rules to follow
(a) if the person presently violates all 7 rules? (b) if the person never drinks and always eats
break-fast?
2.27 A developer of a new subdivision offers a prospective home buyer a choice of 4 designs, 3 differ-ent heating systems, a garage or carport, and a patio or screened porch. How many different plans are available to this buyer?
2.28 A drug for the relief of asthma can be purchased from 5 different manufacturers in liquid, tablet, or capsule form, all of which come in regular and extra strength. How many different ways can a doctor pre-scribe the drug for a patient suffering from asthma?
2.29 In a fuel economy study, each of 3 race cars is tested using 5 different brands of gasoline at 7 test sites located in different regions of the country. If 2 drivers are used in the study, and test runs are made once un-der each distinct set of conditions, how many test runs are needed?
2.30 In how many different ways can a true-false test consisting of 9 questions be answered?
2.32 (a) In how many ways can 6 people be lined up to get on a bus?
(b) If 3 specific persons, among 6, insist on following each other, how many ways are possible?
(c) If 2 specific persons, among 6, refuse to follow each other, how many ways are possible?
2.33 If a multiple-choice test consists of 5 questions, each with 4 possible answers of which only 1 is correct, (a) in how many different ways can a student check off
one answer to each question?
(b) in how many ways can a student check off one answer to each question and get all the answers wrong?
2.34 (a) How many distinct permutations can be made from the letters of the wordCOLUMNS? (b) How many of these permutations start with the
let-terM?
2.35 A contractor wishes to build 9 houses, each dif-ferent in design. In how many ways can he place these houses on a street if 6 lots are on one side of the street and 3 lots are on the opposite side?
2.36 (a) How many three-digit numbers can be formed from the digits 0, 1, 2, 3, 4, 5, and 6 if each digit can be used only once?
(b) How many of these are odd numbers? (c) How many are greater than 330?
2.37 In how many ways can 4 boys and 5 girls sit in a row if the boys and girls must alternate?
2.38 Four married couples have bought 8 seats in the same row for a concert. In how many different ways can they be seated
(a) with no restrictions?
(b) if each couple is to sit together?
(c) if all the men sit together to the right of all the women?
2.39 In a regional spelling bee, the 8 finalists consist of 3 boys and 5 girls. Find the number of sample points in the sample spaceSfor the number of possible orders at the conclusion of the contest for
(a) all 8 finalists; (b) the first 3 positions.
2.40 In how many ways can 5 starting positions on a basketball team be filled with 8 men who can play any of the positions?
2.41 Find the number of ways that 6 teachers can be assigned to 4 sections of an introductory psychol-ogy course if no teacher is assigned to more than one section.
2.42 Three lottery tickets for first, second, and third prizes are drawn from a group of 40 tickets. Find the number of sample points inSfor awarding the 3 prizes if each contestant holds only 1 ticket.
2.43 In how many ways can 5 different trees be planted in a circle?
2.44 In how many ways can a caravan of 8 covered wagons from Arizona be arranged in a circle?
2.45 How many distinct permutations can be made from the letters of the wordIN F IN IT Y?
2.46 In how many ways can 3 oaks, 4 pines, and 2 maples be arranged along a property line if one does not distinguish among trees of the same kind?
2.47 How many ways are there to select 3 candidates from 8 equally qualified recent graduates for openings in an accounting firm?
2.48 How many ways are there that no two students will have the same birth date in a class of size 60?
2.4
Probability of an Event
and scientific research. For these predictions and generalizations to be reasonably accurate, an understanding of basic probability theory is essential.
What do we mean when we make the statement “John will probably win the tennis match,” or “I have a fifty-fifty chance of getting an even number when a die is tossed,” or “The university is not likely to win the football game tonight,” or “Most of our graduating class will likely be married within 3 years”? In each case, we are expressing an outcome of which we are not certain, but owing to past information or from an understanding of the structure of the experiment, we have some degree of confidence in the validity of the statement.
Throughout the remainder of this chapter, we consider only those experiments for which the sample space contains a finite number of elements. The likelihood of the occurrence of an event resulting from such a statistical experiment is evaluated by means of a set of real numbers, calledweightsorprobabilities, ranging from 0 to 1. To every point in the sample space we assign a probability such that the sum of all probabilities is 1. If we have reason to believe that a certain sample point is quite likely to occur when the experiment is conducted, the probability assigned should be close to 1. On the other hand, a probability closer to 0 is assigned to a sample point that is not likely to occur. In many experiments, such as tossing a coin or a die, all the sample points have the same chance of occurring and are assigned equal probabilities. For points outside the sample space, that is, for simple events that cannot possibly occur, we assign a probability of 0.
To find the probability of an eventA, we sum all the probabilities assigned to the sample points inA. This sum is called theprobability ofA and is denoted byP(A).
Definition 2.9: Theprobabilityof an eventAis the sum of the weights of all sample points in
A. Therefore,
0≤P(A)≤1, P(φ) = 0, and P(S) = 1.
Furthermore, ifA1,A2, A3, . . . is a sequence of mutually exclusive events, then
P(A1∪A2∪A3∪ · · ·) =P(A1) +P(A2) +P(A3) +· · ·.
Example 2.24: A coin is tossed twice. What is the probability that at least 1 head occurs? Solution:The sample space for this experiment is
S ={HH, HT, T H, T T}.
If the coin is balanced, each of these outcomes is equally likely to occur. Therefore, we assign a probability ofω to each sample point. Then 4ω= 1, orω = 1/4. If A represents the event of at least 1 head occurring, then
A={HH, HT, T H} andP(A) =1 4 +
1 4 +
1 4 =
3 4.
Solution: The sample space is S = {1,2,3,4,5,6}. We assign a probability of w to each odd number and a probability of 2w to each even number. Since the sum of the probabilities must be 1, we have 9w = 1 orw= 1/9. Hence, probabilities of 1/9 and 2/9 are assigned to each odd and even number, respectively. Therefore,
E={1,2,3}andP(E) = 1 9 +
2 9 +
1 9 =
4 9.
Example 2.26: In Example 2.25, let A be the event that an even number turns up and letB be the event that a number divisible by 3 occurs. FindP(A∪B) andP(A∩B). Solution:For the eventsA={2,4,6} andB={3,6}, we have
A∪B={2,3,4,6} andA∩B={6}.
By assigning a probability of 1/9 to each odd number and 2/9 to each even number, we have
P(A∪B) = 2 9 +
1 9 +
2 9+
2 9 =
7
9 and P(A∩B) = 2 9.
If the sample space for an experiment contains N elements, all of which are equally likely to occur, we assign a probability equal to 1/N to each of the N points. The probability of any event A containingn of these N sample points is then the ratio of the number of elements in Ato the number of elements inS.
Rule 2.3: If an experiment can result in any one ofN different equally likely outcomes, and if exactlynof these outcomes correspond to eventA, then the probability of event Ais
P(A) = n N.
Example 2.27: A statistics class for engineers consists of 25 industrial, 10 mechanical, 10 electrical, and 8 civil engineering students. If a person is randomly selected by the instruc-tor to answer a question, find the probability that the student chosen is (a) an industrial engineering major and (b) a civil engineering or an electrical engineering major.
Solution:Denote byI,M,E, andCthe students majoring in industrial, mechanical, electri-cal, and civil engineering, respectively. The total number of students in the class is 53, all of whom are equally likely to be selected.
(a) Since 25 of the 53 students are majoring in industrial engineering, the prob-ability of eventI, selecting an industrial engineering major at random, is
P(I) =25 53.
(b) Since 18 of the 53 students are civil or electrical engineering majors, it follows that
Example 2.28: In a poker hand consisting of 5 cards, find the probability of holding 2 aces and 3 jacks.
Solution:The number of ways of being dealt 2 aces from 4 cards is
4 2
= 4! 2! 2! = 6,
and the number of ways of being dealt 3 jacks from 4 cards is
4 3
= 4! 3! 1! = 4.
By the multiplication rule (Rule 2.1), there aren= (6)(4) = 24 hands with 2 aces and 3 jacks. The total number of 5-card poker hands, all of which are equally likely, is
N =
52 5
= 52!
5! 47!= 2,598,960.
Therefore, the probability of getting 2 aces and 3 jacks in a 5-card poker hand is
P(C) = 24
2,598,960 = 0.9×10
−5 .
If the outcomes of an experiment are not equally likely to occur, the probabil-ities must be assigned on the basis of prior knowledge or experimental evidence. For example, if a coin is not balanced, we could estimate the probabilities of heads and tails by tossing the coin a large number of times and recording the outcomes. According to therelative frequencydefinition of probability, the true probabil-ities would be the fractions of heads and tails that occur in the long run. Another intuitive way of understanding probability is the indifferenceapproach. For in-stance, if you have a die that you believe is balanced, then using this indifference approach, you determine that the probability that each of the six sides will show up after a throw is 1/6.
To find a numerical value that represents adequately the probability of winning at tennis, we must depend on our past performance at the game as well as that of the opponent and, to some extent, our belief in our ability to win. Similarly, to find the probability that a horse will win a race, we must arrive at a probability based on the previous records of all the horses entered in the race as well as the records of the jockeys riding the horses. Intuition would undoubtedly also play a part in determining the size of the bet that we might be willing to wager. The use of intuition, personal beliefs, and other indirect information in arriving at probabilities is referred to as the subjectivedefinition of probability.
Bowl.” When opinions and prior information differ from individual to individual, subjective probability becomes the relevant resource. In Bayesian statistics (see Chapter 18), a more subjective interpretation of probability will be used, based on an elicitation of prior probability information.
2.5
Additive Rules
Often it is easiest to calculate the probability of some event from known prob-abilities of other events. This may well be true if the event in question can be represented as the union of two other events or as the complement of some event. Several important laws that frequently simplify the computation of probabilities follow. The first, called theadditive rule, applies to unions of events.
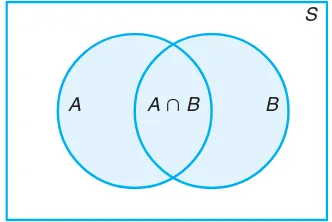
Theorem 2.7: IfAandB are two events, then
P(A∪B) =P(A) +P(B)−P(A∩B).
A A 傽 B B
S
Figure 2.7: Additive rule of probability.
Proof:Consider the Venn diagram in Figure 2.7. TheP(A∪B) is the sum of the prob-abilities of the sample points in A∪B. Now P(A) +P(B) is the sum of all the probabilities in A plus the sum of all the probabilities in B. Therefore, we have added the probabilities in (A∩B) twice. Since these probabilities add up to P(A∩B), we must subtract this probability once to obtain the sum of the probabilities in A∪B.
Corollary 2.1: IfAandB are mutually exclusive, then
P(A∪B) =P(A) +P(B).
Corollary 2.2: IfA1, A2, . . . , An are mutually exclusive, then
P(A1∪A2∪ · · · ∪An) =P(A1) +P(A2) +· · ·+P(An).
A collection of events{A1, A2, . . . , An}of a sample spaceSis called apartition
of S ifA1, A2, . . . , An are mutually exclusive and A1∪A2∪ · · · ∪An =S. Thus,
we have
Corollary 2.3: IfA1, A2, . . . , An is a partition of sample spaceS, then
P(A1∪A2∪ · · · ∪An) =P(A1) +P(A2) +· · ·+P(An) =P(S) = 1.
As one might expect, Theorem 2.7 extends in an analogous fashion.
Theorem 2.8: For three events A,B, andC,
P(A∪B∪C) =P(A) +P(B) +P(C)
−P(A∩B)−P(A∩C)−P(B∩C) +P(A∩B∩C).
Example 2.29: John is going to graduate from an industrial engineering department in a university by the end of the semester. After being interviewed at two companies he likes, he assesses that his probability of getting an offer from company A is 0.8, and his probability of getting an offer from company B is 0.6. If he believes that the probability that he will get offers from both companies is 0.5, what is the probability that he will get at least one offer from these two companies?
Solution:Using the additive rule, we have
P(A∪B) =P(A) +P(B)−P(A∩B) = 0.8 + 0.6−0.5 = 0.9.
Example 2.30: What is the probability of getting a total of 7 or 11 when a pair of fair dice is tossed?
Solution:LetA be the event that 7 occurs andB the event that 11 comes up. Now, a total of 7 occurs for 6 of the 36 sample points, and a total of 11 occurs for only 2 of the sample points. Since all sample points are equally likely, we haveP(A) = 1/6 and P(B) = 1/18. The eventsAand B are mutually exclusive, since a total of 7 and 11 cannot both occur on the same toss. Therefore,
P(A∪B) =P(A) +P(B) =1 6 +
1 18 =
2 9.
This result could also have been obtained by counting the total number of points for the eventA∪B, namely 8, and writing
P(A∪B) = n N =
8 36 =
Theorem 2.7 and its three corollaries should help the reader gain more insight into probability and its interpretation. Corollaries 2.1 and 2.2 suggest the very intuitive result dealing with the probability of occurrence of at least one of a number of events, no two of which can occur simultaneously. The probability that at least one occurs is the sum of the probabilities of occurrence of the individual events. The third corollary simply states that the highest value of a probability (unity) is assigned to the entire sample spaceS.
Example 2.31: If the probabilities are, respectively, 0.09, 0.15, 0.21, and 0.23 that a person pur-chasing a new automobile will choose the color green, white, red, or blue, what is the probability that a given buyer will purchase a new automobile that comes in one of those colors?
Solution: Let G, W, R, and B be the events that a buyer selects, respectively, a green, white, red, or blue automobile. Since these four events are mutually exclusive, the probability is
P(G∪W∪R∪B) =P(G) +P(W) +P(R) +P(B) = 0.09 + 0.15 + 0.21 + 0.23 = 0.68.
Often it is more difficult to calculate the probability that an event occurs than it is to calculate the probability that the event does not occur. Should this be the case for some event A, we simply find P(A′) first and then, using Theorem 2.7,
findP(A) by subtraction.
Theorem 2.9: IfAandA′ are complementary events, then
P(A) +P(A′) = 1.
Proof:SinceA∪A′ =S and the setsA andA′ are disjoint,
1 =P(S) =P(A∪A′) =P(A) +P(A′).
Example 2.32: If the probabilities that an automobile mechanic will service 3, 4, 5, 6, 7, or 8 or more cars on any given workday are, respectively, 0.12, 0.19, 0.28, 0.24, 0.10, and 0.07, what is the probability that he will service at least 5 cars on his next day at work?
Solution: Let E be the event that at least 5 cars are serviced. Now, P(E) = 1−P(E′),
where E′ is the event that fewer than 5 cars are serviced. Since
P(E′) = 0.12 + 0.19 = 0.31,
it follows from Theorem 2.9 that
P(E) = 1−0.31 = 0.69.
Exercises 59
the probability of randomly producing a cable with length exceeding 2010 millime-ters is equal to the probability of producing a cable with length smaller than 1990 millimeters. The probability that the production procedure meets specifications is known to be 0.99.
(a) What is the probability that a cable selected randomly is too large?
(b) What is the probability that a randomly selected cable is larger than 1990 millimeters?
Solution:LetM be the event that a cable meets specifications. LetS andL be the events that the cable is too small and too large, respectively. Then
(a) P(M) = 0.99 andP(S) =P(L) = (1−0.99)/2 = 0.005.
(b) Denoting byX the length of a randomly selected cable, we have
P(1990≤X ≤2010) =P(M) = 0.99.
SinceP(X≥2010) =P(L) = 0.005,
P(X≥1990) =P(M) +P(L) = 0.995.
This also can be solved by using Theorem 2.9:
P(X ≥1990) +P(X <1990) = 1.
Thus,P(X≥1990) = 1−P(S) = 1−0.005 = 0.995.
Exercises
2.49 Find the errors in each of the following state-ments:
(a) The probabilities that an automobile salesperson will sell 0, 1, 2, or 3 cars on any given day in Febru-ary are, respectively, 0.19, 0.38, 0.29, and 0.15. (b) The probability that it will rain tomorrow is 0.40,
and the probability that it will not rain tomorrow is 0.52.
(c) The probabilities that a printer will make 0, 1, 2, 3, or 4 or more mistakes in setting a document are, respectively, 0.19,0.34,−0.25,0.43, and 0.29. (d) On a single draw from a deck of playing cards, the
probability of selecting a heart is 1/4, the probabil-ity of selecting a black card is 1/2, and the proba-bility of selecting both a heart and a black card is 1/8.
2.50 Assuming that all elements ofS in Exercise 2.8 on page 42 are equally likely to occur, find
(a) the probability of eventA; (b) the probability of eventC; (c) the probability of eventA∩C.
2.51 A box contains 500 envelopes, of which 75 con-tain $100 in cash, 150 concon-tain $25, and 275 concon-tain $10. An envelope may be purchased for $25. What is the sample space for the different amounts of money? Assign probabilities to the sample points and then find the probability that the first envelope purchased con-tains less than $100.
2.52 Suppose that in a senior college class of 500 stu-dents it is found that 210 smoke, 258 drink alcoholic beverages, 216 eat between meals, 122 smoke and drink alcoholic beverages, 83 eat between meals and drink alcoholic beverages, 97 smoke and eat between meals, and 52 engage in all three of these bad health practices. If a member of this senior class is selected at random, find the probability that the student
(a) smokes but does not drink alcoholic beverages; (b) eats between meals and drinks alcoholic beverages
but does not smoke;
(c) neither smokes nor eats between meals.
60 Chapter 2 Probability
it will locate in Beijing, China, is 0.4, and the proba-bility that it will locate in either Shanghai or Beijing or both is 0.8. What is the probability that the industry will locate
(a) in both cities? (b) in neither city?
2.54 From past experience, a stockbroker believes that under present economic conditions a customer will invest in tax-free bonds with a probability of 0.6, will invest in mutual funds with a probability of 0.3, and will invest in both tax-free bonds and mutual funds with a probability of 0.15. At this time, find the prob-ability that a customer will invest
(a) in either tax-free bonds or mutual funds; (b) in neither tax-free bonds nor mutual funds.
2.55 If each coded item in a catalog begins with 3 distinct letters followed by 4 distinct nonzero digits, find the probability of randomly selecting one of these coded items with the first letter a vowel and the last digit even.
2.56 An automobile manufacturer is concerned about a possible recall of its best-selling four-door sedan. If there were a recall, there is a probability of 0.25 of a defect in the brake system, 0.18 of a defect in the trans-mission, 0.17 of a defect in the fuel system, and 0.40 of a defect in some other area.
(a) What is the probability that the defect is the brakes or the fueling system if the probability of defects in both systems simultaneously is 0.15?
(b) What is the probability that there are no defects in either the brakes or the fueling system?
2.57 If a letter is chosen at random from the English alphabet, find the probability that the letter
(a) is a vowel exclusive ofy;
(b) is listed somewhere ahead of the letterj; (c) is listed somewhere after the letterg.
2.58 A pair of fair dice is tossed. Find the probability of getting
(a) a total of 8;
(b) at most a total of 5.
2.59 In a poker hand consisting of 5 cards, find the probability of holding
(a) 3 aces;
(b) 4 hearts and 1 club.
2.60 If 3 books are picked at random from a shelf con-taining 5 novels, 3 books of poems, and a dictionary, what is the probability that
(a) the dictionary is selected?
(b) 2 novels and 1 book of poems are selected?
2.61 In a high school graduating class of 100 stu-dents, 54 studied mathematics, 69 studied history, and 35 studied both mathematics and history. If one of these students is selected at random, find the proba-bility that
(a) the student took mathematics or history; (b) the student did not take either of these subjects;
(c) the student took history but not mathematics.
2.62 Dom’s Pizza Company uses taste testing and statistical analysis of the data prior to marketing any new product. Consider a study involving three types of crusts (thin, thin with garlic and oregano, and thin with bits of cheese). Dom’s is also studying three sauces (standard, a new sauce with more garlic, and a new sauce with fresh basil).
(a) How many combinations of crust and sauce are in-volved?
(b) What is the probability that a judge will get a plain thin crust with a standard sauce for his first taste test?
2.63 According to Consumer Digest (July/August 1996), the probable location of personal computers (PC) in the home is as follows:
Adult bedroom: 0.03 Child bedroom: 0.15 Other bedroom: 0.14 Office or den: 0.40 Other rooms: 0.28
(a) What is the probability that a PC is in a bedroom? (b) What is the probability that it is not in a bedroom? (c) Suppose a household is selected at random from households with a PC; in what room would you expect to find a PC?
2.64 Interest centers around the life of an electronic component. Suppose it is known that the probabil-ity that the component survives for more than 6000 hours is 0.42. Suppose also that the probability that the component survivesno longer than 4000 hours is 0.04.
(a) What is the probability that the life of the compo-nent is less than or equal to 6000 hours?
Exercises 61
2.65 Consider the situation of Exercise 2.64. LetA be the event that the component fails a particular test andB be the event that the component displays strain but does not actually fail. EventAoccurs with prob-ability 0.20, and eventB occurs with probability 0.35. (a) What is the probability that the component does
not fail the test?
(b) What is the probability that the component works perfectly well (i.e., neither displays strain nor fails the test)?
(c) What is the probability that the component either fails or shows strain in the test?
2.66 Factory workers are constantly encouraged to practice zero tolerance when it comes to accidents in factories. Accidents can occur because the working en-vironment or conditions themselves are unsafe. On the other hand, accidents can occur due to carelessness or so-called human error. In addition, the worker’s shift, 7:00 A.M.–3:00 P.M.(day shift), 3:00 P.M.–11:00 P.M.(evening shift), or 11:00P.M.–7:00A.M.(graveyard shift), may be a factor. During the last year, 300 acci-dents have occurred. The percentages of the acciacci-dents for the condition combinations are as follows:
Unsafe Human Shift Conditions Error
Day 5% 32%
Evening 6% 25% Graveyard 2% 30%
If an accident report is selected randomly from the 300 reports,
(a) what is the probability that the accident occurred on the graveyard shift?
(b) what is the probability that the accident occurred due to human error?
(c) what is the probability that the accident occurred due to unsafe conditions?
(d) what is the probability that the accident occurred on either the evening or the graveyard shift?
2.67 Consider the situation of Example 2.32 on page 58.
(a) What is the probability that no more than 4 cars will be serviced by the mechanic?
(b) What is the probability that he will service fewer than 8 cars?
(c) What is the probability that he will service either 3 or 4 cars?
2.68 Interest centers around the nature of an oven purchased at a particular department store. It can be either a gas or an electric oven. Consider the decisions made by six distinct customers.
(a) Suppose that the probability is 0.40 that at most
two of these individuals purchase an electric oven. What is the probability that at least three purchase the electric oven?
(b) Suppose it is known that the probability that all six purchase the electric oven is 0.007 while 0.104 is the probability that all six purchase the gas oven. What is the probability that at least one of each type is purchased?
2.69 It is common in many industrial areas to use a filling machine to fill boxes full of product. This occurs in the food industry as well as other areas in which the product is used in the home, for example, detergent. These machines are not perfect, and indeed they mayA, fill to specification,B, underfill, and C, overfill. Generally, the practice of underfilling is that which one hopes to avoid. Let P(B) = 0.001 while P(A) = 0.990.
(a) GiveP(C).
(b) What is the probability that the machine does not underfill?
(c) What is the probability that the machine either overfills or underfills?
2.70 Consider the situation of Exercise 2.69. Suppose 50,000 boxes of detergent are produced per week and suppose also that those underfilled are “sent back,” with customers requesting reimbursement of the pur-chase price. Suppose also that the cost of production is known to be $4.00 per box while the purchase price is $4.50 per box.
(a) What is the weekly profit under the condition of no defective boxes?
(b) What is the loss in profit expected due to under-filling?
2.71 As the situation of Exercise 2.69 might suggest, statistical procedures are often used for control of qual-ity (i.e., industrial qualqual-ity control). At times, the
weightof a product is an important variable to con-trol. Specifications are given for the weight of a certain packaged product, and a package is rejected if it is ei-ther too light or too heavy. Historical data suggest that 0.95 is the probability that the product meets weight specifications whereas 0.002 is the probability that the product is too light. For each single packaged product, the manufacturer invests $20.00 in production and the purchase price for the consumer is $25.00.
(a) What is the probability that a package chosen ran-domly from the production line is too heavy? (b) For each 10,000 packages sold, what profit is
re-ceived by the manufacturer if all packages meet weight specification?
and rendered worthless, how much is the profit re-duced on 10,000 packages due to failure to meet weight specification?
2.72 Prove that
P(A′∩B′) = 1 +P(A∩B)−P(A)−P(B).
2.6
Conditional Probability, Independence, and the Product
Rule
One very important concept in probability theory is conditional probability. In some applications, the practitioner is interested in the probability structure under certain restrictions. For instance, in epidemiology, rather than studying the chance that a person from the general population has diabetes, it might be of more interest to know this probability for a distinct group such as Asian women in the age range of 35 to 50 or Hispanic men in the age range of 40 to 60. This type of probability is called a conditional probability.
Conditional Probability
The probability of an event B occurring when it is known that some event A has occurred is called aconditional probabilityand is denoted byP(B|A). The symbolP(B|A) is usually read “the probability thatBoccurs given thatAoccurs” or simply “the probability ofB, given A.”
Consider the eventB of getting a perfect square when a die is tossed. The die is constructed so that the even numbers are twice as likely to occur as the odd numbers. Based on the sample space S = {1,2,3,4,5,6}, with probabilities of 1/9 and 2/9 assigned, respectively, to the odd and even numbers, the probability of B occurring is 1/3. Now suppose that it is known that the toss of the die resulted in a number greater than 3. We are now dealing with a reduced sample spaceA={4,5,6}, which is a subset of S. To find the probability thatB occurs, relative to the space A, we must first assign new probabilities to the elements of Aproportional to their original probabilities such that their sum is 1. Assigning a probability ofw to the odd number inA and a probability of 2wto the two even numbers, we have 5w = 1, orw = 1/5. Relative to the spaceA, we find that B contains the single element 4. Denoting this event by the symbol B|A, we write B|A={4}, and hence
P(B|A) =2 5.
This example illustrates that events may have different probabilities when consid-ered relative to different sample spaces.
We can also write
P(B|A) =2 5 =
2/9 5/9 =
P(A∩B) P(A) ,
Definition 2.10: The conditional probability ofB, givenA, denoted byP(B|A), is defined by
P(B|A) = P(A∩B)
P(A) , provided P(A)>0.
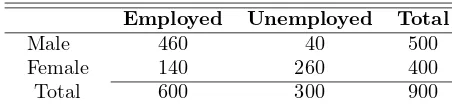
As an additional illustration, suppose that our sample spaceSis the population of adults in a small town who have completed the requirements for a college degree. We shall categorize them according to gender and employment status. The data are given in Table 2.1.
Table 2.1: Categorization of the Adults in a Small Town
Employed Unemployed Total
Male Female
460 140
40 260
500 400
Total 600 300 900
One of these individuals is to be selected at random for a tour throughout the country to publicize the advantages of establishing new industries in the town. We shall be concerned with the following events:
M: a man is chosen,
E: the one chosen is employed.
Using the reduced sample spaceE, we find that
P(M|E) = 460 600 =
23 30.
Let n(A) denote the number of elements in any set A. Using this notation, since each adult has an equal chance of being selected, we can write
P(M|E) =n(E∩M)
n(E) =
n(E∩M)/n(S) n(E)/n(S) =
P(E∩M) P(E) ,
whereP(E∩M) andP(E) are found from the original sample spaceS. To verify this result, note that
P(E) =600 900 =
2
3 and P(E∩M) = 460 900 =
23 45.
Hence,
P(M|E) =23/45 2/3 =
23 30,
as before.
(a) arrives on time, given that it departed on time, and (b) departed on time, given that it has arrived on time.
Solution:Using Definition 2.10, we have the following.
(a) The probability that a plane arrives on time, given that it departed on time, is
P(A|D) = P(D∩A)
P(D) =
0.78
0.83 = 0.94.
(b) The probability that a plane departed on time, given that it has arrived on time, is
P(D|A) = P(D∩A) P(A) =
0.78
0.82 = 0.95.
The notion of conditional probability provides the capability of reevaluating the idea of probability of an event in light of additional information, that is, when it is known that another event has occurred. The probabilityP(A|B) is an updating of P(A) based on the knowledge that event B has occurred. In Example 2.34, it is important to know the probability that the flight arrives on time. One is given the information that the flight did not depart on time. Armed with this additional information, one can calculate the more pertinent probability P(A|D′), that is,
the probability that it arrives on time, given that it did not depart on time. In many situations, the conclusions drawn from observing the more important condi-tional probability change the picture entirely. In this example, the computation of P(A|D′) is
P(A|D′) = P(A∩D′)
P(D′) =
0.82−0.78
0.17 = 0.24.
As a result, the probability of an on-time arrival is diminished severely in the presence of the additional information.
Example 2.35: The concept of conditional probability has countless uses in both industrial and biomedical applications. Consider an industrial process in the textile industry in which strips of a particular type of cloth are being produced. These strips can be defective in two ways, length and nature of texture. For the case of the latter, the process of identification is very complicated. It is known from historical information on the process that 10% of strips fail the length test, 5% fail the texture test, and only 0.8% fail both tests. If a strip is selected randomly from the process and a quick measurement identifies it as failing the length test, what is the probability that it is texture defective?
Solution:Consider the events
L: length defective, T: texture defective.
Given that the strip is length defective, the probability that this strip is texture defective is given by
P(T|L) =P(T∩L) P(L) =
0.008
0.1 = 0.08.