Conference paper
Teks penuh
Gambar

Garis besar
Dokumen terkait
Although all the pixel based classification methods were applied on the original simulated image with scale factor 1 instead of scale fac- tor 6 which was utilized for both
Figure 6: Image used in order to assess features detectors a) 3D scene used to generate the orthoimage ; b) Orthoimage obtained thanks to the 3D scene (simulated data).. Based on
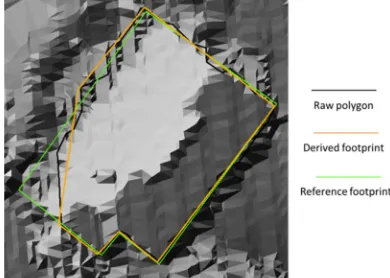
3.1.3 Mesh reconstruction After the preliminary steps of the procedure, the Z+F LaserControl ® software was left in favour of two different free and open source software:
The model was verified with simulated data and also real data of several lamp pole point clouds captured by a panoramic terrestrial LiDAR (the Faro Focus 3D) and
For the evaluation of the as-built – as-planed comparison approach a part of a point cloud is used, which generation process differs in two points from the approach
The paper aims at the analysis of noise filtering of image using wavelets and curvelets on high resolution multispectral images acquired by the Quickbird and
Wind driven currents over the western continental shelf of India were simulated by forcing OSCAT and ECMWF winds to a coastal circulation model. It is observed that
In this, the component selection of minimum noise fraction (MNF) rotation transformation was analyzed in terms of classification accuracy using constrained energy
