I hope you share this optimism about the future of the beet sugar industry in America. The ammonium salts of the acids were isolated as described and the TMS esters were prepared and analyzed by GLC.
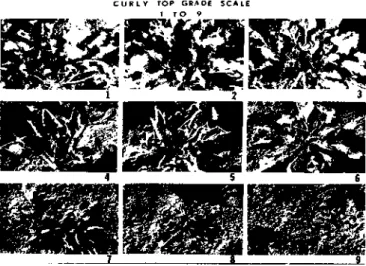
Procedure for Inducing Curly Top Epidemics in Field Plots 1
Observation shows that sedge beetles move very short distances within 3 to 4 weeks of being on the plot. This indicated that leafhoppers were feeding and inoculating plants mainly in the immediate area of the release.
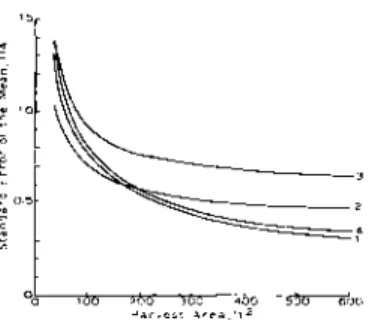
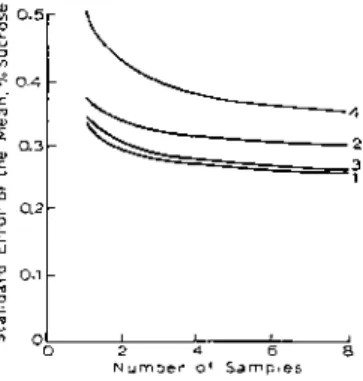
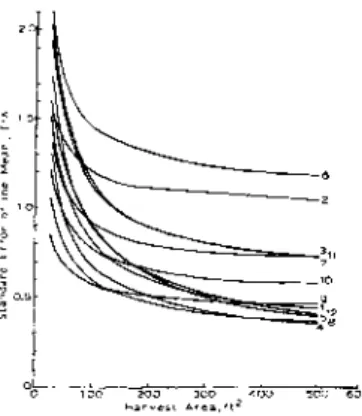
Effect of Harvest Area and Replication on Detection of Treatment Differences
From the s 2 and ss2 values shown in Table 1, predicted standard errors of the mean for varying numbers of subsamples per plot were calculated by means of equation [5]. Similarly, from the least variable Figure 1.—Predicted standard error of the mean yield as a function of crop area for twelve soil fertility experiments.
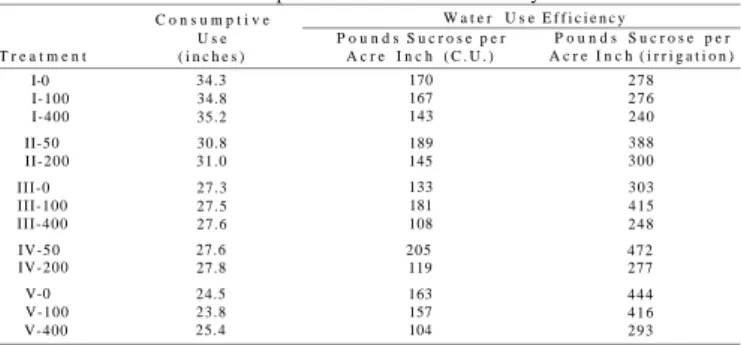
Yield and Economic Implications of Sugarbeet Production as Influenced
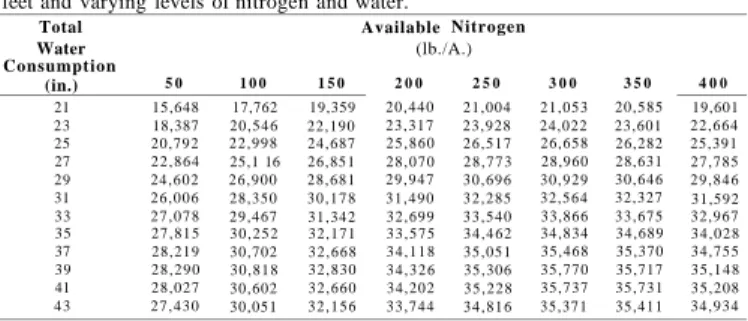
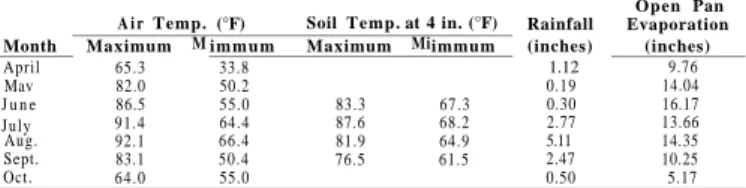
Total crop water use, as determined from irrigation, rainfall, and soil water content at the beginning and end of the season, varied almost directly with the amount of water available through irrigation (Table 4). T o model explains approximately 52 percent of the observed variation in yield and the F-statistic is significant at the 0.0012 level. In the linear formulation of the model, only the coefficient for water was significantly different from zero at the five percent probability level.
However, in the full quadratic form, none of the regression coefficients are significantly different from zero at the five percent level. The equation can also be evaluated at any other plant density within the range of observations. The estimated values for the coefficients of the base variables (S and S2) in equation [1] imply that within the range of experimental observations, the yield exhibits slightly increasing percentage returns.
The total price the grower receives is based on both the percentage sugar content of the beets and the processor's "average net return" on sugar. However, keep in mind that a fairly wide range of water and nitrogen inputs can lead to gains close to those of the optimal levels. A study and economic assessment of the effect of nitrogen fertilization and selected varieties on sugar beet production and processing.
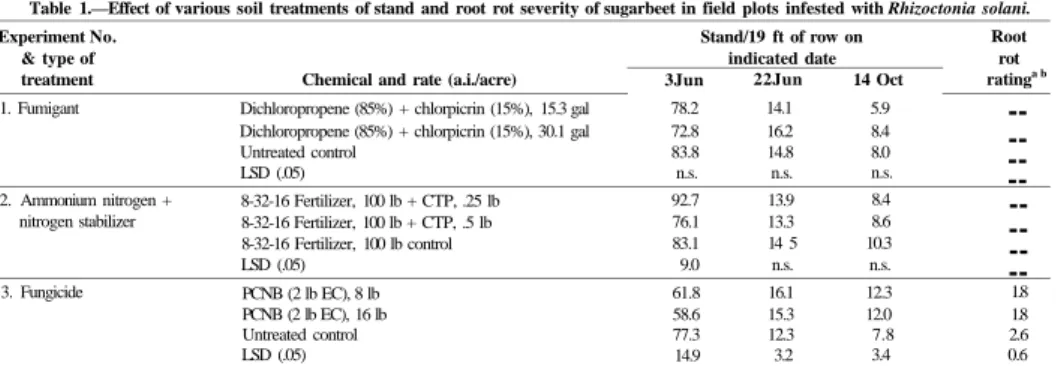
Tests with Soil Treatments and Crown Sprays to Control Rhizoctonia Crown and Root Rot
We also tested the effect of soil fumigation and ammonia-containing nitrogen fertilizer, supplemented with a nitrogen stabilizer, on the development of the disease. The part of the field where the three soil treatment experiments took place had been occupied the previous year by sugar beet plots with a high incidence of crown and root rot after inoculation with R. An aqueous suspension of the fungicide was applied at 100 gallons of pressure. acres in a 10-in. band along the drill row.
Aqueous fungicide suspensions were applied at 65 gal/acre with a hand pressure sprayer. Rates of other fungicides not currently registered for use on sugar beet were based on manufacturers' recommendations. However, the effect of these treatments under alternative conditions, such as when applied in spring instead of autumn, remains to be determined.
In the fungicide soil treatment test, June 3 seedling stands of both PCNB treatments were significantly lower than those of the untreated control. The effects of the different crown spray treatments on stands and on root rot rates are shown in Table 2. Chlorothalonil, PCNB and T P TH H applications resulted in significantly higher stands and lower root rot rates than those of the untreated control.
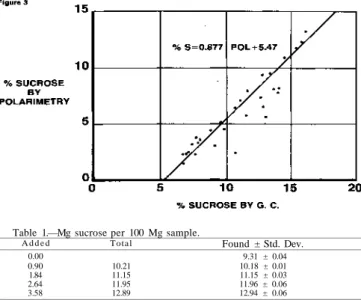
The Determination of Sucrose in Concentrated Steffen Filtrate by G.L.C
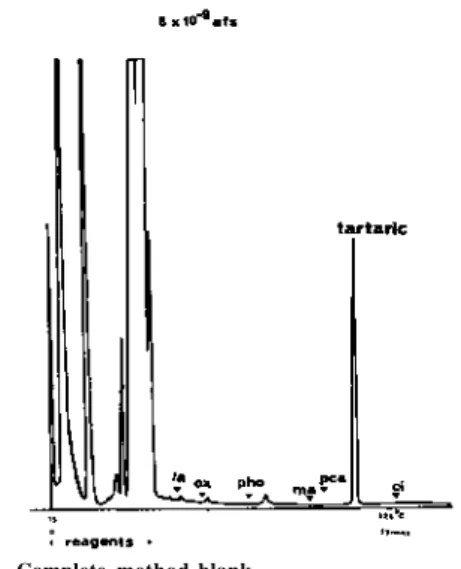
The resulting reading was multiplied by four to determine the percentage of sucrose in the sample. The pure octatrimethylsilyl ethers of sucrose and trehalose were isolated by gas chromatography and subjected to infrared and mass spectrographic analysis, Figures 1 and 2. Similarly, the sucrose and trehalose peaks of C.S.F. samples were isolated and subjected to infrared and mass spectrographic analysis. Infrared analysis of the TMS ethers of sucrose and trehalose showed the absence of a hydroxyl band at 33-3600 cm-1, indicating that both carbohydrates were fully silylated. sucrose and trehalose were significantly different in the range 900-1100 cm3, so they can be easily distinguished from each other.
Partial mass spectra recorded for pure samples of sucrose and trehalose trimethylsilyl ethers above m/e 150 are shown in Figure 2. The sucrose TMS ether produces an intense rearrangement ion at m/e 437, which has a low intensity in the trehalose spectrum, so the compounds are easy to distinguish. Significant differences in the spectra also occur in the 500–600 m/e region, a region reported (5, 10) to be of value in the assessment of glycosidic bonds.
Mass spectra of the chromatographic effluents of TMS sucrose and trehalose from C.S.F. was comparable to that of the pure standards. No impurities were detected in those samples, indicating that the sucrose and trehalose TMS peaks contain single components. amp; ASSOICATES, 1942, Polarimetry, Saccharimetry and the Sugars, National Bureau of Standards Circular, C440, U.S. 1966, Determination of Some Components in Corn Syrup by Gas-Liquid Chromatography of the Trimethylsilyl Derivatives, Cereal Chemical Experiment, McGraw-Hill Book Co., Inc., New York, p. SWEELEY, 1969, Analysis of Trimethylsilyl Derivatives of Carbohydrates by Gas Chromatography and Mass Spectrometry, J. LIBERT, 1966, Applications of Gas-Liquid Chromatography in the Sugar Industry, Proc. NORMAN, 1970, A gas-liquid chromatographic method for the determination of sucrose in molasses, presented at the Sixteenth General Meeting of the Am. Sugar Beet Technologists, Denver, Colorado.
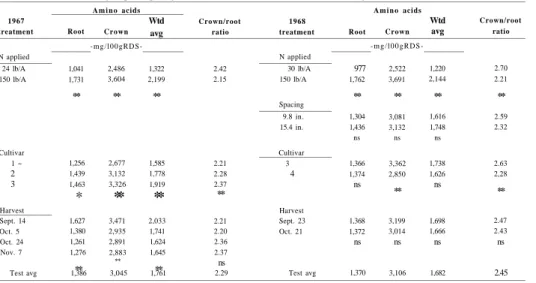
Impurities in Sugarbeet Crown and Root 1
Also, the wider spacing of beet (1968) increased K in both root and crown compared to the narrower spacing. Considerably lower levels of K were found in root and crown in October harvests each year than in September harvests. Reducing sugars in root and crown (Table 5) accounted for approximately 6 to 9% of the total impurities analyzed.
N levels, plant spacing and different cultivars had little effect on raffinose levels in roots and crowns. The sodium content in roots and crowns decreased between the first and second harvests in 1967, but remained relatively stable thereafter. Betaine accounted for 15% of the total impurities found in both the root and crown of cultivar 3.
Root and crown had 10% more betaine in width compared to the close plant spacing. Amino acids in root and crown did not decline until 1967, but potassium, sodium and reducing sugars declined both years. Charles, Michigan in 1967 and 1968, respectively, to measure individual and total impurities in the root and crown.
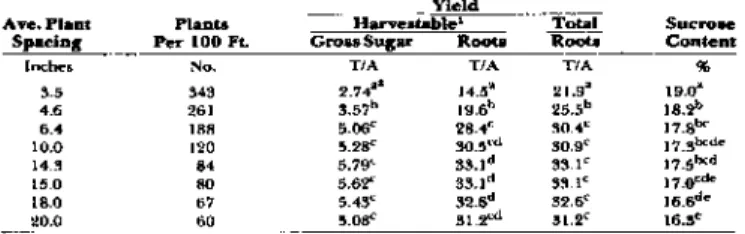
Effect of Spacing in 14-26 Inch Rows on Production of Fall Planted Sugarbeets 1
Root yields and harvested sugar decreased significantly when beets were split 4.6 inches or closer (Table 1). When the spacing was increased to 6.4 inches, the resulting root yield was lower than at some of the wider spacings; however, there were no significant differences in sugar yield. Beet was able to use the 10- to 20-inch spacings without a significant reduction in root yield or sugar.
2Means within columns followed by the same letter do not differ at the 5% level of significance based on the Student-Newman-Keul test. The reduction in sucrose concentration at the narrow spacings may have been partly due to the effects of heavy bolts. Relative yields of reduced stands of sugar beet planted at a normal date and of replanted sugar beet.
Effect of plant spacing and fertilizer on yield, purity, chemical constituents and evapotranspiration of sugar beet in Kansas. Effect of row width, plant spacing, nitrogen amount and harvest time on yield and sucrose content in sugar beet. Effect of single, double and multiple plant hill row spacing on sugar beet production.
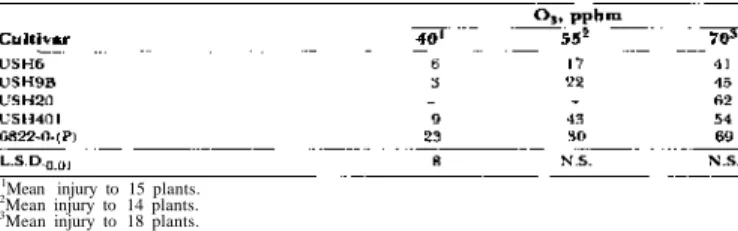
Response of Sugarbeet Cultivars to Ozone
Our tests show that the varietal responses of sugar beet to various ozone concentrations are similar to the varietal characteristics of several other crop species tested for ozone resistance. Ting and Mukerji (8) attributed this sensitivity of ozone to the existence of relatively low levels of soluble constituents in mature leaves. Their more tolerant ozone response in our tests is likely a coincidence, although some selection for ozone tolerance may have been applied due to the presence of photochemical air pollution in many areas of the state.
Tolerance to smog was not a factor in breeding SP6822-0-(P) as we have seen only one event toxic to sugar beet at Beltsville in the past 15 years. This sibling may partially explain why USH20 was not one of the more ozone tolerant hybrids. Ozone usually injures the upper surfaces of leaves, while PAN and ozone hydrocarbons (HC) damage lower surfaces.
We observed ozone damage on the lower surfaces of mature leaves and typical spots on other leaves. The field diagnosis of smog damage to sugar beet would perhaps be easier if PAN were the only pollutant, but distinguishing between ozone and ozone-HC damage is not possible because both toxins cause similar syndromes. Leaf damage to tobacco varieties as a result of ozone, ozonated hexene-1 and ambient air in metropolitan areas.
Maturity Effects on Fruit Characteristics, Germination, and Emergence of Sugarbeet 1
W. SNYDER 2
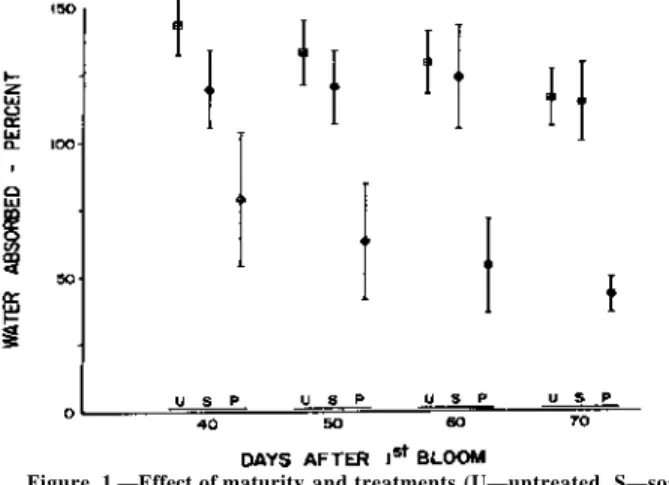
Irrigation and fruit processing significantly reduced the amount of water absorbed, especially in unripe fruits. Two cultivars (five plants) absorbed an average of 115% water at 40 days after first flowering and increased to 138% at 60 days. Irrigation treatment increased the amount of water absorbed by fruit in 14% of samples by at least 10% compared to the amount absorbed by untreated fruit.
Thus, for some cultivars, the soaking treatment appears to induce changes in the fruits at specific stages of maturity that enhance rather than suppress water absorption. As maturity progressed, fruit weight loss during processing increased, but weight loss during soaking decreased (Fig. 2). At maturity, weight loss by hand processing was approximately one quarter of the fruit weight, whereas loss by soaking was the lowest.
Weight losses among the 11 plants varied most between 40 and 50 days after first flowering and least at maturity. Germination percentages correlated inversely with water uptake, and significantly for processed fruit at 40, 50 and 60 days after first flowering (Table 3). Individuals within a cultivar tended to follow a pattern for a given set of treatments; data can thus be averaged to indicate cultivar performance.