FRACTURE CHARACTERISTIC OF NORMAL AND HIGH STRENGTH CONCRETE
USING DIFFERENT AGGREGATE GRADING
K
ARAKTERISIKF
RAKTURP
ADAB
ETONN
ORMALD
ANB
ETONM
UTUT
INGGIM
ENGGUNAKANG
RADASIA
GREGATY
ANGB
ERBEDAAtur P. N. Siregar
Dosen Jurusan Teknik Sipil, Fakultas Teknik, Universitas Tadulako, Jl. Soekarno Hatta Km. 9, Palu, Sulawesi Tengah, 94118
email: [email protected]
ABSTRACT
This paper reports and discusses the results of experimental investigation on the fracture characteristic of concrete produced with different aggregate grading. Two different aggregate grading was produced with compressive strength of 62-88 MPa. Total fracture energy (GF) and fracture toughness (KIC) was calculated as fracture parameters of concrete. Three point bend test was chosen based on RILEM recommendation to measure fracture parameters. Aggregate grading used in the concrete mix affects significantly the total dissipated fracture energy which is more than 25%. The use of aggregate grading in concrete implicate in the fracture characteristic of concrete.
Key words: aggregate grading, fracture energy, fracture toughness
ABSTRAK
Makalah ini melaporkan dan membahas hasil investigasi eksperimental tentang karakteristik fraktur beton yang diproduksi dengan gradasi agregat yang berbeda. Dua gradasi agregat yang berbeda diproduksi dengan kuat tekan 62-88 MPa. Fraktur energi total (GF) dan ketangguhan fraktur (KIC) dihitung sebagai parameter fraktur beton. Tiga titik uji lengkung dipilih berdasarkan rekomendasi RILEM untuk mengukur parameter fraktur. Gradasi agregat yang digunakan dalam campuran beton mempengaruhi secara signifikan dengan total fraktur energi yang hilang lebih dari 25%. Penggunaan gradasi agregat dalam beton berimplikasi dalam karakteristik farktur beton.
Kata-kata kunci: Gradasi agregat, energi fraktur, ketangguhan fraktur
INTRODUCTION
Concrete as a composite material has been used widely in construction. The mechanical characteristic of hardened concrete is influenced by its constituent materials. Aggregate which is the largest volume occupied in concrete mix, 60–70% or more than 70% of the total volume of concrete mix, would play important role in the mechanical behaviour of concrete (Chen and Liu, 2004). Since compressive strength is a mechanical characteristic used to identify the quality of concrete, numerous researches in developing the compressive strength of concrete seems never to cease. It is as a consequence of development on civil engineering structures such as high rise buildings and long-span bridges which need high compressive strength of concrete (Wolinski et al., 1987).
A lot of studies on the size, shape, texture, and amount of aggregates and also compressive strength of concrete have been shown to influence the fracture mechanics parameters of concrete (Nallathambi et al., 1980; Bazant and Oh, 1983; Hillerborg, 1985; Wolinski et al., 1987; Zhou et al., 1995; Wu et al., 2001; Xiao et al., 2004). Those have been investigated on normal and high strength concretes. The strength and fracture behaviour of concrete are dependent on interaction between paste matrixes and aggregates (Ribeiro et al., 2011). Aggregate grading which pro-vides specific surface area of aggregate for bonding between matrix and aggregate would also affect the stress distribution in concrete, and then the strength and fracture behaviour of
concrete. Since lack of research on investigating the effect of aggregate grading on fracture behaviour of concrete, this paper gives experimental results of fracture energy of aggregate gra-ding on normal and high strength concretes.
EXPERIMENTS
Materials
The materials used in this research were a Thames Valley river gravel with maximum size of 16 mm and minimum size of 5 mm, river sand with size ranging from 0.30 mm up to 2.36 mm, Portland Cement type I for general purpose (CEM I) with specific surface area of 338 m2/kg, fly ash EN450-S category B, a slurry-based silica fume used for high strength concrete, and a poly-carboxylate polymer based superplasticiser to allow a workability of more than 75 mm.
Table 1 shows concrete mix proportions to produce normal and high strength concrete. There are 4 type of concrete mixes; NA is concrete made for normal strength concrete with finer aggregate grading (grad-A), NB is for normal strength concrete with croaser aggregate grading (grad-B), HA is for high strength concrete with finer aggregate grading (grad-A), and HB is for high strength concrete with coarser aggregate grading (grad-B). Aggregate grading A and B is shown in Table 2 as well as Figure-1.
Table 1. Mix Proportion
Concrete Mix w/b Unit weight ( kg/m
3 )
Aggregate cement water Fly ash Silica fume Water reducer
NA 0.30 1663 567 170 - - 24
NB 0.30 1663 567 170 - - 16
HA 0.20 1663 567 163 79 57 25
Figure 1. Aggregate grading
Fresh and hardened concrete
The slump of fresh concrete, compressive strength and modulus of elasticity of hardened concrete are presented in the Table 3. All specimens which are 100 x 100 x 100 mm cubes, 100x100x500 mm beams and 150x150x300 mm prisms were demoulded after 24 ±1 hour, and then cured by water curing with temperature ranging 20oC to 25oC. The appropriate tests were carried out at 30 days.
Table 3. Fresh and hardened properties of concrete
Mix Slump Compressive strength Modulus of Elasticity
mm N* Std* MPa N* Std* MPa N* Std*
NA 75 4 4.4 61.82 12 5.45 NA NA NA
NB 80 4 6.8 67.59 12 4.76 38749 3 1089
HA 90 4 6.4 77.50 12 4.86 43168 3 745
HB 100 4 7.8 88.07 12 4.76 43210 3 1253
*N is number of samples, Std is standard deviation of samples
Three point bend set-up
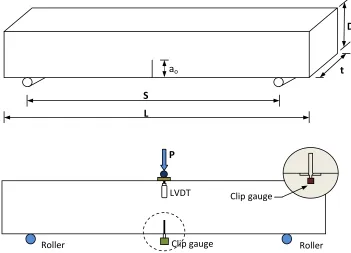
Three point bend (TPB) test was chosen to determine fracture energy of concrete. Figure 2 shows the geometry of the beam specimen as listed in the Table 4 and the TPB test set up.
The test was carried out in a stiff servo-hydraulic closed-loop testing machine with maximum capacity of 600 kN in University of Surrey, England. A load cell with capacity of 10 kN was used to compute the applied load. The loading rate of specimens was controlled by a constant vertical displacement rate of 0.01 mm/s (Zhang et al., 2009). Vertical deflection of beam was measured at the loading point by LVDT displacement transducer having capacity and linearity of 7.5 mm and ± 0.0007 mm, respectively. On the other hand, crack mouth opening dis-placement was measured using clip gauge with capacity and accuracy of 2 mm and 0.001 mm.
A notch in all of the beam specimens was made one day before testing using rotary diamond cutter with a blade width of 2.5 mm at the middle of the samples.
Table 4. Dimension of beam specimens
Mix
Number of samples
D L S ao t
mm mm mm mm mm
NA 8 100 500 300 25 100
NB 8 100 500 300 25 100
HA 12 100 500 300 25 100
HB 12 100 500 300 25 100
Test Results
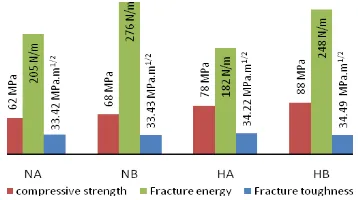
Mechanical characteristic of concrete such as compressive strength, total fracture energy, and critical stress intensity factor is presented in Table 5. Calculation of total fracture energy (GF)
and critical stress intensity factor (KIC) is described below:
Fracture energy
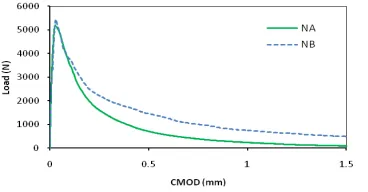
Figure 3 and 4 show the average load-CMOD curve of spe-cimens of various aggregate grading. The total fracture energy (GF) of each specimen was calculated from the experiment
results based on the RILEM TC50-FCM recommendation (1985), and the effect of self-weight beam was also considered.
(1)
In Eg. (1), GFis the total fracture energy, Wo is the area under the
load (Pa)-CMOD curve, m is the total mass of specimen between
supports, g is gravity, δois the end deflection at P=0, and D, ao
and t are the height, depth of the notch, and width of the sample, respectively. The mean fracture energy of specimens is presented in Table 5.
Fracture Toughness
The fracture toughness of samples were calculated follow-ing the three point bend test accordfollow-ing to RILEM TC89-FMT recommendation for determination of fracture toughness of concrete (1990). The equation was used to calculate fracture toughness as follows
(2)
(3)
where Pc is the critical maximum load, W is the self-weight of
the beam, ac is critical effective elastic crack length. The mean
fracture toughness of specimens is shown in Table 5.
Figure 2. Geometry of specimens and three point-bend test set-up
Table 5. Experiment results
Mix
Specific
surface area fc GF ft,max KIC
m2 Mpa Std N/m Std mm Std MPa.mm1/2 Std
NA 215.84 62 5.5 205 25.7 5.48 0.55 33.42 6.19
NB 279.34 68 4.8 276 20.3 5.80 0.92 33.43 3.25
HA 215.84 78 10 182 28.6 7.84 1.25 34.22 2.99
HB 279.34 88 4.8 248 20.9 7.60 0.81 34.49 1.33
Figure 4. Average Load-CMOD envelope curves of mix-HA and mix-HB
DISCUSSION
Figure 3 and 4 are relationship curve of flexural strength (ft) against crack mouth opening displacement (CMOD). Those
curves will be used to analysis the effect of aggregate grading on the crack behaviour of concrete. Figure 3 shows that softening
down lower than of coarser aggregate (NB) which are of normal concrete with water/cement ratio of 0.3. In the normal concrete, bulk and interfacial zone matrix is the weakest link in the concrete due to the present of water (Mindess, 1983), and aggregate grading which provides surface area for bonding between aggregate and paste influences considerably on the crack path. The initial crack of concrete tends to propagate along the weakest link of the matrix which is interfacial zone surrounding aggregates (Chen and Liu 2004) and the sliding friction between crack surfaces which exists due to interlock of aggregate surface (Larrard and Belloc, 1997; Rao and Prasad, 2002) also contributes to the transfer capacity of applied stress by which it depicts on the softening curve. The combination effect of quality of interfacial zone, sliding friction and aggregate size distribution in hardened concrete produces a type of cracking path. A tortuous cracking path of concrete which is occurred in the hardened concrete using coarser grading aggre-gate and high w/c ratio (w/c=0.30) contributes to the longer tail curve (Figure 3 and 5). Therefore, a concrete using coarser aggregate grading produces a higher softening curve than of a finer aggregate grading.
The pre-peak and post peak behaviour of concrete in repre-senting the initial crack and propagation of crack are described by the KIC and the GF value as shown in Table 5 and Figure 8.
Concrete with coarser aggregate grading provides higher GFthan
finer aggregate grading, yet the fc and the KIC are relatively same.
D
a
oS
L
t
P
LVDT
Clip
gauge
Roller
Roller
insignificant effect on the fc and KIC, however it has substantial
influence on the GF. By changing the aggregate grading in
concrete with w/c ratio of 0.30, the increase of the GF is more
than of 25%.
Improving bulk and interface matrix of concrete by both adding cementitious materials and reducing water/cement ratio influences the tensile strength and softening curve characteristic of concrete. The bulk and interface matrix also needs an optimum surface area to increase the bond strength and stiffness. It is provided by particles in the concrete. Existing additional cementitious materials which is ultrafine particles such as silica fume and fly ash, improve matrix becoming denser due to that system consists poorly crystalline hydrates (GjØrv, 1994). On the other hand low water/cement ratio reduces the existence of water in the matrix and ends up with low porosity. The improvement of the bulk and the interface matrix, then, alters the fracture characteristic. It can be seen in Figure 4 and 6 that the gap of softening curves between finer aggregate grading (HA) and coarser aggregate grading (HB) is significantly less than of the normal concrete. Since the crack depends on the stiffness of bulk matrix, interfacial zone and aggregate, the initial crack and the propagation of crack in concrete with high stiffness matrix are dictated by the stiffness of interfacial zone and aggregate. When the stiffness of interfacial zone matrix and aggregate is similar, the propagation of initial crack tends to create a straight line cracking path.
Table 5 displays a similar trend compared to concrete with w/c ratio of 0.3 that the KICand the fc of concrete with w/c ratio
of 0.2 are relatively same whereas the GF increases as the
coarseness level of aggregate grading increases. In the concrete with low w/c ratio, aggregate grading has a profound influence on the GF and a less effect on the KICand the fc. However, the
effect of aggregate grading in concrete with w/c ratio of 0.20 (high strength concrete) is lower than of 0.30 (normal strength concrete), it depicts in Figure 5 and 6 that the gap of curves in the high strength concrete is relatively closed one another, but is not in the normal strength concrete.
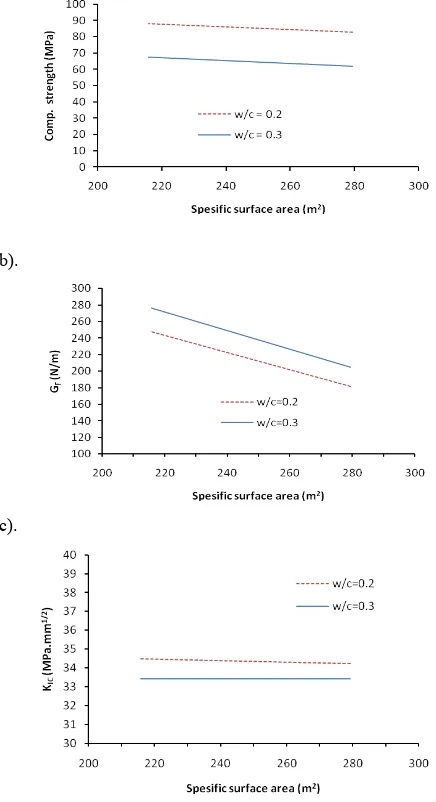
By comparing the result of concrete with w/c ratio of 0.3 and 0.2 on mechanical and fracture characteristics describes the consequence of using aggregate grading on failure behaviour of concrete or reinforced concrete structures. Improving the strength of concrete by improving quality of bulk matrix and interfacial zone significantly affects descending branch of curve after exceeding the ultimate flexural strength which is much steeper and lower at the end of curve, Figure 7. Aggregate grading which provides a certain surface area for bonding matrix will play a significant effect on bond strength between matrix and particles. A finer aggregate grading supplies a greater specific surface area than a coarser grading. Consequently, the greater bonding surface area of aggregate contributes on higher ultimate flexural and compressive strength (Figure 5, 8 and Table 5), but the softening curve which represents crack behaviour is much stepper after peak tensile strength - a straight line crack path occurred, see Figure 7. Figure 9 shows the implication of changing aggregate grading. It shows that although the high strength concrete has greater value than the normal strength concrete, the mechanical characteristic of concrete is not only influenced significantly by increasing specific surface area, but also on the stress intensity factor. However, the implication of increasing the specific surface area by changing the aggregate grading contributes evidently to the fracture behaviour of concrete which is represented by the notably reducing of the GF.
Hence, either in the normal strength or in the high strength concrete, aggregate grading affects considerably the behaviour of concrete.
Figure 5. Average stress-CMOD envelope curves of mix NA and mix NB
Figure 6. Average stress-CMOD envelope curves of mix HA and mix HB
Figure 7. Normalised tensile-CMOD envelope curves of mix NA, NB, HA, and HB
a).
b).
c).
Figure 9. The effect of increasing specific surface area of aggregate on (a) compressive strength, (b) fracture energy, and
(c) fracture toughness
CONCLUSION
A series of test were conducted to study the effect of aggregate grading on the fracture characteristic of concrete. The main conclusions which can be drawn from the study are: 1. Aggregate grading used in the concrete mix influences on the
fracture parameters of hardened concrete. The significant effect is on the normal strength concrete rather than of on high strength concrete.
2. Neither the mechanical characteristic nor fracture toughness of concrete is affected considerably by aggregate grading. It notably influences on the fracture characteristic of concrete. 3. Increasing bond surface area by using finer aggregate
grading and adding supplementary cementitious materials increases the compressive strength, the total fracture energy, and the fracture toughness of concrete. However, the fracture behaviour of concrete becomes to be more brittle.
ACKNOWLEDGEMENTS
The authors would like to thank to The Higher Education Directorate General, Ministry of National Education, Republic of Indonesia for financial support, and also to University of Surrey for infrastructures, facilities and laboratories.
REFERENCES
Bazant, Z. P., and Oh, B. H. (1983). “Crack Band Theory for Fracture of Concrete.” Rilem Materiaux et Constructions 16 (93), pp. 155-157.
Chen, B., and Liu, J. (2004). “Effect of aggregate on the fracture behaviour of high strength concrete.” Construction and Buil-ding Materials 18 (8) (2004), pp. 585-590.
GjØrv, O.E., Durability, in S.P. Shah and S. H. Ahmad. (1994).
High Performance Concrete: Properties and Applications, McGraww-Hill Inc. UK., pp. 139-156
Hillerborg, A. A. (1985). “Result of three comparative test series for determining the fracture energy GF of concrete.” Rilem
Materiaux et Constructions 18 (107), pp. 33-39.
Larrard, F. De and Belloc, A. (1997). “The influence of aggre-gate on the compressive strength of normal and high-strength concrete.” ACI Material Journal 94(5), pp. 417–426. Mindess, S., The application of fracture mechanics to cement and
concrete. in F.W. Wittmann. (1983). Fracture mechanics of concrete. Elsevier science publishers, pp.106-115.
Nallathambi, P., Karihaloo, B., and Heaton, B. S. (1980). “Various size effects in fracture of concrete.” Cement and Concrete Research 10, pp. 91-101.
Rao, G. A., and Prasad, B. K. R. (2002). “Fracture energy and softening behaviour of high strength concrete.” Cement and Concrete Research 32 (2), pp. 247-252.
Ribeiro, Ribeiro, S., D. C., Dias, M. B. S., Garcia, G. C. R., and Santos, É. M. B. (2011). “Study of the fracture behaviour of mortar and concretes with crushed rock or pebble aggre-gates”. Material Research 14 (1), pp. 46-52.
RILEM Committee FMC 50. (1985). “Determination of the fracture energy of mortar and concrete by means of three-point bend tests on notched beams.” Material Structures 18 (106), pp. 285-290.
RILEM Draft Recommendations TC89-FMT. (1990). “Fracture mechanics of concrete test methods.” Material Structures 23, pp. 457–460.
Wolinski, S., Hordjik, D. A., Reinhardt H. W., and Cornelissen, H. A. W. (1987). Influence of aggregate size on fracture mechanics parameters of concrete, The International Journal of Cement Composites and Lightweight Concrete 9 (2), pp. 95-103.
Wu, K. R. ,Chen, B., Yao, W., and Zhang, D. (2001). “Effect of coarse aggregate type on mechanical properties of high-performance concrete”. Cement and Concrete Research 31 (10), pp. 1421-1425.
Xiao J., Schneider H., Dönnecke C., and König, G. (2004). “Wedge splitting test on fracture behaviour of ultra-high strength concrete.” Construction and Building Materials 18 (6), pp. 359-365.
Zhang, X.X. , Ruiz, G., Yu, R.C., and Tarifa, M. (2009). “Fracture behaviour of high-strength concrete at a wide range of loading rates.” International Journal of Impact Engineering 36 (10-11) (2009), pp. 1204-1209.