EVALUATION OF R GEOGRA
(Case Stu
BOGOR
OF RUBBER PLANTATION DEVELOPMENT OGRAPHIC INFORMATION SYSTEM AND
MULTI CRITERIA ANALYSIS
Study in Banyuasin Regency, South Sumatera)
MARTINI YULIA
GRADUATE SCHOOL
GOR AGRICULTURAL UNIVERSITY BOGOR
2011
STATEMENT
I, Martini Yulia, stated that this thesis entitled:
Evaluation of Rubber Plantation Development Using Geographic
Information System and Multi Criteria Analysis (Case Study in Banyuasin Regency, South Sumatera)
Is a result of my own work under the supervision of the advisory board during the period February until August 2011 and that it has not been published. The content of the thesis has been examined by the advising the advisory board and external examiner
Bogor, July 2011
ABSTRACT
MARTINI YULIA, Evaluation of Rubber Plantation Development using Geographic Information System and Multi Criteria Analysis (Case Study in Banyuasin Regency, South Sumatera). Under The Supervision of MUHAMMMAD BUCE SALEH AND ANTONIUS BAMBANG WIJANARTO.
The objective of the research is to evaluate of rubber plantation development in Banyuasin Regency using Geographic Information System and to analyze priority development of sub regency for rubber plantation using Analytical Hierarchy Process (AHP). Potential land for the development of rubber could be determined if soil and climate conditions are known. The soil and climate condition are linked to characteristics of rubber plantation. These relationships can produce a land suitability classification system, which aims to assess how far the level of suitability of the land to plant rubber. The method used consisted of three steps: (1) land suitability analysis from available maps (climate, soil, topography and existing land use): (2) productivity analysis of rubber from available production data in 2009: (3) Rubber area development by using Multi Criteria Analysis (MCA). The result of this research showed that all the areas of Banyuasin Regency are suitable for rubber plantation development. It was found that about 15.4% or 164,201 ha of Banyuasin Regency are highly suitable (S1) and about 84.6% or 904,681 ha are moderately suitable (S2) for rubber plantation. Then the existing rubber was evaluated the productivity of rubber which produce suitable areas with high productivity about 21,703 ha and low productivity about 31,021 ha. This research also produced areas suitable for planting rubber which are considered social and economic factors about 51,960 ha. The total area of priorities for rubber plantation development is 51,960 ha or 4.87% from area of Banyuasin Regency.
ABSTRAK
MARTINI YULIA, Evaluasi Pengembangan Perkebunan Karet Menggunakan Sistem Informasi Geografis dan Analisis Multi Criteria (Studi Kasus di Kabupaten Banyuasin, Sumatera Selatan). Dibimbing oleh MUHAMMAD BUCE SALEH dan ANTONIUS BAMBANG WIJANARTO.
Tujuan dari riset ini adalah untuk evaluasi perkembangan perkebunan karet di Kabupaten Banyuasin menggunakan system informasi geografis dan untuk analisis prioritas kecamatan untuk perkembangan perkebunan karet menggunakan Process Hirarki Analitik (AHP). Potensi lahan untuk pengembangan tanaman karet dapat ditentukan jika keadaan tanah dan iklim diketahui terlebih dahulu.Kondisi tanah dan iklim tersebut berkaitan dengan sifat-sifat yang dikehendaki tanaman karet. Hubungan tersebut menghasilkan suatu sistem klasifikasi kesesuaian lahan, yang tujuannya untuk menilai seberapa jauh tingkat kecocokan suatu lahan terhadap tanaman karet. Metode yang digunakan terdiri dari 3 langkah: (1) Analisis kesesuaian lahan dengan menggunakan peta-peta yang tersedia (iklim, tanah, topografi dan penggunaan lahan): (2) Analisis produktivitas karet menggunakan data produksi tahun 2009 yang tersedia: (3) Penambahan luas karet menggunakan Analisis Multi Criteria. Hasil dari penelitian ini menunjukkan bahwa semua area Kabupaten Banyuasin sesuai untuk pengembangan perkebunan karet, sekitar 15.4% atau 164,201 ha dari luas kabupaten banyuasin adalah sangat sesuai (S1) dan sekitar 84.6% atau 904,681 ha adalah sesuai (S2) untuk perkebunan karet. Kemudian model yang digunakan untuk mengevaluasi tanaman karet yang ada dan produktivitas menghasilkan area sesuai dengan produktivitas tinggi sekitar 21,703 ha dan produktivitas rendah sekitar 31,021 ha. Penelitian ini juga menunjukkan bahwa area baru untuk menanam karet dengan pertimbangan faktor ekonomi dan social adalah sekitar 51,960 ha. Total prioritas area tanaman karet untuk dikembangkan di Kabupaten Banyuasin adalah sekitar 51,960 ha atau 4.87%.
SUMMARY
MARTINI YULIA, Evaluation of Rubber Plantation Development using Geographic Information System and Multi Criteria Analysis (Case Study in Banyuasin Regency, South Sumatera). Under the Supervision of MUHAMMMAD BUCE SALEH AND ANTONIUS BAMBANG WIJANARTO.
Rubber is an export commodity that is able to contribute to the increase in Indonesia's foreign exchange. Foreign exchange earnings from this commodity in 2004 reached U.S. $2.25 billion, which represents 5% of non-oil foreign exchange earnings. National rubber production in 2005 reached approximately 2.2 million tons (Hanspari, 2010). Over the last five years from the year 2005 to 2009, exports of rubber and rubber products would average $ 5.6 billion per year, with a growth of 10 percent. Exports of rubber and rubber products reached USD522.8 million, an increase of 84 percent from the same month in 2009.
Rubber plants originated from tropical areas in the Amazon Basin, Brazil with rainfall 2000 - 3000 mm/year and the rainy days of 120 - 170 days/year (Sutardi, 1981). Rubber trees grow in areas between 10o North and 10o South (Moraes, 1977). Most of Indonesian rubber plantations are located in Sumatera and Kalimantan, with rainfall ranging from 1500 to 4000 mm/year with an average of 0 - 4 months in dry months per year
Banyuasin is one of the regencies in South Sumatera. Banyuasin area has the potential for agriculture and plantation. From the total area of 11.832,99 km2, about 47 percent is agricultural and plantation areas. Contributions to local income of Banyuasin Regency are 35 percent from the agricultural sector, 21% from industrial sector, and 15% from trading. Agriculture of this regency has paddy field of 596,303.36 tons. The productions of oil palm and rubber are 130,228.11 tons and 89,640.50 tons, respectively. Rubber plants are very potential to be developed in this area. Rubber plantations in Indonesia are generally composed of smallholder rubber (85%) and the rest (15%) are state and private plantations. (Bappeda and BPS Statistic of Banyuasin, 2008).
The objectives of this research are to study evaluation of rubber plantation development in Banyuasin Regency using Geographic Information System and to analyze priority development of sub regency for rubber plantation using Analytical Hierarchy Process (AHP). The results of early studies based on the literature, statistic data, physical aspects, aspects of social and economic aspects.
The study covers the period of February 2010 to July 2011. The research location was in the Banyuasin regency, South Sumatera Province. The coordinate geographic position was in latitude 1018’00” – 4000’00” South and longitude between104040’00 – 105015’00” East. Banyuasin Regency consists of 15 Sub Regency.
The land suitability result shown that all areas in Banyuasin Regency are suitable for rubber plantation. The areas were divided into two parts: highly suitable area (S1), and moderately suitable area (S2). It was found that about 15.4% or 164,201 ha of Banyuasin Regency are highly suitable (S1) and about 84.6% or 904,681 ha are moderately suitable (S2) for rubber plantation. Spatial analysis resulted to suitable area for rubber and the largest area from the total land is moderately suitable (S2).
From the result of classification of plantation and validation using GPS coordinate of rubber areas is about 53,892 ha and oil palm areas about 56,728 ha. The largest area from total of existing rubber areas (S1) in Banyuasin III Sub Regency is about 8,310 ha and for S2 in Banyuasin I Sub Regency about 24,684 ha, then the smallest area from the total of existing rubber areas (S1) in Rambutan Sub Regency about 4.24 ha and for S2 in Banyuasin III Sub Regency about 0.11 ha.
Based on Indonesian Rubber Statistics (2008), high productivity of rubber plantation is more than 1.5 ton/ha/year, the average productivity of rubber plantation in Banyuasin Regency is 1.8 tons/ha/year, the productivity of rubber analysis shows that productivity condition of suitable area planted with rubber in Banyuasin regency divided into four parts: highly suitable areas planted with rubber and high productivity (S1 rubber, high productivity) about 17,183 ha, highly suitable areas planted with rubber and low productivity (S1 rubber, low productivity) about 158 ha, moderately suitable areas planted with rubber and high productivity (S2 rubber, high productivity) about 4,520 ha, moderately suitable about areas planted with rubber and low productivity (S2 rubber, low productivity) about 30,963 ha.
The next analysis was performed using ratings with AHP method to expand plantation areas. This method considered social and economic factors. This analysis has a purpose to determine priorities of sub regency for rubber development. Social factor used several variables such as area of rubber and number of rubber farmer. Economic factor used also two variables i.e. ratio income of rubber with non rubber and ratio cost of rubber with non rubber.
In rating models, each variable should be categorized into several classes (4 – 5 classes). This classes show the conditions of each variables (such as highly suitable, moderately suitable, marginally suitable and not suitable). For number of rubber farmer was classified into very high number of farmers (vhn), high number of farmers (hn), moderate number of farmers (mn), small number of farmers (sn) and very small number of farmer (vsn). This variable is indicated rubber is socially accepted if the number of rubber farmer is greater. For Area of rubber was claaified into very large, large, medium, small and very small. This variable is indicated rubber is socially accepted if the area of rubber is greater. Then for ratio income of rubber with non rubber was classified into very high, high, medium, low and very low. This variable is indicated rubber is economically accepted if the income of rubber is greater and for ratio cost of rubber with non rubber was classified into very large, large, moderate, small and very small. This variable is indicated rubber is economically accepted if the cost of rubber is smaller (please see Appendix 5.
Table 17 shows each sub regency has value total ranging from 0 to 1 and shows also that Rambutan Sub Regency, Betung Sub Regency, Rantau Bayur Sub Regency and Banyuasin III sub regency are top four in priorities of sub regency for rubber plantation development, Rambutan sub regency has total value 0.640, Betung sub regency has total value of 0.682, Rantau Bayur sub Regency has total value of 0.593 and Banyuasin III Sub Regency has of value 0.588. That is meaning based on consideration social and economic factors, the top four in priorities of sub regency has positive impact than other sub regency, so considerately Rambutan Sub Regency, Betung Sub Regency, Rantau Bayur Sub Regency and Banyuasin III sub regency as area of priorities for rubber plantation development.
Copyright @ 2011, Bogor Agricultural University Copyright are protected by law,
1. It is prohibited to cite all of part of this thesis without referring to and mentioning the source:
a. Citation only permitted for the sake of education, research, scientific writing, report writing, critical writing or reviewing scientific problem. b. Citation does not inflict the name and honor of Bogor Agricultural
University.
EVALUATION OF RUBBER PLANTATION DEVELOPMENT USING GEOGRAPHIC INFORMATION SYSTEM AND
MULTI CRITERIA ANALYSIS
(Case Study in Banyuasin Regency, South Sumatera)
MARTINI YULIA
A Thesis submitted for the degree of Master of Sciences in Information Technology for Natural Resources Management Program Study
GRADUATE SCHOOL
BOGOR ANGRICULTURAL UNIVERSITY BOGOR
Research Title : Evaluation of Rubber Plantation Development Using Geographic Information System and Multi Criteria Analysis (Case Study in Banyuasin Regency, South Sumatera)
Student Name : Martini Yulia Student ID : G051090031
Study Program : Master of Science in Information Technology for Natural Resource Management
Approved by, Advisory Board
Dr. Muhammad Buce Saleh Dr. Antonius Bambang Wijanarto Supervisor Co-Supervisor
Endorsed by,
Program Coordinator Dean of Graduate School
Dr. Ir. Hartrisari Hardjomidjojo, DEA Dr. Ir. Dahrul Syah, M. Agr. Sc
ACKNOWLEDGMENTS
Alhamdulillah, Thanks to The Almighty ALLAH SWT, which has given me the opportunity and ability to complete this thesis. The success of this study would not have been possible without various contribution and support from many people and I will not be able to mention them one by one. Of course, I would like to express my highly appreciation to all of them.
I wish to thank my supervisor, Dr. Muhammad Buce Saleh and my co-supervisor, Dr. Antonius Bambang Wijanarto for their guidance, technical comment and constructive critics.
I would like to thank for Balai Besar Sumber Daya Lahan Pertanian (BBSDLP) for support me in obtained soil data.
I would like to thank to all MIT secretariat staff who support our administration and facility. I would also like to thank all MIT lecturers who taught me with very important knowledge during my study.
Thanks are also due to all my colleagues in MIT for helping, supporting, and togetherness in finishing our assignment and study.
Finally, I would like to thank to my lovely husband Ir. Mattobi’i, MP, my lovely children Aisyah, Azi, Annisa and my parents for all their moral support, patience, prayer and love during my study.
CURRICULUM VITAE
i TABLE OF CONTENTS
TABLE OF CONTENTS ... i
LIST OF TABLES ...iv
LIST OF FIGURES ... v
LIST OF APPENDICES………..………..…vi
I. INTRODUCTION ... 1
1.1 Background………...1
1.2 Problem Statement………....2
1.3 Objectives………...3
1.4 Study Question………...3
1.5 Scope of the Research………...3
1.6 Study Output………...……..3
II. LITERATURE REVIEW ... 4
2.1 The Potential of Rubber……….4
2.1.1 Development of Rubber Plantation Area……….5
2.1.2 Development of Rubber Production………... .6
2.2 Basic Requirements for Rubber Plantation………. .8
2.2.1 Climate Requirements………...8
2.2.1.1 Rainfall……….8
2.2.1.2 Temperature………... .8
2.2.2 Landscape and Soil ………...………9
2.2.2.1 Topography………...9
2.2.2.2 Soil Texture……….10
2.2.2.3 Soil Dranage………10
2.3 Land Suitability for Rubber Plantation………...11
2.4 Geographic Information System……….14
2.5 Multi Criteria Decision Analysis (MCDA)……….15
2.6 Spatial Multi Criteria Analysis………15
ii
2.8 Rating (Absolute Measurement)………..19
2.9 Supervised Classification………19
III.METHODOLOGY………...21
3.1 Time and Location………...21
3.2 Data and Tools……….22
3.2.1 Supporting Data ... 22
3.2.2 Hardware and Software ... 23
3.3 Methods………...23
3.3.1 Land Suitability Analysis for Rubber Plantation ... 23
3.3.2 Analysis of Existing Land Use Types ... 27
3.3.3 Existing of Rubber Plantation ... 28
3.3.4 Productivity of Rubber Analysis ... 28
3.3.5 Multi Criteria Analysis ... 29
IV.RESULT AND DISCUSSION……….32
4.1 General Condition of the Study Area………..32
4.1.1 Topography ... 32
4.1.2 Climate ... 32
4.1.3 Land Use and Land Cover ... 32
4.1.4 Demography Condition ... 33
4.2 Land Suitability Analysis for Rubber Plantation………33
4.2.1 Temperature ... 34
4.2.2 Rainfall ... 34
4.2.3 Soil Texture ... 36
4.2.4 Soil Drainage ... 36
4.2.5 Topography ... 37
4.2.6 Overlay Process ... 38
4.3 Existing of Rubber Plantation……….39
4.4 Productivity of Rubber Plantation………...42
4.5 Existing of Non Rubber………...45
4.6 Development Area of Rubber Plantation………47
iii
V. CONCLUSION……….52
5.1 Conclusion………...52
5.2 Recommendation……….52
REFFERENCES..…..……….54
iv LIST OF TABLES
Table 1. Development of Rubber Plantation Area in Banyuasin Regency…….5
Table 2. Development of Rubber Production in Banyuasin Regency……….. ..7
Table 3. Influence of Temperature on Growth and Production of Rubber….. ..9
Table 4. Classification of Land Suitability for Rubber Plantation………13
Table 5. Random Consistency Index (RI)……….18
Table 6. Supporting Data Required……….. 22
Table 7. Hardware and Software……….. 23
Table 8. Structure of Suitability Classification………. 25
Table 9. Relations Between Suitability Grades and Classes……….26
Table 10. Scale and Definition of Pairwise Comparison……….. 30
Table 11. Number of Population, Total Villages, Total Area and Average Number of Population per square km by Sub regency in Banyuasin regency……… 33
Table 12. Summary of Climate Condition from Different Station…………...34
Table 13. Existing of Rubber in Banyuasin Regency………... 41
Table 14. Condition of Productivity of Rubber in 2009………... 43
Table 15. Summary Areas of Suitable, Planted with Rubber and Productivity of Rubber………..……….44
Table 16. Existing of Non Rubber in Banyuasin Regency………... 46
Table 17. Priorities of Rubber in Sub Regency……… 49
v LIST OF FIGURES
Figure 1. Development of Rubber Plantation Area in Banyuasin Regency…. ..6
Figure 2. Development of Rubber Production in Banyuasin Regency………. ..7
Figure 3. The Study Site………... 21
Figure 4. Methodology Flowchart of the Research……….. 24
Figure 5. Flowchart of Land Suitability for Rubber Plantation……… 26
Figure 6. Area Distribution of Land Use (Hectares)……….27
Figure 7. Land Use Map of Banyuasin Regency……….. 28
Figure 8. Relationship among Goal, Criteria, Sub Criteria and Alternatives in AH..30 Figure 9. Map of Temperature in Study Area………... 35
Figure 10. Map of Rainfall in Study Area……… 35
Figure 11. Map of Soil Texture in Study Area………. 36
Figure 12. Map of Soil Drainage in Study Area………... 37
Figure 13. Land Suitability for Rubber Plantation………39
Figure 14. Plantation Existing in Banyuasin Regency………..40
Figure 15. Rubber Existing in Banyuasin Regency……….. 40
Figure 16. Area of Suitable Map, Rubber and Productivity of Rubber……… 45
Figure 17. Existing of Non Rubber in Banyuasin Regency……….. 46
vi LIST OF APPENDICES
Appendix 1. Number of Rubber Farmers……….………...59
Appendix 2. Ratio of Income Rubber with Non Rubber………..….…60
Appendix 3. Ratio of Cost Rubber with Non Rubber ……….……….…61
Appendix 4. Pairwise Comparison Method and Consistency Ratio (CR)…....62
Appendix 5. Classification in Ratings….……….………...63
Appendix 6. Final Periorities of Alternatives……….…...………....64
Appendix 7. Questionnaire for Expert Group…….……….……….…65
Appendix 8. Pairwise Comparison by Expert Choice.………...………...76
Appendix 9. Ratings Method by Expert Chioce………...……….77
1
I. INTRODUCTION
1.1 Background
Indonesia has a wide range of climate, from wet tropical to semi-arid. Rainfall varies according to time and place, while air temperature and radiation are relatively constant throughout the year because Indonesia is located on the equator. Air temperature variations are caused by differences in altitude.
Rubber plants originated from tropical areas in the Amazon Basin, Brazil with rainfall 2000-3000 mm/year and the rainy days of 120-170 days/year (Sutardi, 1981). Rubber trees grow in areas between 10o North and 10o South (Moraes, 1977). Most of Indonesian rubber plantations are located in Sumatera and Kalimantan, with rainfall ranging from 1500-4000 mm/year with an average of 0-4 months in dry months per year.
Potential land for the development of rubber could be determined if soil and climate conditions are known. The soil and climate condition are linked to characteristics of rubber plantation. These relationships can produce a land suitability classification system, which aims at assessing how far the level of suitability of the land to plant rubber (Thomas, 1995).
Land condition in Banyuasin Regency consists of majority wetlands and swamps, while rubber plants are suitable to be grown on dry land. However, many wetlands have been converted to rubber plantations, because the soil has become dry or wet land and dry land is not submerged in water (Media Perkebunan, 2008).
2
are very potential to be developed in this area. Rubber plantations in Indonesia are generally composed of smallholder rubber (85%) and the rest (15%) are state and private plantations. (Bappeda and BPS Statistic of Banyuasin, 2008).
Since 2003, the program on replanting the old rubber plantations was carried out covering a target area of 10,000 ha, because, about 10% of 84,000 ha of rubber plantation consists of old trees whose production is not optimal anymore and must be replanted. In 2003, Banyuasin government provided seeds for replanting an area of 400 hectares. The seeds for replanting aid program in 2004 covers an area of 400 ha (Bappeda and BPS Statistic of Banyuasin, 2008).
In general, GIS (Geographical Information System) is a computer-based information system that combines elements of the map (geographical) and information about the map (data attributes) that are designed to obtain, process, manipulate, analyze, demonstrate and display spatial data to complete the planning, process and investigation of the problem.
Based on the potential of rubber plantations in Banyuasin Regency, it is necessary to do data processing and analyzing the potential of rubber plantation areas using GIS and multi criteria method. This is very helpful for policy makers of local governments for the development and production increase of rubber.
1.2 Problems Statement
Plantation sectors consisted of the smallholders, government plantation and private plantations. Among the potential commodities to be developed are rubber and oil palm.
3
study is focused on land suitability analysis, productivities analysis, and social-economic analysis using multi criteria method.
1.3 Objectives
The objectives of this study are: to evaluate the suitability of rubber plantation development in Banyuasin Regency using Geographic Information System and multi criteria method. The additional objective is to evaluate priority development of sub regency for rubber plantation using Analytical Hierarchy Process (AHP).
1.4 Study Question
To achieve the aforementioned study objectives in the previous section, the research questions of this study are:
1. What was done if the land is not suitable but planted with rubber? 2. What was done if the land is suitable but planted with rubber? 3. What was done if the land is suitable but not planted with rubber? 4. Where is the priority of areas for rubber plantation development?
5. How many sub regency belong to priority areas for rubber plantation development?
1.5 Scope of the Research
1. The study area is in Banyuasin Regency area located in South Sumatra. 2. This study analyzed rubber plantation development.
3. This study analyzed the priority of development area for rubber plantation using multi criteria method.
1.6 Study Output
4
II. LITERATURE REVIEW
2.1 The Potential of Rubber
Rubber is an export commodity that is able to contribute to the increase in Indonesia's foreign exchange. Foreign exchange earnings from this commodity in 2004 reached U.S. $2.25 billion, which represents 5% of non-oil foreign exchange earnings. National rubber production in 2005 reached approximately 2.2 million tons (Hanspari, 2010). Over the last five years from the year 2005-2009, exports of rubber and rubber products would average $ 5.6 billion per year, with a growth of 10 percent. Exports of rubber and rubber products reached USD522.8 million, an increase of 84 percent from the same month in 2009.
A number of locations in Indonesia has state land suitable for rubber plantations, mostly in Sumatra and Kalimantan. The area of rubber plantations in 2005 recorded more than 3.2 million ha scattered throughout the territory of Indonesia. Among them 85% are rubber plantation owned by the people, and only 7% of the country estates and 8% large plantations owned by private sectors. Rubber production in the year 2005 reached 2.2 million tons. This amount will be increased further still by doing a rejuvenating and empowering of agricultural lands owned by farmers as well as vacant land/non-productive that is suitable for rubber plantations (Anwar, 2006).
5
wood-latex, such as IRR 5, IRR 21, IRR 32, IRR 39 , IRR 42 and IRR 118 (Siagian et al, 2003).
2.1.1 Development of Rubber Plantation Area
Development of rubber plantation area in Banyuasin Regency during last four years has increased. In 2007, rubber plantations in Banyuasin Regency occupied an area of 100,536.78 ha, then increased in 2008 to 101,149.30 ha or an increase of 0.61%. Whereas in 2009 the total areas of rubber plantations of Banyuasin Regency increased to 0.39 percent or 101,542.00 hectares, but in 2010 the total areas of rubber plantations Banyuasin Regency decreased -0.87% or 100,653.59 ha. The development of rubber plantation area is shown in the Table 1.
Table 1 Development of Rubber Plantation Area (Ha) in Banyuasin Regency, 2007-2010
*) preliminary
Based on the exertion status, rubber plantations in Banyuasin Regency consist of three groups, namely smallholders, government plantation and private plantation. In 2008, the total rubber plantation areas in Banyuasin Regency was 101,149.30 ha with the breakdown as follows; 88,386.00 ha (87.38%) smallholders plantation, government plantation 7,383.00 ha (7.29%), and private plantation 5,380.30 ha (5.32 %). The development of rubber plantation based on the exertion status year 2007-2010 is shown in Figure 1.
Figure 1 Developm 2010 is shown in Table 2 Percentage of ru
ment of Rubber Plantation Area in Banyuasin Reg
of Rubber Production
of rubber plantation in Banyuasin Regency durin ed. In 2007 production of rubber was 114,363.0
2008 i.e 117,283.00 tons. In 2009, production tons (5.14 %). Then in 2010, production of rubber
tons. Development of rubber production from e 2.
rubber plantation areas cultivated by smallholde bber plantation areas in Banyuasin Regency with e total rubber plantation production in Banyuasin that the productivity of rubber plantation from sma
an the productivity of government plantation e development of rubber production in 2007 - 201
Table the rubber production private plantation decre
ble 2 Development of Rubber Production in Banyuasin Regency, 2007-2010
evelopment of Rubber Production in Banyuasin R ondition showed that rubber agribusiness is ma
ment plantation and private plantation. Th smallholders was positive, but slow i.e 0.7 % per y n of government plantation decreased about 9 reased 1.06% per year. Therefore, support to m hould be given to smallholders. Rubber trees in s damaged and unproductive about 8,712.00 hec
8
2.2 Basic Requirements for Rubber Plantation 2.2.1 Climate
2.2.1.1 Rainfall
The major climatic factor which influences plant growth is rainfall (also called precipitation) from which the required amount of water can be supplied to the plant. If there is no enough rainfall available in a particular region, water should be supplied by a combination of rainfall and irrigation. If the rainfall is sufficient to cover the water needs of the plant, irrigation is not required. If there is no rainfall, the water for plant need has to be supplied by irrigation.
Water is the key to productive agriculture. The quantity of water needed to grow a plant will depend upon soil and climatic conditions as well as the nature of the plant itself. Excess water must be drained away before plant roots suffer from lack of aeration; yet soil moisture must be retained at content sufficiently high that the plant will not suffer during dry plant periods.
Minimum rainfall for rubber plant is 1500 m / year. In general rubber plant can grow well in the range of 1500 - 3000 mm / year rainfall. The amount of evapotranspiration or water requirement of rubber is equivalent to evaporation measured by pan of class A or 3 mm - 5 mm per day for the condition in Indonesia (Haridas, 1985). Rainfall of 100 mm - 150 mm will be enough for the water need of the rubber plant for 1 month (Rao and Vijayakumar, 1992). Excessive rainfall may disturb harvest caused by disease attack. On the other hand, drought would suppress growth and rubber production (Thomas, 1995).
2.2.1.2 Temperature
9
Air temperature in the lowland tropical region is about 28oC and the air temperature decreases about 0.6oC for every increase of 100 m. Air temperature in the lowland tropical region is about 28 and the air temperature decreases about 0.6 for every increase of 100 m. Influence of temperature on growth and production of rubber is shown in Table 3.
Table 3 Influence of Temperature on Growth and Production of Rubber
Temperature (o C) Influence Growth and Production
5
Crop damage because low temperature Photosynthesis stopped
The optimum flow of latex The optimum for Photosynthesis Stomata close
High respiration and low photosynthesis rate
2.2.2 Landscape and Soil 2.2.2.1 Topography
Topography is often a major factor in irrigation evaluation as it influences the choice of irrigation method, drainage, erosion efficiency, costs of land development, size and shape of fields, labour requirements, range of possible plants, etc. Slope is one of the aspects of topography that have a special bearing on irrigation suitability.
10
because the difference in elevation between two points is 100 meters apart horizontally is 100 meters on a 45o slope.
2.2.2.2 Soil Texture
The texture of a soil is determined by the relative proportion of clay, silt and sand particles. Texture is most easily determined in the field by pressing and rubbing moist soil between the fingers. Texture classes are:
o Coarse texture: sands, loamy sand and sandy loams with less than 18% clay, and more than 65% sand.
o Medium texture: sandy loams, loams, sandy clay loams, silt loams with less than 35% clay and less than 65% sand; the sand fractions may be as high as 82% if a minimum of 18% clay is present.
o Clays, silty clays, sandy clays, clay loams and silty clay loams with more than 35% clay.
Good soil texture for rubber plant is clay soil texture, while sandy soil is adverse. Soil with clay texture has a capacity to hold water and nutrients better than sandy soil texture (Yew, 1991).
2.2.2.3 Soil Drainage
Natural soil drainage refers to the average wetness or dryness of a soil and may be a clue to soil permeability. The colors of topsoil and sub soil are clues to interval drainage.
o Well Drained: Land has hydraulic conductivity medium and water holding capacity is medium, moist, but not enough to wet ground near the surface. This land suitable for various crops.
o Moderately Well Drained: Land has hydraulic conductivity moderate to somewhat low and water holding capacity is low, wet ground near surface. This land suitable for various crops.
11
ground to surface of land. This land suitable for paddy rice and other crops fraction.
o Somewhat Excessively Drained: Land has hydraulic conductivity high and water holding capacity is low. This land suitable only for some plants that without irrigation.
o Poorly drained: Land has hydraulic conductivity low and water holding capacity is low to very low. Wet ground for long time on surface. The land suitable for paddy rice and some plants other.
o Excessively Drained: Land has hydraulic conductivity high to very high and water holding capacity is low. The land not suitable for crops without irrigation.
Rubber plants require water drainage is well. The flood condition is not conducive to the growth of rubber plants. Soil drainage range of good (well) and moderately well is ideal range for rubber plants. At soil drainage is poorly and excessively drained the growth and production of rubber is very low (Thomas, 2008).
2.3 Land Suitability for Rubber Plantation
Land suitability is the ability of a given type of land to support a defined use. The process of land suitability classification is the evaluation and grouping of specific areas of land in terms of their suitability for a defined use. The principles of sustainable development make land-use suitability analysis become increasingly complex due to consideration of different requirements/criteria. It includes consideration not only inherent capacity of a land unit to support a specific land use for a long period of time without deterioration, but also the socio-economic and environmental costs (Hananto, 2007).
12
Each plant species requires definite soil and site conditions for its optimum growth. Although some plants may be found to grow under different soils and extreme agro-ecological conditions, yet not all plants can grow on the same soil and under the same environment. Most of the plant species need well drained, moderately fine to medium texture soils, free of salinity and having optimum physical environment (Mishra, 2007).
The land suitability classification, using the guidelines of FAO (1976) is divided into Order, Class, Sub Class, and Unit. Order is the global land suitability group. Land suitability Order is divided into S (Suitable) and N (Not Suitable). The process of land suitability classification is the appraisal and grouping of specific land in terms of their suitability for defined uses. Suitability can be scored based on factor rating or degree of limitation of land use requirements when matched with the land qualities. In other words land suitability evaluation is a comparison and matching of land utilization type requirements with land unit characteristics. Land suitability classes reflect degrees of suitability. That is defined as the following:
Class S1 Highly Suitable: Land having no significant limitation or only have minor limitations to sustain a given land utilization type without significant reduction in productivity or benefits and will not require major inputs above acceptable level.
Class S2 Moderately Suitable: Land having limitations which in aggregate are moderately severe for sustained application of the given land utilization type; the limitations will reduce productivity or benefits and increase required inputs to the extent that the overall advantage to be gained from the use, although still attractive, will be appreciable compared to that expected from Class S1 land. Class S3 Marginally Suitable: Land having limitations which in aggregate
13
Class N Not Suitable as the range of inputs required is unjustifiable. (Ritung, 2007)
Land quality is the complex attributes of lands and contains one or more land characteristics. Important land characteristics in any land evaluation include topography, soil, and climate. These, especially topography and soil, are important components in determining land units. Important land characteristics in any land evaluation include topography, soil, and climate. These, especially topography and soil, are important components in determining land units. The relationship of land quality and land suitability classification is described in Table 4.
Table 4 Classification of Land Suitability for Rubber Plantation (Hardjowigeno et al., 1999)
Land
Soil Drainage well drained
Moderately
<200 200-450 >450-600 >600
Note: Td = Inoperative S = Sand Str C = Structured Clay
14
2.4 Geographical Information System
Geographic Information System (GIS) is a computer-based system used to store and manipulate geographic information. It is designed for collection, storage, and analysis of objects and phenomena where geographic location is an important characteristic or critical to the analysis (Aronoff, 1991). GIS is defined as an information system that is used to input, store, retrieve, manipulate, analyze and output geographically referenced data or geospatial data, in order to support decision making for planning and management of land use, natural resources, environment, transportation, urban facilities, and other administrative records. A computer system for GIS consists of hardware, software and procedure designed to support the data capture, processing, analysis, modeling and display of geospatial data (Murai, 1996).
Geographic information can be represented with geometric information such as location, shape and distribution, and attribute information such as characteristics and nature. Vectors and raster forms are the major representation models for geometric information. Most objects on a map can be represented as a combination of a point (or node), edge (or arc) and area (or polygon), which are vector forms. A point is represented by geographic coordinates. An edge is represented by a series of line segments with a start point and an end point. A polygon is defined as the sequential edges of a boundary. The inter-relationship between points, edges, and areas is called a topological relationship.
In the raster form, the object space is divided into a group of regularly spaced grids (pixels) to which the attributes are assigned. The raster form is basically identical to the data format of remote sensing data (Jars, 1993).
GIS can be a very important tool in decision making for sustainable development, because GIS can provide decision makers with useful information by means of analysis and assessment of spatial database. Decision making including policy making, planning and management can be interactively implemented taking into consideration human driving forces through public.
15
Driving forces include population growth, health and wealth, technology, politics, economics etc. by which human society will set up targets and goals on how to improve the quality of life (Bregt, 1997).
2.5 Multi Criteria Decision Analysis (MCDA)
Multi Criteria Decision Analysis (MCDA) or could be defined as MCDM (Multi Criteria Decision Making) techniques have largely been a spatial, but they are different in GIS context. Spatial MCDA which is applied in GIS requires both data on criterion values and the geographical locations of alternatives (Malczewski, 1999).
The main concept combination between MCDA and GIS is to support the decision maker in achieving greater effectiveness and efficiency. Some techniques used to support MCDA in decision making by using decision rules, to choose the best or the most preferred alternatives (Malczewski, 1999).
. The main method in weighted linear combination (WLC) assigns relative weight to each attribute. Decision maker directly assigns weights to each attributes. The highest overall score is chosen for the alternative. The weighted linear combination formula is as follows:
Wt = Σi Wi.Xi ……Wn.Xn (1)
Where; Wt = Total Weight
Wi = Weight value in each parameter i to n
Xn = Score value in each parameter i to n
2.6 Spatial Multi Criteria Analysis
16
GIS have capability to store and analyze spatial data effectively, and it could be spatial modeling to support decision analysis (Center for GIS, 2005). GIS has long experience in decision making and map design, and it can integrate with MCDA system to support decision makers (Zhao and Garner, 2009).
The goal of spatial MCDM is to achieve solutions for spatial decision problems that take the input from multiple criteria. These criteria, also called attribute have to be identified very carefully to ensure that the final goal could be achieved (Prakash, 2003 in Dewi, 2008).
Spatial data analysis is in many ways the most important part of Geography Information System (GIS), because it includes all of the transformations, manipulations, and methods that can be applied to geographic data to add value to them, to support decision, and to reveal patterns and anomalies that are not immediately obvious. It is desirable that the geographical data management and analysis component contain a robust set of tools that are available in full fledged GIS system (Malczewski, 1999).
Method of analysis used MCDA approach for priority development area of rubber plantation criteria which is integrated with GIS. Assigning weighted value for criteria use Weighted Linear Combination (WLC) as described in equation 1 and Pair-wise Comparison Method (PCM).
2.7 Analytical Hierarchy Process (AHP)
Analytical Hierarchy Process (AHP) is a decision making approach developed by Saaty in 1980. The principles utilized in AHP to solve problems are to construct hierarchies. The hierarchy allows for the assessment of the contribution individual criterion at lower levels to make criterion at higher levels of the hierarchy.
17
many judgments to derive priorities among criteria and down to alternative solution. AHP has several basic steps to be employed as follows (Saaty, 1980):
1. identify the problem and determine the goal, 2. structure the hierarchy from the top,
3. construct a set of pair wise comparison matrices,
4. there are n(n-1)/2 judgments required to develop each matrix in step 3, 5. determined the consistency using the Eigen value,
6. horizontal processing, 7. vertical processing,
8. Calculate the consistency ratio.
The AHP has three basic steps for considering decision problems by AHP. It begins by decomposing the overall goal (suitability) into a number of criteria and sub-criteria. The goal itself represents the top level of the hierarchy. Major criteria comprise two level, sub-criteria make up level three, and so on.
Each land mapping unit is an area which has common land-use characteristics. Sustainable evaluation of development area requires evaluate not only natural physical conditions but also socio-economic conditions. In order to determine which criteria (and at what levels or weights) affect development for each land-use type, experts are consulted to provide judgments on important of criteria. Using AHP technique these judgments on importance of criteria are converted to criteria weights (w
i). Score for each criterion (xi) on each land mapping unit is then determined. The weighted linear combination of w
18
The largest Eigen value is equal to the size of comparison matrix, or . Then calculate a measure of consistency, called Consistency Index as deviation or degree of consistency using the following formula.
(2)
After knowing the Consistency Index, the next question is how do we use this index? Prof. Saaty proposed that we use this index by comparing it with the appropriate one. The appropriate Consistency index is called Random Consistency Index (RI). The random consistency index should be 10% or less, random consistency index of sample size 500 matrices is used. The average random consistency index of sample size 500 matrices is shown in the Table 5.
Table 5 Random Consistency Index (RI)
n 1 2 3 4 5 6 7 8 9 10 RI 0 0 0.58 0.9 1.12 1.24 1.32 1.41 1.45 1.49
Some experiences in AHP process, the values of the pair wise comparison matrix will normally be well considered and not set arbitrarily. However, people’s feeling and preferences remain inconsistent and intransitive and may then lead to perturbations in the eigenvector calculations (Marinoni, 2004). Saaty (1986) defined a consistency ratio (CR) as a ratio of the consistency index CI to an average consistency index RI, thus;
(3)
RI or resulting average consistency index, also called the random index, was calculated by Saaty (1986) as the average consistency of square matrices of various orders n which he filled with random entries.
19
2.8 Rating (Absolute Measurement)
Duarte Junior (2005) defines ratings as a set of intensity levels (or categories) that serves as a base to evaluate the performance of the alternatives in terms of each criteria and/or sub criteria. The categories that form the ratings must be clearly defined, in the less ambiguous way as possible, to adequately describe the criterion/sub criteria. The rating is considered suitable as the decision makers consider it an appropriate tool to evaluate alternatives.
Figure 8 shows the hierarchy structure from the rating mode. The hierarchy begins with the global objective. The criteria are at the second level. The categories associated to the sub criteria are at the last level. The structure with ratings differs from the traditional AHP (relative measurement), because in the last level the alternatives are not found. The evaluation is performed by intensity levels (categories) attributed to each sub criteria related to each alternative, instead of evaluating the alternatives by pair wise comparisons.
The main advantage of using ratings is to decrease the number of comparisons necessary when there are a large number of alternatives. Besides, when using absolute measurement (ratings), it does not matter how many new alternatives are introduced, or old ones are excluded because there is no inversion of the alternatives ranking. In this research AHP application with ratings use the software Expert Choice version 9.50A05.
2.9 Supervised Classification
20
In supervised classification this is realized by a operator who defines the spectral characteristics of the classes by identifying simple areas (training areas). Supervised classification requires that the operator be familiar with areas of interest. The operator needs to know where to find the classes of interest in the area covered by the image. This information can be derived from general area knowledge or from dedicated field observations (Janssen and Goerte, 2000).
21
III. METHODOLOGY
3.1 Time and Location
This research was conducted from February to July 2011 that consisted of data collection, data analysis, method development, and model analysis. The data were collected from some government agencies such as meteorology, climatology, and geophysics agencies (BMKG) and rainfall gauges station near to the study area. The data analysis, method development and model analysis were accomplished at Bogor Agricultural University.
The study area is located in Banyuasin Regency, South Sumatra, Indonesia, which covers an area of 11,832.99 Km2 or about 12.18 % of South Sumatra Province and consists of 15 (fifteen) sub regencies. Banyuasin Regency is located between 10 18’ 00” and 40 00’ 00” South and 1040 40’ 00” and 1050 15’ 00” East (Figure 3), with the regency boundaries as follows: Northern part: Muara Jambi Regency, Jambi Province and Bangka Strait, Eastern part: The Air Sugihan of Ogan Komering Ilir Regency, Western - part: The Sei Lilin Sub Regency, Lais, Bayung Lencir of Musi Banyuasin regency, Southside: Abut The Sira Pulao Padang Sub Regency of Ogan Komering Ilir; Gulumbang Sub Regency, Talang Ubi Sub Regency of Muara Enim Regency.
22
3.2 Data and Tools 3.2.1 Supporting Data
The data used in the study consisted of remotely sensed data, topographic data, soil data and climate data. The tools are software required for image processing, spatial preparation process and spatial analysis as shown in Table 6.
Table 6 Supporting Data Required
No Datasets Data Format Resources Process
1. Climate Data: Daily rainfall (1989-2009) Daily Temperature (1989-2009)
Tabular BMKG in Jakarta Mapping and overlay peal, cassava ,yam and oil palm) Income of rubber and non rubber Cost of rubber and non rubber
Tabular Tree Crop Estate Statistics of Indonesia
Analysis Multi Criteria
8. Spot Imagery Bappeda Banyuasin
Regency
23
3.2.2 Hardware and Software
Some instruments and software were used to support the field data recording and data analysis process. The hardware and software needed are shown in Table 7.
Table 7 Hardware and Software
No. Hardware/Software Specification Function 1. Hand held GPS receiver Garmin 76 CSX Positioning 2. Camera digital Pocket Camera Digital Documentation 3. Mobile Computer Acer Notebook with Intel
Core 2 Duo 2.1 GHz, 4 Gigabytes of Ram
Processing Unit
4. Color Printer Hp Deskjet F2276 Hardcopy
5. ArcGis Version 9.2 Spatial Data
analysis
6. ArcView Version 3.3 Spatial Data
analysis
7. ER Mapper Version 7.0 Classification of Plantation
8. Expert Choice version 9.50A05 AHP analysis
3.3 Methods
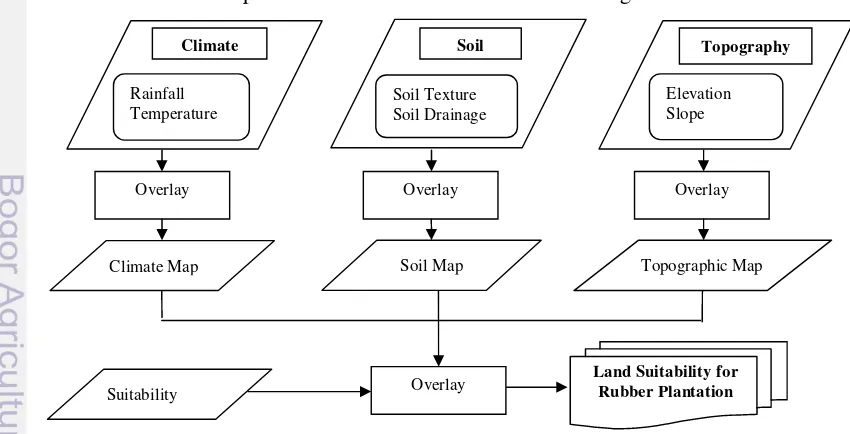
Prior to GIS data analysis, data preparation was done. Spatial data were generated based on UTM (Universal Transverse Mercator) coordinate system Zone 48 South and WGS 84 datum. The main stages carried out in this study were as follows: (1) analysis of Land Suitability for rubber plantation; (2) rubber production analysis; (3) Multi Criteria Analysis. Figure 4 shows the methodology flow chart of this research.
3.3.1 Land Suitability Analysis for Rubber Plantation
24
Retained Change with other
Commodity
Retained Developed & Management
Production
Suitable and Non Rubber Non Suitable and Rubber
Land Suitability for Rubber Plantation
Existing Rubber of Land Use
Overlay
Spatial Data Tabular Data
Data base
25
Land suitability analysis is intended to determine suitable land for cultivating specific crops or other utilization relating to agricultural activities (FAO, 1976 in Hananto, 2007).
This analysis based on is on the suitability of growing to plants the physical condition of environment consisting of soil, climate and topographic data/maps. Climate data consist of annual rainfall, number of dry months and number of wet months. Air temperature was derived from weather stations. Soil data considered in the land characteristic include soil drainage and soil texture. Topographic data consist of contour and processed to derive slope classes. The aim of this analysis is to determine land suitability for rubber plantation. To assess the overall suitability, a scoring and weighting system is applied to the various aspects of suitability are as follows:
o Rainfall data generated from monthly average precipitation data which has been collected and averaged from many years.
o Temperature data were generated such as rainfall data.
o Slope data for topography information derived from DEM of elevation data using contour line shape format.
o Soil texture and soil drainage data as physical soil characteristic information. In this study, every criterion was considered as they have an equal importance and has been given the same score in the scoring procedure, a score was assigned as shown in Table 8 depends on the input factor value.
Table 8 Structure of Suitability Classification
Categories Class Score Suitability Class S1
26
Total score = [rainfall score] + [temperature score] + [soil texture score] + [soil drainage score] + [elevation score] + [slope score] The suitability grade was calculated by averaging the total scores.
Total score
Suitability grade =
6
Table 9 Relations between Suitability Grades and Classes
Suitability Grade Suitability Class S = 1 assumed that it is highly suitable for rubber plantation. But if there is one or more factors not highly suitable, then it cannot be considered as highly suitable. In this case, if the suitability grade (S) is equal to 1, then it is assigned as highly suitable (S1) because the requirement for every factor is highly suitable. The suitability site classification steps are described in Flowchart shown in Figure 5.
Figure 5 Flowchart of Land Suitability for Rubber Plantation
Climate
Climate Map Soil Map Topographic Map
Overlay Overlay Overlay
27
3.3.2 Analysis of Existing Land Use Types
An inventory of existing land use was conducted using current land use and verified by field observation. Existing land uses were classified and the extent of their acreage determined as depicted Figure 6. The result of existing of land use analysis is used to the next analysis i.e., existing of rubber analysis.
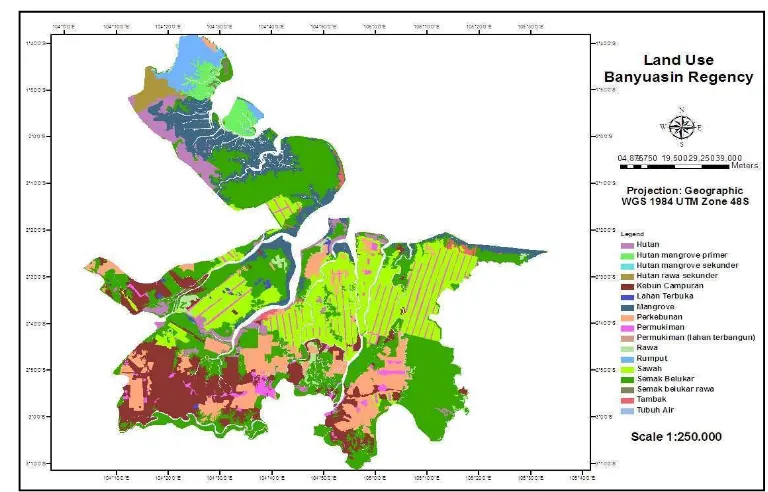
In Figure 6, eight dominant existing land use types are identified: mixed gardens (136,666 ha), settlements (38,533 ha), mangrove forest (122,212 ha), plantation (105,927 ha), shrub (351,588 ha), paddy field (198,472 ha), swamp (11,346 ha) and bare land (26,573 ha). Map of land use in Banyuasin Regency please see Figure 6.
Based on the observation, it is known that mixed gardens could support annual income; mangrove forest could supports soil erosion control; plantation provide rural employment and export commodities and soil erosion control; paddy
field support annual income and food availability; bare land supports food availability for livestock. Therefore, these land utilization types were selected as
proposed land use types to solve environmental and economic problems in the area. In Figure 7, shrub cover an area of 351,588 ha which should be developed.
28 Figure 7 Land Use Map of Banyuasin Regency
3.3.3 Existing of Rubber Plantation
The Spot image was classified using Supervised Classification technique into several types of plantations. The classification processed was completed by land use data, areas statistic data, which obtained from the Banyuasin local government.
In supervised classification the process was validated by defining the spectral characteristics of the classes by identifying simple areas (training areas). After that, all vector data required were extracted using spatial processing software. The existing of rubber plantation data resulting will be used for the next spatial processing.
3.3.4 Productivity of Rubber Analysis
29 ‘suitable but planted with rubber’ and the last condition is ‘suitable but not planted with rubber’.
The first condition will be excluded, but the second and the third condition were overlaid with productivity of rubber in 2009. The results of this overlay if high productivity value can retained to keep planted with rubber but for low productivity value can recommended to keep plant with rubber until produce wood, after that to change planted with other crops which suitable with characteristic of land suitability or develop rubber plantation along with production management.
The land suitable but not planted with rubber or the fourth condition was spatially analyzed with existing shrub, then to shrub areas was analyzed using multi criteria analysis using Analytical Hierarchy Process (AHP) to determine area priority to be developed as rubber plantation in sub regencies of Banyuasin Regency.
3.3.5 Multi Criteria Analysis
This research aimed at applying the Analytic Hierarchy Process (AHP) with ratings method to select area development of rubber in sub regency of Banyuasin Regency. Using ratings means categorizing previously defined criteria and/or sub-criteria in study to classify alternatives.
30 Table 10 Scale and Definition of Pair-wise Comparisons
(Saaty and Vargas, 1991)
No Intensity of
Importance Definition
1 1 Equal Importance
2 3 Moderate importance of one factor over another 3 5 Strong or essential importance
4 7 Very strong importance
5 9 Extreme importance
6 2.4.6.8 Intermediate value between the two adjacent judgments
7
Reciprocals of above non-zero
numbers
If an activity has one of the above numbers (e.g. 3) compared with a second activity, then the second activity has the reciprocal value (i.e., 1/3) then compared to the first
Applying this step to development area analysis, decision criteria relevant to our goal were identified and arranged in the hierarchy illustrated in Figure 8.
Within each level of the hierarchy, the relative importance between each pair of criteria (or among pairs of sub-criteria relating to an upper single criterion) to the overall goal is evaluated. A nine-point scale is used for these evaluations. The third and final step in the AHP requires evaluation of the pair-wise comparison matrices using measurement theory. A standardized eigenvector is
Priority Development of
Figure 8 Rela tionship a mong goal, criteria, sub-criteria a nd a lternatives in AHP.
Alt ernat ives
Sub Regency B
31 extracted from each comparison matrix, allowing us to assign weights to criteria and sub-criteria. In this research, the decision matrix is formed to obtain the value of importance of the criteria, sub criteria and ratings. These values attribute are based on Saaty Fundamental Scale (Saaty, 1980). For each decision, the Consistency Ratio (CR) is calculated.
When dealing with multidiscipline expert with various judgments, it is important to check one by one of those consistencies of judgments. The selected result that has good consistency should be merged into one value. To merge the values of expert judgment, geometric mean method can be used (Marimin, 2008 in Nugroho, 2010). Pair wise comparison matrix process will use the result of geometric average method. The result of the completed questionnaire distributed to experts as main input data to calculate matrix.
The ratings with AHP method considered social and economic factors. This analysis has a purpose to determine priorities of sub regency for rubber development. Social factor used several variables such as area of rubber and number of rubber farmer. Economic factor used also two variables i.e. ratio income of rubber with non rubber and ratio cost of rubber with non rubber.
32 IV. RESULT AND DISCUSSION
This research is divided into three major parts: land suitability analysis for rubber plantation, productivity rubber analysis, and multi criteria analysis.
4.1 General Condition of the Study Area 4.1.1 Topography
The most important elements in topography are relief/slope and elevation. The relief is related to land management and erosion hazard, while elevation is related to temperature and solar radiation and thus closely linked to plant requirements. According to the topography, Banyuasin Regency consists of 80% lowland in the form of coastal area, tidal swampy area are lowland at Banyuasin river stream consisting 20% of plateau and hilly area with a height ranging from 20 to 140 meter of above sea level.
4.1.2 Climate
Air temperature and rainfall data will be obtained from BMKG in Jakarta. The average air temperature in South Sumatra Province ranges from 25 to 270C. Rainfalls throughout the year, the heaviest rainfall occurred during the rainy season which lasts from November to April.For land evaluation, the required data are annual rainfall and the number of dry and wet months. Oldeman (1975) climatic classes are based on the number of consecutive wet months and dry months. The wet months are the months. This criterion is more applicable for annual crops. In the study area has tropical climate with variation of rainfall 1.97 mm/year – 13.32 mm/year.
4.1.3 Land Use and Land Cover
33 197.452 ha; forests 57.627 ha; irrigation 77.050 ha, non-irrigated dry field and farm 50.258 ha unused land 99.982 ha.
4.1.4 Demography Condition
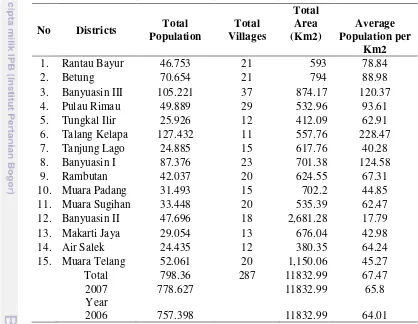
The demography conditions of study area is based on the population, total villages, total areas and average population per square Km as shown in Table 11.
Table 11 Number of Population, Total Villages, Total Area and Average Number of Population per square km by Sub Regency in Banyuasin Regency
No Districts Total
Source: Banyuasin in Figure, 2008
4.2 Land Suitability Analysis for Rubber Plantation
34 4.2.1 Temperature
The water availability zones were obtained from the isohyets line of rainfall average data of several rainfall observation stations. Rubber likely grows and develops in humid area with warm temperature. Optimal temperature range for rubber is 260C – 300C.
Based on data from 6 climatology stations in South Sumatra Province between years 1980 and 2002, the average temperature is about 26.5 0C without more one dry month in every year (Table 12). Figure 9 shows temperature in Banyuasin Regency. There is one class e.i. highly suitable area (S1).
Table 12 Summary of Climate Condition from Different Station
CLIMATE Wet Season, if rainfall > 100 mm/month
Dry Season, if rainfall < 60 mm/month
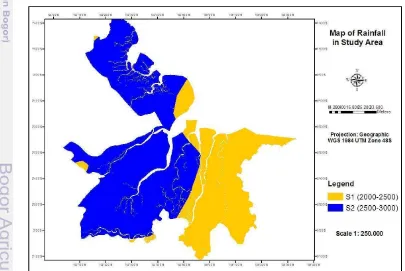
4.2.2 Rainfall
Optimal annual rainfall range for rubber is 2500–3000 mm/years, respectively. The average of rainfall in Banyuasin Regency is 2500 mm/years. Rainfall distribution has an important role to determine climate suitability area for rubber in Banyuasin Regency because temperature and the number of wet and dry months are very suitable.
35 Figure 9 Map of Temperature in Study Area
36 4.2.3 Soil Texture
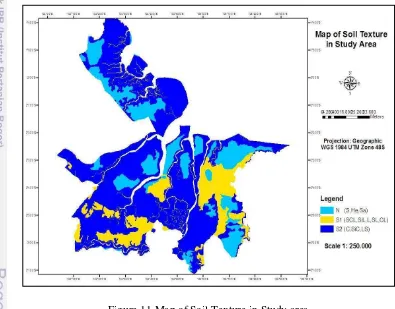
The Map of Tanah Semi Detail from BBSDLP classified the soil textures and soil drainage. Figure 11 shows soil texture for rubber in Banyuasin Regency. Figure 11 clearly described the highly suitable area (S1) in yellow color, moderately suitable area (S2) in blue color, not suitable area (N) in young blue color.
It was found that about 14.6% of Banyuasin Regency is highly suitable (S1); about 65.7%is moderately suitable (S2); and 19.4%is not suitable (N) for rubber plantation.
Figure 11 Map of Soil Texture in Study area
4.2.4 Soil Drainage
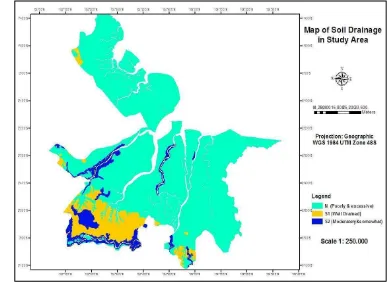
37 Figure 12 Map of Soil Drainage in Study area
The soil drainage is in the study area are distributed in three classes e.i about 9.89% is highly suitable (S1); about6.77%ismoderately suitable (S2); and 82.99% is not suitable (N). There are dominated by poorly drained, excessively drained or not suitable (N).
4.2.5 Topography
38 4.2.6 Overlay Process
After all suitability data of rubber plantation for each factor are ready, to next step was cropping to overlay all suitability data for climate, soil and topography with similar weight. So, each criterion has similar influence to determine land suitability map.
The results from overlay process are parcels that are obtained from intersecting between suitability levels of each factor. The results of this process were used for productivity of rubber analysis.
The results from the above overlay process the land suitability map for rubber plantation is obtained. The areas were divided into two parts: highly suitable area (S1) in yellow color, and moderately suitable area (S2) in blue color. According to The Regional Spatial Planning (RTRW) of Banyuasin Regency, all areas are not allowed for the use of single purpose. Figure 13 shows the land suitability for rubber plantation in study area.
39 Figure 13 Land Suitability for Rubber Plantation
4.3 Existing of Rubber Plantation
40 Figure 14 Plantation Existing in Banyuasin Regency
41 Table 13 shows the existing condition of rubber trees on suitable area based on location of sub regency. From the result of spatial analysis, the largest area from total of existing rubber areas (S1) in Banyuasin III Sub Regency is about 8,310 ha or 0.8% and for S2 in Banyuasin I Sub Regency about 24,684 ha or 2.3%, then the smallest area from the total of existing rubber areas (S1) in Rambutan Sub Regency about 4.24 ha or 0.0% and for S2 in Banyuasin III Sub Regency about 0.11 ha or 0.0%. The smallest areas in Rambutan Sub Regency most of the land are due to converted of land to residential areas, shops and mixed garden.
Table 13 Existing of Rubber in Banyuasin Regency
No. Sub Regency Suitable, Rubber Area (Ha) Suitability Percentage (%)
1. Banyuasin I S2 Rubber 24,684 2.3
2. Banyuasin III S1 Rubber 8,310 0.8
S2 Rubber 0.106 0.0
3. Betung S1 Rubber 2,735 0.3
S2 Rubber 64.577 0.0
4. Makarti Jaya S2 Rubber 64.984 0.0
5. Muara Padang S2 Rubber 43,910 0.4
6. Rambutan S1 Rubber 4.238 0.0
S2 Rubber 52,340 0.5
7. Rantau Bayur S1 Rubber 61,380 0.6
8. Talang Kelapa S1 Rubber 153.274 0.0
S2 Rubber 42.202 0.0
9. Tungkal Ilir S1 Rubber 18.302 0.0
S2 Rubber 455.981 0.0
10. Pulau Rimau S2 Rubber 1,004 0.1