DETERMINATION OF THE TRANSJAKARTA BUSWAY GAS
PIPELINE USING GEOGRAPHIC INFORMATION SYSTEM
AND MULTICRITERIA DECISION MAKING
Firman Primahardhika
GRADUATE SCHOOL
STATEMENT
I, Firman Primahardhika, hereby state that this thesis entitled:
Determination of The Transjakarta Busway Gas Pipeline Using Geographic Information System and Multicriteria Decision Making
are results of my own work during the period of August until December 2006, and that it has not been published before. The content of the thesis has been examined by the supervisory committee and the external examiner.
Bogor, March 2007
DETERMINATION OF THE TRANSJAKARTA BUSWAY GAS
PIPELINE USING GEOGRAPHIC INFORMATION SYSTEM
AND MULTICRITERIA DECISION MAKING
Firman Primahardhika G051034031
A Thesis submitted for the degree of Master of Science of Bogor Agricultural University
MASTER OF SCIENCE IN INFORMATION TECHNOLOGY
FOR NATURAL RESOURCE MANAGEMENT
GRADUATE SCHOOL
Thesis Title : Determination of the Transjakarta Busway Gas Pipeline Using Geographic Information System and Multicriteria Decision Making
Student Name : Firman Primahardhika
Student ID : G051034031
Study Program : Master of Science in Information Technology for Natural Resource Management
Approved by,
Advisory Board
Dr. Ir. I Wayan Astika, M.Si Ir. Iwan Setiawan, PM Supervisor Co – Supervisor
Endorsed by,
Program Coordinator Dean of the Graduate School
Dr. Ir. Tania June, M.Sc Prof. Dr. Ir. Khairil A. Notodiputro, MS
ACKNOWLEDGEMENTS
In the Name of Allah Subhana Wa Ta’ala, the Almighty, the Most
Merciful, we begin. O Allah, I seek Your help, I seek refuge on You from grief and
disabilities. You grant knowledge, You sprout up the courage to pace, and You
smoothen the way to the finish line…Alhamdulillahi robbil’ alamin.
First, I am very grateful to my mother for her mentally support and sincere dedication in bringing me into success, my father who had funded me during the study period in MIT Program, also my sisters and my brother for their love and support.
I also would like to thank to Dr. Ir. I Wayan Astika, M.Si and Iwan Setiawan, S.Si, PM who gave me advice, guidance and encouragement, as my supervisor and co-supervisor respectively until my research “Determination of the Transjakarta Busway Gas Pipeline Using Geographic Information System and Multicriteria Decision Making” is finished.
Finally, I would like to thank also to Dr. Ir. Tania June, M.Sc as MIT Program Coordinator, MIT Lecturers, Students, and Staffs, thank you for helping and supporting me.
Bogor, March 2007
CURRICULUM VITAE
ABSTRACT
FIRMAN PRIMAHARDHIKA (2007). Determination of The Transjakarta Busway Gas Pipeline Using Geographic Information System and Multicriteria Decision Making. Under the supervision of I WAYAN ASTIKA and IWAN SETIAWAN.
Transportation and pollution has become a severe problem in many big cities in developing countries, include Indonesia especially in Indonesia’s capital city, Jakarta. Over usage of petroleum, pollution and heavy traffic problem in Jakarta has become a more complicated case in the daily life. Meanwhile, compressed natural gas (CNG) is a clean burning, high energy, alternative energy source that enables us to safely continue to build on and improve our current lifestyle in the future. Transjakarta Busway is currently preparing to use compressed natural gas for powering the busway and it will need to define the best pipeline route from the existing main gas source to the CNG Station by considering cost, safety, social conflict, etc.
The objective of this research is to determine the best route for a gas transmission pipeline network that considers various criteria for minimizing adverse. The methods of this research is based on multi criteria decision making by implementing GIS model technology refers to spatial analyst and network analyst that will produce possibility alternative routes. Having established alternative routes, each criterion and alternatives should be evaluated and weighted using pairwise comparison in term of analytical hierarchy process (AHP) to identify the best route for a gas transmission pipeline into the most preferred route.
The model is concerned only with distribution lines, in areas that are already largely urbanized or industrialized. The distribution pipes will be installed under the shoulder of existing roadways and beside existing utilities. So no land needs to be purchased, and no one will be displaced. There will be some very temporary (up to one day) disruption to businesses, residents, and other facilities along the roadsides and utilities as the pipe construction, dig, bury, and test the piping. This is unavoidable, but it has standard operating procedures and various prevention and mitigation measures in place, based upon long experiences, to minimize these disruptions. This model has been applied in Transjakarta Busway Corridor VII. It was found that the best CNG pipeline route was in Kramat Jati.
TABLE OF CONTENTS
STATEMENT ... i
ACKNOWLEDGMENT... ii
CURRICULUM VITAE ... iii
ABSTRACT ... iv
TABLE OF CONTENTS ...v
LIST OF TABLES ... viii
LIST OF FIGURES ... ix
LIST OF APPENDICES ... xi
I.
INTRODUCTION ...1
1.1. Background ...1
1.2. Problem Statement ...3
1.3. Objective ...3
1.4. Research Scope ...3
II.
LITERATURE REVIEW ...5
2.1. Compressed Natural Gas...5
2.1.1. Affordability ...6
2.1.2. Performance ...6
2.1.3. Safety ...6
2.1.4. Process for Powering Vehicles ...7
2.1.5. Emission Characteristics ...7
2.2. Geographic Information System ...7
2.2.1. Three View of GIS ...8
2.2.2. Representation of Geographic Phenomena ...8
2.2.3. Spatial Reference ...10
2.3.2. Network Analysis...12
2.3.3. 3D Data Structures ...14
2.3.4. 3D Data Capture ...14
2.4. Analytical Hierarchy Process ...15
III.
METHODOLOGY ...16
3.1.Time and Location ...16
3.2. Methods...16
3.2.1. Need Analysis ...18
3.2.2. Define Goal and Objectives ...18
3.2.3. Conceptual Design ...18
3.2.3.1. Data Preparation ...20
3.2.3.2. Procedure ...21
3.2.3.3. Required Tools ...23
3.2.4. Spatial Data Processing ...24
3.2.4.1. Map Projection ...24
3.2.4.2. Formatting and Editing ...24
3.2.4.3. Euclidiean Distance Analysis ...24
3.2.4.4. Proximity Analysis...24
3.2.5. Decision Making ...24
3.2.5.1. Criteria Weighting ...25
3.2.5.2. Alternatives Scoring...27
3.2.6. Selecting Alternative ...27
IV.
RESULTS AND DISCUSSIONS ...28
4.1. Need Analysis ...28
4.2. Goal and Objective ...29
4.3. Conceptual Design ...30
4.4. Data Processing ...34
4.5. Decision Making ...36
4.5.1. Criteria Weighting ...40
4.5.2. Alternative Scoring ...41
4.6. Sensitivity Analysis ...44
4.7. Potential Problem in Model Implementation ...46
V.
CONCLUSIONS AND RECOMMENDATIONS ...47
5.1. Conclusions ...47
5.2. Recommendations ...48
DETERMINATION OF THE TRANSJAKARTA BUSWAY GAS
PIPELINE USING GEOGRAPHIC INFORMATION SYSTEM
AND MULTICRITERIA DECISION MAKING
Firman Primahardhika
GRADUATE SCHOOL
STATEMENT
I, Firman Primahardhika, hereby state that this thesis entitled:
Determination of The Transjakarta Busway Gas Pipeline Using Geographic Information System and Multicriteria Decision Making
are results of my own work during the period of August until December 2006, and that it has not been published before. The content of the thesis has been examined by the supervisory committee and the external examiner.
Bogor, March 2007
DETERMINATION OF THE TRANSJAKARTA BUSWAY GAS
PIPELINE USING GEOGRAPHIC INFORMATION SYSTEM
AND MULTICRITERIA DECISION MAKING
Firman Primahardhika G051034031
A Thesis submitted for the degree of Master of Science of Bogor Agricultural University
MASTER OF SCIENCE IN INFORMATION TECHNOLOGY
FOR NATURAL RESOURCE MANAGEMENT
GRADUATE SCHOOL
Thesis Title : Determination of the Transjakarta Busway Gas Pipeline Using Geographic Information System and Multicriteria Decision Making
Student Name : Firman Primahardhika
Student ID : G051034031
Study Program : Master of Science in Information Technology for Natural Resource Management
Approved by,
Advisory Board
Dr. Ir. I Wayan Astika, M.Si Ir. Iwan Setiawan, PM Supervisor Co – Supervisor
Endorsed by,
Program Coordinator Dean of the Graduate School
Dr. Ir. Tania June, M.Sc Prof. Dr. Ir. Khairil A. Notodiputro, MS
ACKNOWLEDGEMENTS
In the Name of Allah Subhana Wa Ta’ala, the Almighty, the Most
Merciful, we begin. O Allah, I seek Your help, I seek refuge on You from grief and
disabilities. You grant knowledge, You sprout up the courage to pace, and You
smoothen the way to the finish line…Alhamdulillahi robbil’ alamin.
First, I am very grateful to my mother for her mentally support and sincere dedication in bringing me into success, my father who had funded me during the study period in MIT Program, also my sisters and my brother for their love and support.
I also would like to thank to Dr. Ir. I Wayan Astika, M.Si and Iwan Setiawan, S.Si, PM who gave me advice, guidance and encouragement, as my supervisor and co-supervisor respectively until my research “Determination of the Transjakarta Busway Gas Pipeline Using Geographic Information System and Multicriteria Decision Making” is finished.
Finally, I would like to thank also to Dr. Ir. Tania June, M.Sc as MIT Program Coordinator, MIT Lecturers, Students, and Staffs, thank you for helping and supporting me.
Bogor, March 2007
CURRICULUM VITAE
ABSTRACT
FIRMAN PRIMAHARDHIKA (2007). Determination of The Transjakarta Busway Gas Pipeline Using Geographic Information System and Multicriteria Decision Making. Under the supervision of I WAYAN ASTIKA and IWAN SETIAWAN.
Transportation and pollution has become a severe problem in many big cities in developing countries, include Indonesia especially in Indonesia’s capital city, Jakarta. Over usage of petroleum, pollution and heavy traffic problem in Jakarta has become a more complicated case in the daily life. Meanwhile, compressed natural gas (CNG) is a clean burning, high energy, alternative energy source that enables us to safely continue to build on and improve our current lifestyle in the future. Transjakarta Busway is currently preparing to use compressed natural gas for powering the busway and it will need to define the best pipeline route from the existing main gas source to the CNG Station by considering cost, safety, social conflict, etc.
The objective of this research is to determine the best route for a gas transmission pipeline network that considers various criteria for minimizing adverse. The methods of this research is based on multi criteria decision making by implementing GIS model technology refers to spatial analyst and network analyst that will produce possibility alternative routes. Having established alternative routes, each criterion and alternatives should be evaluated and weighted using pairwise comparison in term of analytical hierarchy process (AHP) to identify the best route for a gas transmission pipeline into the most preferred route.
The model is concerned only with distribution lines, in areas that are already largely urbanized or industrialized. The distribution pipes will be installed under the shoulder of existing roadways and beside existing utilities. So no land needs to be purchased, and no one will be displaced. There will be some very temporary (up to one day) disruption to businesses, residents, and other facilities along the roadsides and utilities as the pipe construction, dig, bury, and test the piping. This is unavoidable, but it has standard operating procedures and various prevention and mitigation measures in place, based upon long experiences, to minimize these disruptions. This model has been applied in Transjakarta Busway Corridor VII. It was found that the best CNG pipeline route was in Kramat Jati.
TABLE OF CONTENTS
STATEMENT ... i
ACKNOWLEDGMENT... ii
CURRICULUM VITAE ... iii
ABSTRACT ... iv
TABLE OF CONTENTS ...v
LIST OF TABLES ... viii
LIST OF FIGURES ... ix
LIST OF APPENDICES ... xi
I.
INTRODUCTION ...1
1.1. Background ...1
1.2. Problem Statement ...3
1.3. Objective ...3
1.4. Research Scope ...3
II.
LITERATURE REVIEW ...5
2.1. Compressed Natural Gas...5
2.1.1. Affordability ...6
2.1.2. Performance ...6
2.1.3. Safety ...6
2.1.4. Process for Powering Vehicles ...7
2.1.5. Emission Characteristics ...7
2.2. Geographic Information System ...7
2.2.1. Three View of GIS ...8
2.2.2. Representation of Geographic Phenomena ...8
2.2.3. Spatial Reference ...10
2.3.2. Network Analysis...12
2.3.3. 3D Data Structures ...14
2.3.4. 3D Data Capture ...14
2.4. Analytical Hierarchy Process ...15
III.
METHODOLOGY ...16
3.1.Time and Location ...16
3.2. Methods...16
3.2.1. Need Analysis ...18
3.2.2. Define Goal and Objectives ...18
3.2.3. Conceptual Design ...18
3.2.3.1. Data Preparation ...20
3.2.3.2. Procedure ...21
3.2.3.3. Required Tools ...23
3.2.4. Spatial Data Processing ...24
3.2.4.1. Map Projection ...24
3.2.4.2. Formatting and Editing ...24
3.2.4.3. Euclidiean Distance Analysis ...24
3.2.4.4. Proximity Analysis...24
3.2.5. Decision Making ...24
3.2.5.1. Criteria Weighting ...25
3.2.5.2. Alternatives Scoring...27
3.2.6. Selecting Alternative ...27
IV.
RESULTS AND DISCUSSIONS ...28
4.1. Need Analysis ...28
4.2. Goal and Objective ...29
4.3. Conceptual Design ...30
4.4. Data Processing ...34
4.5. Decision Making ...36
4.5.1. Criteria Weighting ...40
4.5.2. Alternative Scoring ...41
4.6. Sensitivity Analysis ...44
4.7. Potential Problem in Model Implementation ...46
V.
CONCLUSIONS AND RECOMMENDATIONS ...47
5.1. Conclusions ...47
5.2. Recommendations ...48
LIST OF TABLES
No.
Caption
Page
1.
Importance Level ...25
2.
Random Consistency Index ...27
3.
The Dataset ...30
4.
Alternatives of Pipeline Routes ...38
5.
Description of Criteria ...40
6.
Criteria Preferences ...40
7.
Range of Value of Criteria ...41
8.
Value of Each Criteria to Each Alternative ...41
9.
Normalized Scoring of Each Criteria to Each Alternative ...42
10.
Normalized Weight of Alternative ...42
LIST OF FIGURES
No.
Caption
Page
LIST OF APPENDICES
No.
Caption
Page
I.
INTRODUCTION
1.1.Background
Transportation and pollution has become a severe problem in many big cities in developing countries. In most cases, the development process has increased the need for mobility as there are changes in land-use. Eventually, the increasing needs for mobility has driven the transport system towards an unsustainable path. This can be seen for example how the development of roads and highways has ignored the development of public transport and the use of alternative energy for transport modes. At the end, the development of transportation sector in many cities has benefited only the have society and at the same time has dropped off those in lower class.
Over usage of petroleum, pollution and heavy traffic problem in Jakarta has become a more complicated case in the daily life. It is assumed that the whole problems were initiated from oversight policy of establishing transportation system for the city. Many studies have been conducted to solve the transportation problem in Jakarta, such as the mass-transit corridors, different types of mass rapid transit and even a transport master plan. However, after several delays, the local government of Jakarta launched the Transjakarta busway on January 15th, 2004.
Earlier in April 2006, in compliance with the implementation of Bylaw No. 2/2005 on air pollution control endorsed in February 2006, local government, state oil and gas company PT Pertamina and gas distributor PT PGN have signed a Memorandum of Understanding regarding the CNG supply to the Transjakarta busway. This MoU is indicating the efforts to gradually replace high emission-vehicles using gasoline with CNG-powered ones, which have lower emissions in order to reduce air pollution in Jakarta (the world's third-most polluted city after Mexico City and Bangkok).
source that enables us to safely continue to build on and improve our current lifestyle in the future.
Gas price is considered as more competitive than other fuel prices currently at 30% discount of the subsidized diesel price. The Indonesian Government is likely to increase the fuel subsidy (meaning that diesel prices could increase by up to 40% over the present cost), making gas looking even more attractive and providing some higher pricing power (Soejachmoen, 2004).
Four private companies had shown some interests in building gas networks connecting the city's existing CNG pipeline to the two planned CNG stations called SPBG (Stasiun Pengisian Bahan Bakar Gas) on Jl. Perintis Kemerdekaan in North Jakarta and at Kramat Jati, East Jakarta. The two CNG stations will cater for 200 buses on routes linking Pulogadung in East Jakarta to Harmoni in Central Jakarta and from Kampung Melayu to Kampung Rambutan in East Jakarta.
Transjakarta Busway is currently preparing to meet the challenges of the proposed Jakarta Gas Pipeline Mapping System by creating a user-friendly, Intra and Internet-based geographic information system (GIS) from existing digital map sources. These digital sources were developed as part of an ongoing pipeline classification study aimed at determining population trends and density surrounding the existing CNG pipeline. The use of CNG is a final for the Transjakarta Busway project and will expand to other public transportation vehicles in the city.
GIS is explicitly designed to manage and combine large amounts of spatially distributed data. In fact, gas transmission pipeline network can be thought of as a special case of land suitability analysis that drove much of GIS' early development. Quantitative methods for GIS model calibration and weighting are needed for model clarity, consistency, objectivity, and defend ability. Thus, the responses from the experts are combined to calibrate the criteria and the weighting responses are kept separately to represent a community and an environmental perspective.
1.2.Problem Statement
GIS-based approaches for piping gas transmission lines utilize relative rankings and weights in considering factors affecting potential routes. The weights for numerous factors, such as slope, proximity to existing roads, proximity to existing utilities and population density, are established for each grid cell location then being analyzed for the overall “most preferred path” in a project area. In practice, the criteria rankings and sub-model weighting are altered to identify a set of alternatives to evaluated for the best route.
1.3.Objective
The objective of this research is to determine the best route for a gas transmission pipeline network that considers various criteria for minimizing adverse. Thus, this objective is divided into three sub goals:
1. To develop spatial model based on criteria given to obtain suitable area 2. To establish relative score among map layers for comparing decision
criteria.
3. Plotting the map of optimal gas transmission pipeline network
1.4. Research Scope
GIS spatial analyst to obtain suitable area based on criteria and Analytical Hierarchy Process (AHP) to establish relative scores among alternatives.
An earlier study was conducted by PGN in 2004 stated six criteria for determining gas transmission pipeline based on stakeholder judgment as shown below:
1. SPBG must close to the busway corridor 2. SPBG must be at bus terminal or busway pool
3. The route should minimize areas having high housing density 4. The route should align with the main roads
5. The route should minimize areas within or near public services (hospital, shopping centre, industrial area, etc)
6. The route should align the existing utilities (power line, telecom line, water pipeline, etc)
II.
LITERATURE REVIEW
Alternative fuel is any material or substance, other than petroleum (oil),
which is consumed to provide energy to power an engine. The need for the
development of alternative fuel sources has been growing due to concerns that the
production of oil will no longer supply the demand. Some alternative fuels are
biodiesel, ethanol, chemically stored electricity (batteries and fuel cells),
hydrogen, methane, vegetable oil, wood, and natural gas.
Natural gas is an organic compound that is found deep within the earth. It
is a fossil fuel formed over millions of years of geological pressures and changes.
Natural gas is primarily methane comprised of hydrogen and carbon. It is a safe
fuel source that is commonly used in homes and businesses for heating, lighting
and cooking (McKenzie, 2006).
Natural gas is an ideal fuel source for many reasons, including safety.
Natural gas is lighter than air. This means that it will not puddle (like gasoline) or
sink to the ground like propane, which is heavier than air. Instead, natural gas will
rise and dissipate in the atmosphere. Natural gas also has a higher ignition
temperature. This means that it is much harder to ignite. Also the storage systems
used for compressed natural gas are infinitely stronger that the gasoline tanks
found on cars and trucks today (McKenzie, 2006).
2.1. Compressed Natural Gas
Compressed natural gas or CNG is natural gas under pressure which
remains clear, odorless, and non-corrosive. Although vehicles can use natural gas
as either a liquid or a gas, most vehicles use the gaseous form compressed to high
pressures at 3000 to 3600 pounds per square inch (California Energy Commission,
2006). CNG is a domestically available, economical, clean burning, alternative
fuel source for vehicles. It consists mostly of methane and is drawn from gas
wells or in conjunction with crude oil production. An odorant is normally added to
2.1.1. Affordability
The CNG market is more stable than the gasoline market. CNG generally
costs 15 to 40 percent less than gasoline or diesel. CNG requires more frequent
refueling, however, because it contains only about a quarter of the energy by
volume of gasoline (US Department of Energy, 2002).
2.1.2. Performance
Based on properties table of fuels (Appendix 5), octane rating for CNG is
higher than that for gasoline; in a dedicated engine, a CNG vehicle’s power,
acceleration, and cruise speed can be greater than that of a gasoline-powered
vehicle. In addition, due to the cleaner burning characteristics of natural gas,
CNG vehicle engines can run more efficiently than a gasoline-powered vehicle,
thereby extending the life of the vehicle. In heavy-duty vehicles, CNG engines are
also generally less noisy than diesel engines (US Department of Energy, 2002).
2.1.3. Safety
Although CNG is a flammable gas, it has a narrow flammability range,
making it an inherently safe fuel. Strict safety standards make CNG vehicles as
safe as gasoline-powered vehicles. In the event of a spill or accidental release,
CNG poses no threat to land or water; it is nontoxic. CNG also disperses rapidly,
minimizing ignition risk relative to gasoline. Natural gas is lighter than air and
will not pool as a liquid or vapor on the ground. Nevertheless, leaks indoors may
form a flammable mixture in the vicinity of an ignition source. CNG is primarily
methane, however, which is a greenhouse gas that could contribute to global
climate change if leaked. Methane is slightly soluble in water and under certain
environmental conditions (anaerobic) does not biodegrade; if excess amounts
accumulate, the gas can bubble from the water, possibly creating a risk of fire or
explosion. Natural gas also has a higher ignition temperature. This means that it is
much harder to ignite. Also the storage systems used for compressed natural gas
are infinitely stronger that the gasoline tanks found on cars and buses today.
Reported incidences of bus fires are related to engine failures, not the use of
devices, such as tank safety valves that allow fuel flow only when the engine is
keyed on. Also, the tanks must be inspected and approved by the Department of
Transportation after certain periods of use.
2.1.4. Process for Powering Vehicles
Natural gas is compressed and enters the vehicle through the natural gas
dispenser or fill post. It flows into high-pressure cylinders that are located on the
vehicle. When the driver steps on the accelerator, the natural gas leaves the
on-board storage cylinder, passes through the high-pressure fuel line and enters the
engine compartment. Gas then enters the regulator, which reduces pressure from
up to 3,600 psi to approximately atmospheric pressure. The natural gas solenoid
valve allows natural gas to pass from the regulator into the gas mixer or fuel
injectors. Natural gas mixed with air flows down through the carburetor or fuel
injection system and enters the engine's combustion chambers.
2.1.5. Emission Characteristics
Actual emissions will vary with engine design; these numbers reflect the
potential reductions offered by compressed natural gas, relative to conventional
gasoline.
• Reductions in carbon monoxide emissions of 90 to 97 percent, and reductions in carbon dioxide emissions of 25 percent.
• Reductions in nitrogen oxide emissions of 35 to 60 percent.
• Potential reductions in non-methane hydrocarbon emissions of 50 to 75 percent.
• Fewer toxic and carcinogenic pollutants and little to no particulate matter produced.
• No evaporative emissions in dedicated engines (such as those associated
with gasoline or diesel).
2.2. Geographic Information System
referenced information. A geographic information system (GIS) can link
information (attributes) to location data, such as people to addresses, buildings to
parcels, or streets within a network. Then layer that information to give a better
understanding of how it all works together.
2.2.1. Three Views of GIS
A GIS is most often associated with a map. A map, however, is only one
way you can work with geographic data in a GIS, and only one type of product
generated by a GIS. This is important, because it means that a GIS can provide a
great deal more problem-solving capabilities than using a simple mapping
program or adding data to an online mapping tool (Berry, 1995).
A GIS can be viewed in three ways:
1. The Database View: A GIS is a unique kind of database of the world—a
geographic database (geodatabase). It is an "Information System for
Geography". Fundamentally, a GIS is based on a structured database that
describes the world in geographic terms.
2. The Map View: A GIS is a set of intelligent maps and other views that show
features and feature relationships on the earth's surface. Maps of the
underlying geographic information can be constructed and used as "windows
into the database" to support queries, analysis, and editing of the information.
This is called geovisualization.
3. The Model View: A GIS is a set of information transformation tools that
derive new geographic datasets from existing datasets. These geoprocessing
functions take information from existing datasets, apply analytic functions,
and write results into new derived datasets.
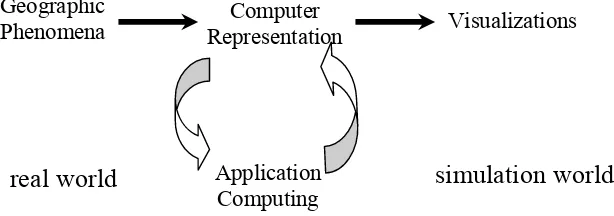
2.2.2. Representation of Geographic Phenomena
GIS supports such study because it represents phenomena digitally in a
computer. GIS also allows visualizing this representation in various ways.
Geographic phenomena exist in the real world: for true example, one has to look
outside the window. In using GIS software, we first obtain some computer
faithfully possible. This is where we speak of spatial data. We continue to
manipulate the data with techniques usually specific to the application domain, for
instance, in geology, to obtain a geological classification. This may result in
additional computer representations, again stored in bits and bytes. For true
examples of this representation, one has to look into the files in which they are
stored. One would see the bits and bytes, but very exciting this would not be.
Therefore, we can use the GIS to create visualizations from the computer
[image:32.612.150.457.248.356.2]representations, either on-screen, printed on paper, or otherwise.
Figure 1. Representation of Geographic Phenomena (de By, 2000)
Geographic phenomena can be named, described, georeferenced (A
coordinate system with well-defined origin and orientation of the three
orthogonal, coordinate axes–spatial reference system), and assigned a time or
interval. Type of Geographic data:
a. Continuous data
Continuous data, or a continuous surface, represents phenomena where each
location on the surface is a measure of the concentration level or its relationship
from a fixed point in space or from an emitting source. Continuous data is also
referred to as field, nondiscrete, or surface data. One type of continuous surface
data is derived from those characteristics that define a surface, where each
location is measured from a fixed registration point. These include elevation (the
fixed point being sea level) and aspect (the fixed point being direction: north, east,
south, and west). Geographic Phenomena
Computer
Representation Visualizations
real world
Applicationsimulation world
b. Discrete field
Discrete data, which is sometimes called categorical or discontinuous data, mainly
represents objects in both the feature and raster data storage systems. A discrete
object has known anrialise the coordinate d definable boundaries. It is easy to
define precisely where the object begins and ends. A lake is a discrete object
within the surrounding landscape. Where the waters edge meets the land can be
definitively established. Other examples of discrete objects include buildings,
roads, and land parcels. Discrete objects are usually nouns.
2.2.3. Spatial Reference
The geometry and motion of objects in 3D Euclidean space are described
in a reference coordinate system. A reference coordinate system is a coordinate
system with well-defined origin and orientation of the three orthogonal,
coordinate axes. Usually it refers to such a system as a Spatial References System
(SRS).
To represent parts of the surface of the Earth on a flat paper map or on
computer screen, the curved horizontal reference surface must be mapped onto the
2D mapping plane. The reference surface is usually an oblate ellipsoid for
large-scale mapping, and sphere for small-large-scale mapping. Mapping onto a 2D mapping
plane means assigning plane Cartesian coordinates (x, y) to each point on the
reference surface with geographic coordinates (Φ, λ).
A map projection uses mathematical formulas to relate spherical
coordinates on the globe to flat, planar coordinates. Different projections cause
different types of distortions. Some projections are designed to minimize the
distortion of one or two of the data's characteristics. A projection could maintain
the area of a feature but alter its shape. In the graphic below, data near the poles is
stretched.
Any map projection is associated with distortions. There is simply no way
to flatten out a piece of ellipsoidal or spherical surface without stretching some
parts of the surface more than others. Some map projections can be visualized as
true geometric projections directly onto the mapping plane, or onto an
choices for such intermediate surfaces are cones and cylinders. Such map
projections are then called azimuthal, conical, and cylindrical, respectively.
Figure 2. Map Projection (ESRI, 2005)
There are many supported map projection, in this case Universal
Transverse Mercator (UTM) is applied. This system is a specialized application of
the Transverse Mercator projection. The globe is divided into 60 north and south
zones, each spanning 6° of longitude. Each zone has its own central meridian.
Zones 1N and 1S start at -180° W. The limits of each zone are 84° N and 80° S,
with the division between north and south zones occurring at the equator. The
polar regions use the Universal Polar Stereographic coordinate system.
2.3.Spatial Data Analysis
de By (2000) defined that spatio-analytic capabilities distinguish GIS from
other data processing systems. These capabilities use the spatial and non-spatial
data in the spatial database to answer questions and solve problems. The principal
objective of spatial data analysis is to transform and combine data from diverse
sources/disciplines into useful information, to improve one’s understanding or to
satisfy the requirements or objectives of decision makers. A GIS application deals
with only some delineated, relevant slice of reality, termed as the universe of
Application models used for planning and site selection are usually
prescriptive. They involve the use of criteria parameters to quantify
environmental, economic and social factors. The model enumerates a number of
conditions to be met. In predictive models, a forecast is made of the likelihood of
future events, which may be pollution, erosion, or even landslides. Such a model
involves the expert use of various spatial data layers, either raster-or vector-based,
and their combination in a methodically sound way to arrive at sensible
predictions (de By, 2000).
2.3.1. Proximity Computation
In proximity computations, geometric distance is used to define the
neighbourhood of one or more target locations. The most common and useful
technique is buffer zone generation. The principle of buffer zone generation is
simple, which one or more target location is selected, and then the area around
them determined, within a certain distance (de By, 2000).
In some case studies, zonated buffers must be determined, for instance in
assessment of traffic noise effects. Most GIS support this type of zonated buffer
computations. In vector-based buffer generation, the buffers themselves become
polygon features, usually in a separate data layer, that can be used in further
spatial analysis. Buffer generation on raster is fairly simple function. The target
location or locations are always represented by a selection of the raster’s cells, and
geometric distance is defined, using cell resolution as the unit. The distance
function applied is the Pythagorean distance between the cell centers.
2.3.2. Network Analysis
A completely different set of analytic functions in GIS consists of
computations on network. A network is a connected set of lines, representing
some geographic phenomenon, typically of the transportation type. The ‘goods’
transported can be almost anything: people, cars and other vehicles along a road
network, commercial goods along a logistic network, phone calls along a
Network analysis can be done using either raster or vector data layers, but
they are more commonly done in the latter, as line features can be associated with
a network naturally, and be given typical transportation characteristics like
capacity and cost per unit. One crucial characteristic of any network is whether
the network lines are considered directed or not. Directed networks associate with
each line a direction of transportation; undirected networks do not. In the latter,
the ‘goods’ can be transported along a line in both directions (Aronoff, 1989).
For many applications of network analysis, a planar network, i.e., one that
is embeddable in a two-dimensional plane, will do the job. Many networks are
naturally planar, like stream/river networks. A large-scale traffic network, on the
other end, is not planar: motorways have multi-level crossings and are deal with
computationally, as they have simpler topological rules. Not all GIS systems
accommodate non-planar networks, or can do so only using trickery (de By,
2000).
Burrough and McDonnel (1998) explain that various classical spatial
analysis functions on networks are supported by GIS software packages. The
most important one is optimal path finding. Optimal path finding techniques are
used when a least-cost path between two nodes in a network must be found. The
two nodes are called origin and destination, respectively. The aim is to find a
sequence of connected lines to traverse from the origin to the destination at the
lowest possible cost.
The cost function can be simple: for instance, it can be defined as the total
length of all lines on the path. The cost function can also be more elaborate and
take into account not only length of the lines, but also their capacity, maximum
transmission (travel) rate and other line characteristics, for instance to obtain a
reasonable approximation of travel time. There can even be cases in which the
nodes visited add to the cost of the path as well. These may be called turning
costs, which are defined in a separate turning cost table for each node, indicating
the cost of turning at the node when entering from one line and continuing on
2.3.3. 3D Data Structures
de By (2000) explain that the data structures used for representing 3D
objects have largely evolved from theoretical work done in the fields of geometry
and solid modeling. Much of this work is in use in computer-aided design and
manufacturing (CAD/CAM) systems, for industrial design purposes.
Not all of these representations have been used for modeling in 3D GIS in
practice, for applications such as mining and site investigation, two different
approaches are followed, namely geometric modeling and volumetric modeling.
These two approaches differ significantly in associated file size, ease of
manipulation and interactive editing and visualization capabilities, as is the case
with vector and raster approaches in 2D GIS. Geometric models result in smaller
file size, and are easier to view and manipulate interactively. Volumetric models
are important for applications interested in variations in internal properties of solid
objects. In addition, it is generally much easier to computationally combine and
intersect objects using volumetric models.
2.3.4. 3D Data Capture
Aronoff (1989) explain that many aspects of 3D data capture are similar to
the approaches used in 2D GIS, with some additional procedures being necessary
to ensure all data are correctly georeferenced. Examples of the procedures used
for 3D data capture, are summarized below:
a. Topographic contours
The (constant) contour elevation is treated as a coordinate value for 3D
georeferencing, as opposed to 2D GIS where it is regarded simply as a
numeric attribute. Such data can be captured using conventional digesting
tablets. The main procedural difference is that each reference point used
for orienting the map on the digitizer has three coordinate values, and each
contour will be assigned a z-value, which indicates its position relative to
the reference plane.
b. Automatic generation of triangulated surfaces
c. Extrusion of 2D polygons
2.4. Analytical Hierarchy Process
Analytical Hierarchy process (AHP) is a quantitative method for ranking
decision alternatives by developing a numerical score to rank each decision
alternative based on how well each alternative meets the decision maker’s criteria
(Russell and Taylor, 2003). AHP can be used to determine the relative weights
among decision elements for GIS-based Suitability and Routing models. In its
many other applications AHP is used to select the best single alternative that best
matches decision criteria (decision-making models).
The process involves 1) identifying the decision elements, 2) recording
relative importance of those elements, 3) construction of an importance table and
4) implementing a simple mathematical solution. The decision elements are
identified by group interaction and discussion. A scale from 1= equally important
through 9= extremely important is used to record the relative level of importance
for the pair wise combinations of the decision elements. Each member of the
group first orders the decision elements to be compared so the statement
“<element A> is preferred over <element B>”is correct, and then records the
appropriate rating value (1 to 9) for the strength of the opinion. The number of
pairwise combinations is calculated by #Pairs= (N * (N – 1) / 2), where N is the
III.
METHODOLOGY
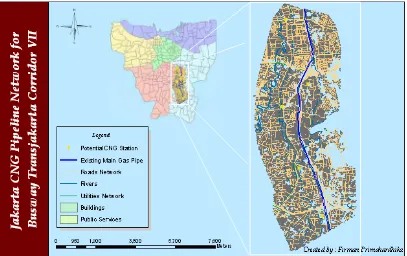
3.1.Time and Location
[image:39.612.123.530.257.513.2]This research was conducted from August to December 2006 covering Transjakarta Busway Corridor VII, connecting Kampung Rambutan and Kampung Melayu bus stations which locate in East Jakarta at approximately 6o17’44.18’’ South and 6o52’18.32’’ East (Google Earth, 2006). Figure 3 shows the study area.
Figure 3. Study Area
3.2.Methods
3.2.1. Need Analysis
Need Analysis was done by interviewing and questioning the stakeholders to acquire all possible variables referring multicriteria and possible alternative routes which are relevant to determining the CNG pipeline network. The method used to choose the stakeholders was purposive sampling by considering that the stakeholders are the experts who understand the problem that is occurred and has ability to perform the policy or give suggestion relevant to decision making.
3.2.2. Defining Goal and Objective
Defining the goal and objective were based on interview with the stakeholders by considering the entire criteria and possible alternatives. In order to reach the goal, there are some sets of objective that also should be considered as stated below:
• What kind of site the pipeline will be installed
• Engineering specification and piping standard that proper to the site
• Where the pipeline should be installed
• All factors that may be considered for the proximity to the source, CNG pipeline, and CNG station (SPBG)
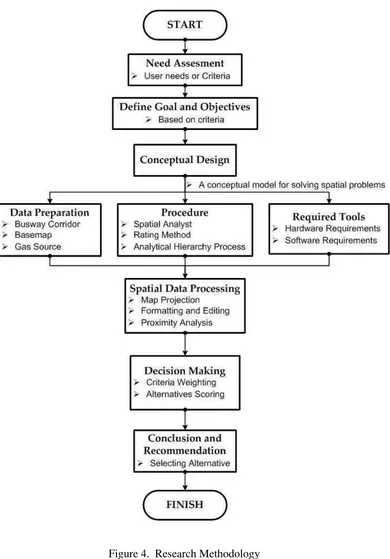
3.2.3. Conceptual Design
Figure 5. Conceptual Model
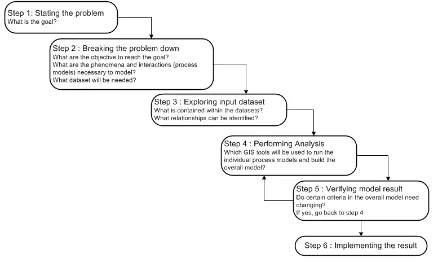
• Stating the Problem
To solve the spatial problem, it needs to be started off by clearly stating the problem to solve and the goal to achieve.
• Breaking Down the Problem
Once the goal is understood, it must break the problem down into a series of objectives, identify the elements and their interactions that are needed to meet the objectives, and create the necessary input datasets to develop the representation models.
• Exploring Input Dataset
It is useful to understand the spatial and attribute relationships of the individual objects in the landscape and the relationships between them. To understand these relationships, it needs to explore the data.
• Performing Analysis
At this stage, it needs to identify the tools used to build the overall model. In ArcGIS Spatial Analysis provides a wide variety of tools to serve this purpose. In CNG pipeline case, it may need to identify the tools necessary to select and weight certain land used types, buffer housing, building, utilities and roads, and weight them appropriately.
• Verifying the Model Result
Check the result from the model in the field. Do certain parameters need to change to give a better result?
• Implementing the Result
Once the spatial problem already solved, verifying that the result from a particular model meets the initial expectations outlined in state the problem, and then implement the result.
3.2.3.1. Data Preparation
Figure 6. Data Preparation
Pipeline data is relatively simple (such as centerlines and value), but the surrounding data that determines its location can be more complex such as proximity analysis criteria. Thereby, the entire data required are as listed below:
1. Jakarta base maps were collected from BIOTROP Training and Information Centre (BTIC) and MIT program that include utilities, public services, roads network, buildings, and houses. Then, it was processed to calculate information that quite difficult or even impossible to collect, such as proximity, and density.
2. Existing gas main pipe that were collected from PT. PGN (Perusahaan Gas Negara) Tbk.
3. Corridor VII of the Transjakarta Busway Route that was collected from BP Transjakarta.
4. While the decision criteria and alternatives were based on expert interpretation and judgment that were acquired from interview.
3.2.3.2. Procedure
a) Spatial Analysis
Spatial Analysis is able to perform cell-based (raster) analysis. Of the two main types of GIS data (raster and vector), the raster data structure provides the most comprehensive modeling environment for spatial analysis.
In general terms, a model is a representation of reality. Due to the inherent complexity of the world and the interactions in it, models are created as a simplified, manageable view of reality. Models help you understand, describe, or predict how things work in the real world. There are two main types of model:
• Representation models
Representation models try to describe the objects in a landscape, for example, buildings, roads, or utilities. The way representation models are created in a geographic information system (GIS) is through a set of data layers. For Spatial Analysis, these data layers will be either raster or feature data. Raster layers are represented by a rectangular mesh or grid, and each location in each layer is represented by a grid cell, which has a value. Cells from various layers stack on top of each other, describing many attributes of each location.
The representation model attempts to capture the spatial relationships within an object (for example, the shape of a building) and between the other objects in the landscape (for example, the distribution of buildings). Along with establishing the spatial relationships, the GIS representation model is also able to model the attributes of the objects (for example, who owns each building). Representation models are sometimes referred to as data models and are considered descriptive models.
• Process models
b) Rating Method
The procedure was assigning arbitrary weight to the most important alternatives. Proportionately smaller weights were then given to alternative lower in the order. The procedure was continued until a score was assigned to the least important alternative. Then the score assigned to the least important attribute was taken as an anchor point for calculating the ratios. Specifically, the value for the least important alternative was divided by the value for each alternative.
c) Analytical Hierarchy Process
Weighting of the criteria was achieved using a portion of the Analytical Hierarchy Process (AHP) as a systematic method for comparing decision criteria with a simple equation “Gas Pipeline Route = f(SPBG, Route)”. The procedure involves mathematically summarizing paired comparisons of the relative importance of the criteria. The result was applied to perform matrix multiplication with alternative scoring to produce decision score.
3.2.3.3. Required Tools Hardware Requirements
• PC Pentium 4 2.8GHz that appropriate for digital image processing and GIS data modeling with 512 Mb of DDR memory NVidia G-Force FX 5200 video graphic adapter.
Software Requirements • ER Mapper 6.4
• ArcGIS 9.1 Full Package Edition
• AutoCAD Map 2000i
• Criterium DecisionPlus 3.0
3.2.4. Spatial Data Processing 3.2.4.1. Map Projection
Map projection is designed for specific purposes. One map projection might be used for large-scale data in a limited area, while another is used for a small-scale map of the world. In this case we use Universal Transverse Mercator (UTM).
3.2.4.2. Formatting and Editing
In this step the projected data was being manipulated in addition to mapmaking and map analysis by creating and editing geographic data as well as tabular data (creating and modifying new features and editing attribute).
3.2.4.3. Euclidean Distance Analysis
The Euclidean distance functions described each cell's relationship to a source or a set of sources. There are three Euclidean functions:
• Euclidean Distance gives the distance from each cell in the raster to the closest source. Example of usage: What is the distance to the SPBG?
• Euclidean Allocation identifies the cells that are to be allocated to a source based on closest proximity. Example of usage: What is the SPBG?
• Euclidean Direction gives the direction from each cell to the closest source. Example of usage: What is the direction to the SPBG?
3.2.4.4. Proximity Analysis
Proximity analysis is almost the same with Euclidean distance by buffering the features for certain purposes.
3.2.5. Decision Making
3.2.5.1. Criteria Weighting
A scale from 1= equally important through 9= extremely important was used to record the relative level of importance for the pairwise combinations of the decision elements. It had confirmed that a scale of nine units was reasonable and reflected the degree which could discriminate the intensity of relationships between elements. Each member of the group first orders the decision elements to be compared so the statement “<element A> is preferred over <element B>”was correct, and then recorded the appropriate rating value (1 to 9) for the strength of the opinion.
Tabel 1. Importance Level
RATING IMPORTANCE LEVEL
1 Equally important
2 Equally to moderately more important 3 Moderately more important 4 Moderately to strongly more important 5 Strongly more important
6 Strongly to very strongly more important 7 Very strongly more important
8 Very strongly to extremely more important 9 Extremely more important
The number of judgments needed for a particular matrix of order n, the number of element being compared, was n(n-1)/2 because it is reciprocal and the diagonal elements are equal to unity. An element of pairwise comparison matrix aij represented a relative importance of element I compared with element j. A
consistent pairwise comparison held the following conditions:
ij ij
a
a = 1
(
aij ≥0;aij ≠∝)
ij ik jk
a a
a = For i, j,k=1,2,...n
i ij
From pairwise comparison matrix, relative priorities of the elements compared are derived in the form of priority vector (W). There are a number of ways to derive the vector of priorities W from the matrixA=
( )
aij . However, emphasis on consistency led to an eigen value formulation below:W W
A× =λmax× where λmaxis the maximum eigen value of matrix. The solution was obtained by raising the matrix to a sufficiently large power, then summing over the rows and normalizing to obtain the priority vectorW =
(
w1,w2,K,wn)
. The process was stopped when the difference between components of the priority vector obtained at kth power and at the (k+1)th power had been less than some predetermined small value.max
λ is always greater than or equal to n for positive, reciprocal matrices,
and is equal to n if and only if A is a consistent matrix. Thus, λmaxprovides useful measure of the degree of inconsistency. Hereby,
(
)
, max i j ij w w a Σ =λ for j=1,2,…,n
Normalizing this measured by the size of the matrix, consistency index (CI) was defined as
(
)
(
1)
max − − = n n CI λ
For each size of matrix n, random matrices were generated and their mean value, called as the random index (RI) was computed. These values were illustrated in table 3.10. Using these values, the consistency ratio (CR) was defined as the ratio of CI to the RI. CR is a measure of how a given matrix compared to a purely random matrix in terms of their CI’s. Therefore:
Table 2. Random Consistency Index
n 1 2 3 4 5 6
RI 0 0 0.58 0.90 1.12 1.24
n 7 8 9 10 11 12
RI 1.32 1.41 1.49 1.51 1.53 1.56
n= size of pairwise comparison matrix
A value of CI and/or CR≤0.1is typically considered acceptable. Larger value required the decision maker to reduce the inconsistency by revising judgments.
When using ArcGIS Spatial Analysis for processing, it will be able to access existing raster datasets and create new ones. It is important to understand how raster data is represented in ArcGIS Spatial Analysis, how the ArcGIS Spatial Analysis functions alter the input data, and how the characteristics of the input data and the settings it apply would affect the output data.
3.2.5.2. Alternative Scoring
This method requires the decision maker to allocate 100 points across the criteria of interest. Specifically, it is based on allocating points ranging from 0 to 100, where 0 indicates that the criteria can be ignored and 100 represents the situation where only one criteria need be considered in a given decision situation.
3.2.6. Selecting Alternative
IV.
RESULTS AND DISCUSSIONS
4.1.Need Analysis
Based on previous study conducted by PT. Perusahaan Gas Negara (PGN) on 2004, there were six users stakeholders (DKI government, BP TransJakarta, gas supplier, pipeline constructor, and compressor provider) who involved in the pipeline project. Furthermore, by conducting a series of interview, discussion, also questioning the stakeholders (PT. Perusahaan Gas Negara, BP TransJakarta, and DKI Government) and some respondents from residence and public services, the criteria of pipeline path determination havedetermination have been identified the
as follows:
1. The length of the pipe
2. Installing the pipe under the shoulder of existing roadways 3. Installing the pipe beside the existing utilities
4. Considering 25 meter site plan proximity to residential (housing and building).
5. Considering 25 meter site plan proximity to public services (hospital, industrial, institutional, commercial, and business).
6. Minimizing area of land ownership status.
7. Minimizing area of disruption that caused by construction
In addition, there were some existing conditions should be taken into consideration such as:
1. Existing gas main pipe 6” under the shoulder of Jagorawi Toll road up to Bypass Jakarta City Toll road.
2. Existing PPD Bus Depot at Cililitan and Kramat Jati that either would be taken over by BP Transjakarta for Busway pool and there would be installed CNG Station called SPBG (Stasiun Pengisian Bahan Bakar Gas).
3. Bus station at Kampung Rambutan, Cililitan, and Kampung Melayu which part of their area would be used by the BP Transjakarta as their becoming Busway Pool and also where the CNG station would be installed.
4.2.Goal and Objective
The output resulted from interview and discussion with the stakeholders defined the goal that was to determine the best route for CNG pipeline network around the area of Transjakarta Busway Corridor VII based on criteria and additional information below:
• The site was urban area with a complex social problem.
• Engineering specification that should be considered were as follows:
o Standard Design : ASME B 31,8
o Line Pipe Standard : API 5 L Grade B SCH 40 STD 6” NPS o Fitting Standard : ANSI B 16,9
o Pipeline Valve Standard : API 6 D o Welding Standard : API 1104 o Pipe Coating : AWWA C.20386
• The pipeline would be installed along the main roads and utilities (phone
line, power line, water line).
• Existing condition such as the position of bus terminal, bus depot, and
4.3.Conceptual Design
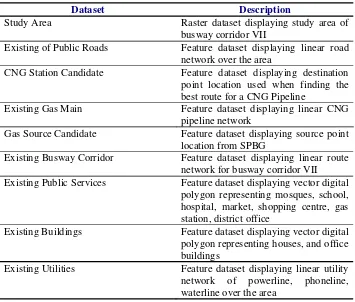
[image:53.612.95.450.174.476.2]The result of conceptual design was a framework to do the analysis based on required data, methodology, and tools. The data required were as follows: Table 3. The Ddataset
Dataset Description
Study Area Raster dataset displaying study area of busway corridor VII
Existing of Public Roads Feature dataset displaying linear road network over the area
CNG Station Candidate Feature dataset displaying destination point location used when finding the best route for a CNG Pipeline
Existing Gas Main Feature dataset displaying linear CNG pipeline network
Gas Source Candidate Feature dataset displaying source point location from SPBG
Existing Busway Corridor Feature dataset displaying linear route network for busway corridor VII Existing Public Services Feature dataset displaying vector digital
polygon representing mosques, school, hospital, market, shopping centre, gas station, district office
Existing Buildings Feature dataset displaying vector digital polygon representing houses, and office buildings
Existing Utilities Feature dataset displaying linear utility network of powerline, phoneline, waterline over the area
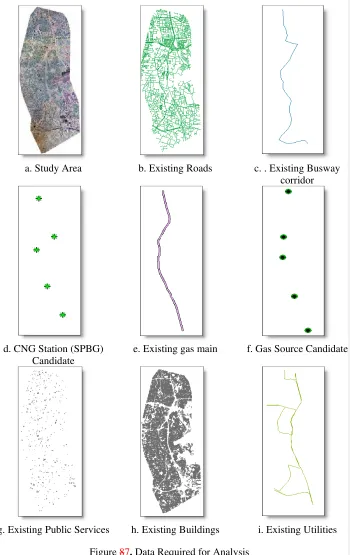
a. Study Area b. Existing Roads c. . Existing Busway corridor
d. CNG Station (SPBG) Candidate
e. Existing gas main f. Gas Source Candidate
[image:54.612.102.452.99.654.2]g. Existing Public Services h. Existing Buildings i. Existing Utilities
Overlaid
Figure 9. Overlay without IKONOS
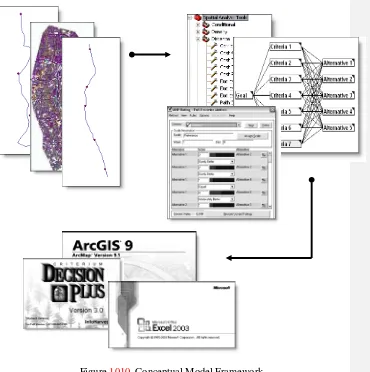
The dataset was processed in spatial analysis to perform proximity analysis. Then, the result was analyzed to certain alternative by scoring criteria for each alternative from interpolated data. The whole process was performed using ArcGIS 9.1 for spatial analysis, Microsoft Excel 2003 for data interpolation, and Criterium Decision Plus 3.0 for full pairwise comparison. Figure 1010 shows conceptual model framework.
[image:58.612.100.470.260.632.2]
4.4.Data Processing
Data processing was the technical detail of conceptual design which consists of map projection, data formatting and editing, proximity analysis, data interpolation, scoring, and Analytical Hierarchy Process through full pairwise comparison.
4.4.1. Map Projection
First of all, the entire data input should be registered into georeference to WGS 1984 UTM Zone 48 south as in Figure 111 below. These geographic data has a scale of 1:5000, due to limited area with detail features.
Figure 1111. Geographic data coordinate system
4.4.2. Proximity Analysis
Figure 122.Pipeline Route Buffer AreaPipeline route buffer area
4.5.Decision Making
In this phase, the possible alternatives were compared and scored based on economic, social, legal aspects, and risk exposure. Economic aspect concerns in three main issues. First is the pipe length where the shortest route will be chosen. The second and last are that it should be in line with the road and utility network to reduce land cost release. In social aspect there are public services that consist of industrial area, hospital, shopping centre, school, university, hotel, tourism, and other building such as houses, offices, institutional, and worship facilities. Establishing pipeline route should avoid high density of the entire social aspect. In legal aspect, we consider the land ownership status such as there are some lands owned by government or other institution within the area of pipeline route which is difficult to release or should spend more cost to release it. And for risk exposure, we consider the areas which are sensitive to construction hazard such as the impact of digging in market area, toll road, etc.
Each criterion were compared to each alternative as described in Figure 13, while Table 4 shows the information of each alternative and Table 5 shows description of criteria.
Figure 133. CNGPipeline Network Criteria
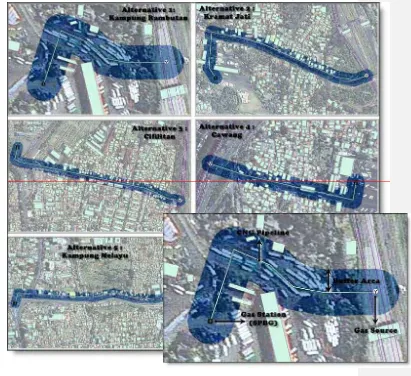
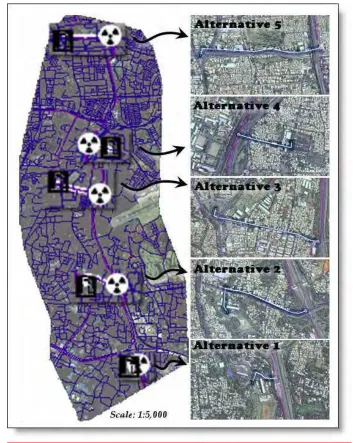
installed there, too. Table 4 shows the alternative of the pipeline routes, while Figure 14 illustrates the possible alternative routes.
Table 4. Alternatives of Pipeline Routes
Alternatives Location Remarks
Alternative 1 Kampung Rambutan Starting from existing main gas to Kampung Rambutan bus terminal
Alternative 2 Kramat Jati Starting from existing main gas to Kramat Jati bus depot
Alternative 3 Cililitan Starting from existing main gas to Cililitan bus terminal
Alternative 4 Cawang Starting from existing main gas to Cawang bus depot
Alternative 5 Kampung Melayu Starting from existing main gas to Kampung Melayu bus terminal
Figure 14. Possible Alternative Routes
Table 5 shows the description of each criterion. These criteria were compiled through some interviews with the stakeholders, in this case are PT. Perusahaan Gas Negara, BP Transjakarta, and DKI Government.
Table 5. Description of Ccriteria
Aspect Criteria Description Remarks
Economic
Criteria 1 Pipe Length Pipe length between source to CNG Station (SPBG)
Criteria 2 The pipe align with the public roadways
Pipeline route should be arranged in line with the roadways network
Criteria 3 The pipe align with the utilities
Pipeline route should be arranged in line with the utilities network
Social
Criteria 4 Public Services Number of public services along the pipeline route Criteria 5 Buildings Number of building along the
pipeline route
Legal Aspect Criteria 6 Area of Land Ownership
Statusd by Government
Area of land owned by
governmentownership within
pipeline route Risk Exposure Criteria 7 Area of Construction
Impact
Area of disruption that caused by construction process
4.5.1. Criteria Weighting
Preference level of each criteria is obtained from questionnaires (Appendix 1) that are collected from stakeholders. The preference of criteria was averaged and consensus from the expert within the scale of nine units as shown in matrix Table 6.
Table 6. Criteria Ppreferences
Criteria 1 Criteria 2 Criteria 3 Criteria 4 Criteria 5 Criteria 6 Criteria 7
Criteria 1 1 1/3 1/2 1/2 1 1/2 1/2
Criteria 2 3 1 2 1 3 1 2
Criteria 3 2 1/2 1 1 2 1 1
Criteria 4 2 1 1 1 2 1 1
Criteria 5 1 1/3 1/2 1/2 1 1/2 1/2
Criteria 6 2 1 1 1 2 1 1
Criteria 7 2 1/2 1 1 2 1 1
Then the weight resulted from the preferences were 0.077 for Criteria 1, 0.224 for Criteria 2, 0.148 for Criteria 3, 0.163 for Criteria 4, 0.077 for Criteria 5, 0.163 for Criteria 6, and 0.148 for Criteria 7 (Appendix 2).
Format t ed: Font: 10 pt Format t ed Table
Format t ed: Font: 10 pt
Format t ed: Font: 10 pt
Format t ed: Font: 10 pt
4.5.2. Alternative Scoring
In this step we use interpolation with minimum and maximum value of each criteria as shown in Table 7:
Table 7. Range of the vValue of cCriteria
Criteria Units Min Value
Max Value
Criteria 1: Length of Pipe meters 100 3000
Criteria 2: Align with the Existing Roads Yes/no 0 1
Criteria 3: Align with the Existing Utilities Yes/no 0 1
Criteria 4: Number of Public Services Unit 0 10
Criteria 5: Number of Buildings Unit 0 50
Criteria 6: Area of Land Owned by GovernmentOwnership Status
m2 0 1209.24
Criteria 7: Area of Construction Impact m2 500 5000
As shown in Table 8, for example the value of Criteria 1 in Alternative 1 is 250. It means the length of the pipe is 250 m in Alternative 1. For Criteria 2, the entire value is 1, meaning that all alternatives align with the roadways. Also for Criteria 3 with an index 0 or 1 show Alternative 1, and Alternative 5 are in 0 indexes that means not align with the utilities. Criteria 4 and Criteria 5 shows
density number of public services and buildings. It is determined from the amount of buildings divided by the buffer area of pipeline routes. And both of Criteria 6 and Criteria 7 show private ownership area and construction area within the pipeline route.
Table8. Value of Eeach cCriteria toward to Each aAlternative
Alternatives Value of Criteria
Cr 1 Cr 2 Cr 3 Cr 4 Cr 5 Cr 6 Cr 7 Alternative 1 250 1 0 0 5 0 1171 Alternative 2 852 1 1 2 34 0 1285 Alternative 3 889 1 1 0 43 0 1978 Alternative 4 545 1 0 0 28 0 1645
Format t ed Table
Format t ed: Font: 10 pt Format t ed: Font: 10 pt Format t ed: Font: 10 pt Format t ed: Font: 10 pt Format t ed: Font: 10 pt Format t ed: Font: 10 pt Format t ed: Font: 10 pt
Alternative 5 978 1 1 2 41 1209.24 4317
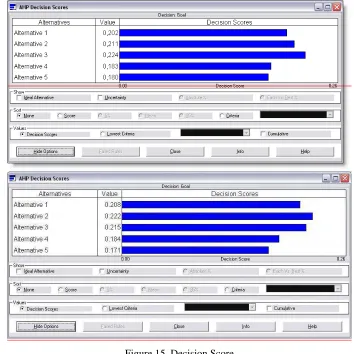
Table 9 shows direct scoring of each criteria to each alternative. The score is produced from liner interpolation by considering the minimum and maximum value to the scale of the score within the range of 0 to 100.
Table 9. Normalized Scoring of Each Criteria to Each AlternativeNormalized scoring of each criteria toward alternatives
Alternatives Score of Criteria
Cr 1 Cr 2 Cr 3 Cr 4 Cr 5 Cr 6 Cr 7 Alternative 1 95 100 0 100 90 100 85 Alternative 2 74 100 100 80 32 100 83 Alternative 3 73 100 100 100 14 100 67 Alternative 4 85 100 0 100 44 100 75 Alternative 5 70 100 100 80 18 60 15
These scores were determined by considering field data collection, and