DEVELOPMENT OF GIS-BASED DECISION
SUPPORT SYSTEM FOR SMALL ISLAND
(A Case Study in Ndana Island, Nusa Tenggara Timur)
ATI RAHADIATI
GRADUATE SCHOOL
DEVELOPMENT OF GIS-BASED DECISION
SUPPORT SYSTEM FOR SMALL ISLAND
(A Case Study in Ndana Island, Nusa Tenggara Timur)
ATI RAHADIATI
A thesis submitted for the degree of Master of Science of
Bogor Agricultural University
MASTER OF SCIENCE IN INFORMATION TECHNOLOGY
FOR NATURAL RESOURCES MANAGEMENT
GRADUATE SCHOOL
BOGOR AGRICULTURAL UNIVERSITY
STATEMENT
I, Ati Rahadiati, here by stated that this thesis entitled:
Development of GIS-based Decision Support System for Small Island
(A Case Study in Ndana Island, Nusa Tenggara Timur)
are results of my own work during the period of February until July 2006 and that it has not been published before. The content of the thesis has been examined by the advising committee and the external examiner.
Bogor, August 2006
ACKNOWLEDGEMENT
Alhamdulillah. Thanks to The Almighty Allah who always give His
endless Grace and Blessing on me. The success of this study would not have been possible without various contribution and support from many individuals that I would like to express my deep gratitude to all of them.
First, I would like to express my thanks and gratitude to BAKOSURTANAL especially for Chief of Center for Marine Resources Survey for gave me the opportunity to join this program and also for facilities and financial support during my study.
Many thanks go to my supervisors Dr. Tania June, M.Sc. and Dr. Dewayany Sutrisno, M.App.Sc. for their valuable suggestions, guidance and word of encouragement and scientific support. Without their contribution and guidance, this thesis would be of less quality.
My sincere thank to external examiner Dr. Gatot H. Pramono for suggestions and comments that improve this thesis. High appreciation goes to the lectures of MIT who taught me with important knowledge. Thanks also to The MIT management and staffs as well as IPB post graduate for supported our administration, technical aspects and the facilities.
I wish also to thanks to my friends and colleagues at Center for Marine Resources Survey for their support, for gave positive ideas and great discussion and supported data needs for this thesis.
Special thanks to all of MIT students especially my class mates, with whom I share laughs and pressures during my study, for our togetherness, helpful, and solidarities.
CURRICULUM VITAE
Ati Rahadiati was born in Bogor, West Java, at July 18, 1969. She received her undergraduate diploma from Bogor Agricultural University in 1993 in the field of Agrometeorology. Since 1995 to present, she works for National Coordinating Agency for Survey and Mapping (BAKOSURTANAL).
ABSTRACT
ATI RAHADIATI (2006). Development of GIS-based Decision Support System for Small Island (A Case study in Ndana Island, Nusa Tenggara Timur). Under the supervision of TANIA JUNE and DEWAYANY SUTRISNO.
Ndana Island in East Nusa Tenggara province is selected as the study area, because the island was classified as small island, located in the Australian border, and need a special management for achieving sustainable natural resources especially at marine area. The development of GIS-based DSS will be has some advantages for Ndana Island such as increasing and protecting the carrying capacity of border territory; using natural resources potencies with sustainable management; increasing income of local people; and developing an isolated island.
The objectives of this research are to identify and analyze potencies of Ndana Island, to develop prototype of GIS-based Decision Support System as a tool for analysis of decision making and to propose potential solutions based on sustainable management of Ndana Island.
There are four main activities to comply this research are data collection and preparation, database design and implementation, data analysis, and graphical user interface. The suitable area for coral reef conservation area in Ndana Island will be analyzed based on ecology, economic and social factors using GIS analysis. Results from this analysis are three zones in conservation area: core zone, buffer zone and use zone which core zone should be a closed area for development, accessible only for research activity. Buffer zone and use zone areas can be analyzed further for diving suitability.
Result of this research is the suitable area for coral reef conservation in Ndana island are S1 (highly suitable) for core zone, S2 (moderately suitable) for buffer zone, S3 (marginally suitable) for use zone and N (not suitable) for non-conservation area. Percentage of S1 is 0.29%, S2 is 3.01%, S3 is 75.58% and N is 21.12%. In buffer and use zone of conservation area, there are 31.33 hectares is moderately suitable (S2) and 146.27 hectares is marginally suitable (S3) for diving suitability.
Based on spatial suitability and economic valuation, scenario IV is the best management to apply in coral reef area of Ndana Island, which has the biggest value of NPV, Rp. 86,767,185,416. In scenario IV there are zonation area for tourism, fisheries and protected area with ecology, economic and social consideration. Hopefully this scenario can increase income of local people with sustainable management of natural resources. With this method can help improve coral reef conservation and management, but the level of detailed analysis required depend on the use of data and the value estimation.
Research Title : Development of GIS-based Decision Support System for Small Island (A Case study in Ndana Island, Nusa Tenggara Timur)
Name : Ati Rahadiati
Student ID : G 051040121
Study Program : Master of Science in Information Technology for Natural Resource Management
Approved by, Advisory Board
Dr. Ir. Tania June, M.Sc. Supervisor
Dr. Ir. Dewayany Sutrisno, MApp.Sc. Co-supervisor
Endorsed by,
Program Coordinator
Dr. Ir. Tania June, M.Sc.
Dean of the Graduate School
Dr. Ir. Khairil A. Notodiputro, M.Sc.
TABLE OF CONTENTS
STATEMENT ... ii
ACKNOWLEDGEMENT ... iii
CURRICULUM VITAE ... iv
ABSTRACT... v
TABLE OF CONTENTS... vii
LIST OF TABLE ... ix
LIST OF FIGURE... x
LIST OF APPENDIX ... xii
I. INTRODUCTION ... 1
1.1. Background ... 1
1.2. Problem Identification... 3
1.3. Location ... 5
1.4. Objectives... 6
1.5. Advantages... 6
II. LITERATURE REVIEW ... 7
2.1. Small Island... 7
2.1.1. Definition and Characteristic ... 7
2.1.2. Potencies of Small Island ... 8
2.1.3. Island Directory... 10
2.2. Tools for Analysis of Small Island... 12
2.2.1. Decision Support System ... 12
2.2.2. Geographic Information System ... 15
2.3. Research Dealing with GIS–based DSS ... 18
2.4. Sustainable Development of Natural Resources ... 20
III. METHODOLOGY... 23
3.1. Method ... 23
3.1.2. Need Assessment ... 25
3.1.3. Database ... 26
3.1.4. Data Analysis ... 27
3.1.5. Graphical User interface ... 35
3.2. Data Source ... 35
3.3. Tools Used ... 36
IV. DATABASE DESIGN AND CONSTRUCTION ... 37
4.1. Data Preparation... 37
4.2. Database Building ... 39
4.2.1. Conceptual Design ... 39
4.2.2. Logical Design ... 41
4.2.3. Physical Design... 42
V. RESULTS AND DISCUSSION ... 43
5.1. Data Analysis ... 43
5.1.1. Spatial Analysis... 43
5.1.2. Economic Analysis ... 50
5.1.3. Development Alternatives... 52
5.2. Graphical User Interface (GUI) ... 63
VI. CONCLUSION AND RECOMMENDATION... 68
6.1. Conclusion ... 68
6.2. Recommendation ... 69
REFERENCES... 70
LIST OF TABLE
No. Caption Page Table 1. Computerized support for decision making (adapted from Turban,
1995) ... 17
Table 2. Question from need assessment ... 26
Table 3. Criteria for coral reef conservation area ... 29
Table 4. Criteria for diving activity... 30
Table 5. Criteria for seaweed cultivation ... 30
Table 6. Economic value of alternatives in coral reef area ... 34
Table 7. List of software ... 36
Table 8. Classification and standardization data for non spatial data ... 38
Table 9. Classification and standardization data for spatial data ... 38
Table 10. Master data list ... 40
Table 11. Area and percentage of coral reef conservation... 44
Table 12. Area of diving and seaweed cultivation suitability... 46
Table 13. Number of boat in Rote Barat Daya District ... 51
Table 14. Economic valuation of coral reef ecosystem in Ndana Island ... 52
Table 15. Revenue and cost components ... 56
DEVELOPMENT OF GIS-BASED DECISION
SUPPORT SYSTEM FOR SMALL ISLAND
(A Case Study in Ndana Island, Nusa Tenggara Timur)
ATI RAHADIATI
GRADUATE SCHOOL
DEVELOPMENT OF GIS-BASED DECISION
SUPPORT SYSTEM FOR SMALL ISLAND
(A Case Study in Ndana Island, Nusa Tenggara Timur)
ATI RAHADIATI
A thesis submitted for the degree of Master of Science of
Bogor Agricultural University
MASTER OF SCIENCE IN INFORMATION TECHNOLOGY
FOR NATURAL RESOURCES MANAGEMENT
GRADUATE SCHOOL
BOGOR AGRICULTURAL UNIVERSITY
STATEMENT
I, Ati Rahadiati, here by stated that this thesis entitled:
Development of GIS-based Decision Support System for Small Island
(A Case Study in Ndana Island, Nusa Tenggara Timur)
are results of my own work during the period of February until July 2006 and that it has not been published before. The content of the thesis has been examined by the advising committee and the external examiner.
Bogor, August 2006
ACKNOWLEDGEMENT
Alhamdulillah. Thanks to The Almighty Allah who always give His
endless Grace and Blessing on me. The success of this study would not have been possible without various contribution and support from many individuals that I would like to express my deep gratitude to all of them.
First, I would like to express my thanks and gratitude to BAKOSURTANAL especially for Chief of Center for Marine Resources Survey for gave me the opportunity to join this program and also for facilities and financial support during my study.
Many thanks go to my supervisors Dr. Tania June, M.Sc. and Dr. Dewayany Sutrisno, M.App.Sc. for their valuable suggestions, guidance and word of encouragement and scientific support. Without their contribution and guidance, this thesis would be of less quality.
My sincere thank to external examiner Dr. Gatot H. Pramono for suggestions and comments that improve this thesis. High appreciation goes to the lectures of MIT who taught me with important knowledge. Thanks also to The MIT management and staffs as well as IPB post graduate for supported our administration, technical aspects and the facilities.
I wish also to thanks to my friends and colleagues at Center for Marine Resources Survey for their support, for gave positive ideas and great discussion and supported data needs for this thesis.
Special thanks to all of MIT students especially my class mates, with whom I share laughs and pressures during my study, for our togetherness, helpful, and solidarities.
CURRICULUM VITAE
Ati Rahadiati was born in Bogor, West Java, at July 18, 1969. She received her undergraduate diploma from Bogor Agricultural University in 1993 in the field of Agrometeorology. Since 1995 to present, she works for National Coordinating Agency for Survey and Mapping (BAKOSURTANAL).
ABSTRACT
ATI RAHADIATI (2006). Development of GIS-based Decision Support System for Small Island (A Case study in Ndana Island, Nusa Tenggara Timur). Under the supervision of TANIA JUNE and DEWAYANY SUTRISNO.
Ndana Island in East Nusa Tenggara province is selected as the study area, because the island was classified as small island, located in the Australian border, and need a special management for achieving sustainable natural resources especially at marine area. The development of GIS-based DSS will be has some advantages for Ndana Island such as increasing and protecting the carrying capacity of border territory; using natural resources potencies with sustainable management; increasing income of local people; and developing an isolated island.
The objectives of this research are to identify and analyze potencies of Ndana Island, to develop prototype of GIS-based Decision Support System as a tool for analysis of decision making and to propose potential solutions based on sustainable management of Ndana Island.
There are four main activities to comply this research are data collection and preparation, database design and implementation, data analysis, and graphical user interface. The suitable area for coral reef conservation area in Ndana Island will be analyzed based on ecology, economic and social factors using GIS analysis. Results from this analysis are three zones in conservation area: core zone, buffer zone and use zone which core zone should be a closed area for development, accessible only for research activity. Buffer zone and use zone areas can be analyzed further for diving suitability.
Result of this research is the suitable area for coral reef conservation in Ndana island are S1 (highly suitable) for core zone, S2 (moderately suitable) for buffer zone, S3 (marginally suitable) for use zone and N (not suitable) for non-conservation area. Percentage of S1 is 0.29%, S2 is 3.01%, S3 is 75.58% and N is 21.12%. In buffer and use zone of conservation area, there are 31.33 hectares is moderately suitable (S2) and 146.27 hectares is marginally suitable (S3) for diving suitability.
Based on spatial suitability and economic valuation, scenario IV is the best management to apply in coral reef area of Ndana Island, which has the biggest value of NPV, Rp. 86,767,185,416. In scenario IV there are zonation area for tourism, fisheries and protected area with ecology, economic and social consideration. Hopefully this scenario can increase income of local people with sustainable management of natural resources. With this method can help improve coral reef conservation and management, but the level of detailed analysis required depend on the use of data and the value estimation.
Research Title : Development of GIS-based Decision Support System for Small Island (A Case study in Ndana Island, Nusa Tenggara Timur)
Name : Ati Rahadiati
Student ID : G 051040121
Study Program : Master of Science in Information Technology for Natural Resource Management
Approved by, Advisory Board
Dr. Ir. Tania June, M.Sc. Supervisor
Dr. Ir. Dewayany Sutrisno, MApp.Sc. Co-supervisor
Endorsed by,
Program Coordinator
Dr. Ir. Tania June, M.Sc.
Dean of the Graduate School
Dr. Ir. Khairil A. Notodiputro, M.Sc.
TABLE OF CONTENTS
STATEMENT ... ii
ACKNOWLEDGEMENT ... iii
CURRICULUM VITAE ... iv
ABSTRACT... v
TABLE OF CONTENTS... vii
LIST OF TABLE ... ix
LIST OF FIGURE... x
LIST OF APPENDIX ... xii
I. INTRODUCTION ... 1
1.1. Background ... 1
1.2. Problem Identification... 3
1.3. Location ... 5
1.4. Objectives... 6
1.5. Advantages... 6
II. LITERATURE REVIEW ... 7
2.1. Small Island... 7
2.1.1. Definition and Characteristic ... 7
2.1.2. Potencies of Small Island ... 8
2.1.3. Island Directory... 10
2.2. Tools for Analysis of Small Island... 12
2.2.1. Decision Support System ... 12
2.2.2. Geographic Information System ... 15
2.3. Research Dealing with GIS–based DSS ... 18
2.4. Sustainable Development of Natural Resources ... 20
III. METHODOLOGY... 23
3.1. Method ... 23
3.1.2. Need Assessment ... 25
3.1.3. Database ... 26
3.1.4. Data Analysis ... 27
3.1.5. Graphical User interface ... 35
3.2. Data Source ... 35
3.3. Tools Used ... 36
IV. DATABASE DESIGN AND CONSTRUCTION ... 37
4.1. Data Preparation... 37
4.2. Database Building ... 39
4.2.1. Conceptual Design ... 39
4.2.2. Logical Design ... 41
4.2.3. Physical Design... 42
V. RESULTS AND DISCUSSION ... 43
5.1. Data Analysis ... 43
5.1.1. Spatial Analysis... 43
5.1.2. Economic Analysis ... 50
5.1.3. Development Alternatives... 52
5.2. Graphical User Interface (GUI) ... 63
VI. CONCLUSION AND RECOMMENDATION... 68
6.1. Conclusion ... 68
6.2. Recommendation ... 69
REFERENCES... 70
LIST OF TABLE
No. Caption Page Table 1. Computerized support for decision making (adapted from Turban,
1995) ... 17
Table 2. Question from need assessment ... 26
Table 3. Criteria for coral reef conservation area ... 29
Table 4. Criteria for diving activity... 30
Table 5. Criteria for seaweed cultivation ... 30
Table 6. Economic value of alternatives in coral reef area ... 34
Table 7. List of software ... 36
Table 8. Classification and standardization data for non spatial data ... 38
Table 9. Classification and standardization data for spatial data ... 38
Table 10. Master data list ... 40
Table 11. Area and percentage of coral reef conservation... 44
Table 12. Area of diving and seaweed cultivation suitability... 46
Table 13. Number of boat in Rote Barat Daya District ... 51
Table 14. Economic valuation of coral reef ecosystem in Ndana Island ... 52
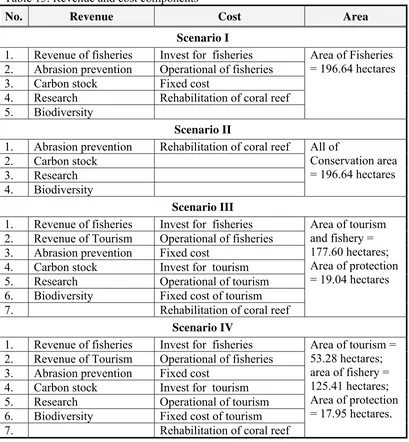
Table 15. Revenue and cost components ... 56
LIST OF FIGURE
No. Caption Page
Figure 1. General scheme for management of Ndana Island ... 4
Figure 2. Location index and Quickbird image of Ndana Island (Acquisition February 26, 2005) ... 5
Figure 3. Conceptual model of DSS (Turban, 1995) ... 13
Figure 4. General research scheme ... 23
Figure 5. Framework of research ... 24
Figure 6. Hybrid system design ... 27
Figure 7. Flowchart of decision support process ... 28
Figure 8. Context diagram ... 39
Figure 9. Entity Relationship Diagram ... 41
Figure 10. Sample of table design using Microsoft Access ... 42
Figure 11. Relationship of non-spatial data in Microsoft Access ... 42
Figure 12. Map of suitable area for coral reef conservation ... 47
Figure 13. Map of suitable area for diving... 48
Figure 14. Map of suitable area for seaweed cultivation ... 49
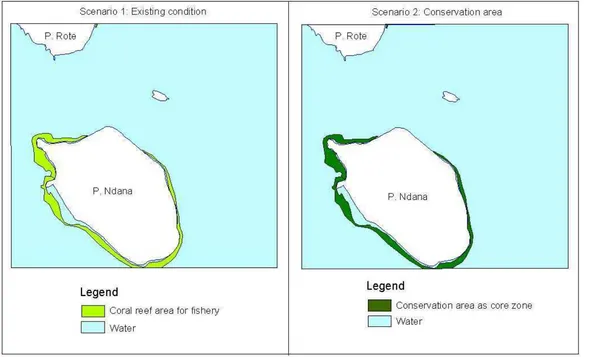
Figure 15. Spatial scenario 1 and 2 ... 54
Figure 16. Spatial scenario 3 and 4 ... 55
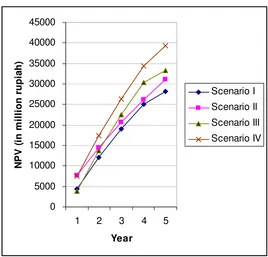
Figure 17. NPV of four scenarios ... 57
Figure 18. NPV of four scenarios at the 1st of five years... 59
Figure 19. Map of Scenario I ... 61
Figure 20. Map of Scenario II ... 62
Figure 21. Map of Scenario III... 62
Figure 22. Map of Scenario IV ... 63
Figure 23. Flowchart of application system... 64
Figure 24. Main form of GUI... 64
Figure 25. Display the tabular data ... 65
LIST OF APPENDIX
No. Title of Appendix Page
I.
INTRODUCTION
1.1. Background
Indonesia is the world’s largest archipelago state consists of 17,508 islands and 81,000 km coastline. More than 10,000 islands are classified as small islands characterized by many resources. Small islands have limited terrestrial natural resources, but rich in marine resources (Dahuri, 1998). These make small islands have lots of potencies to develop such as for fisheries and tourism.
Characteristics of islands have long been noted for their unique fauna and flora, but particularly vulnerable to the disturbance and destruction by human activities. The islands also face some problems to be well managed, such as adaptations to the societies, difficulties in economic development, and the challenge of achieving sustainable development within limited resources. Besides that, the increasing rate of global change makes the islands represent some of the most fragile and vulnerable resources on the planet (UNEP, 2004). Indeed, the sea and land adjacent to it are recognized by the government as critical to the present and future well being of the country’s expanding population, and must therefore be protected and developed in an environmentally sustainable and sustainable manner.
Dealing with the change in the national policies, management of small islands now becomes a national agenda. The island’s development policy has also been changed to the more sustainable management planning.
in border area was not a complete study for island development, only identification of the island characteristics (Suryansyah, 2005). Main aims of bordered small islands development are to make self-development and to strengthen position of small islands as territory guard.
Due to the complexity of small island management in border area, decision making for small islands management may well benefit from the development of a flexible computer system capable of running several analyses at one time. This system is termed Decision Support Systems (DSS). A comprehensive decision support will require the effective integration with Geographic Information System (GIS). GIS-based DSS provided effective decision support that can handle spatial and spatial databases. This allows for the spatial database organization, non-spatial datasets organization (attributes), analysis and transformation for obtaining the required information, obtaining information in specific format (map or report) and organization of a user-friendly query system.
1.2. Problem Identification
Main issues for development of small islands in border area are:
1. Most of the small islands are undeveloped; limited in infrastructure, non-educated local people, and poor economic;
2. There are some infiltration in economic, social and culture from neighbour country;
3. Poor attention may change in national sovereignty for the island in border area (case: Sipadan and Ligitan Island)
Therefore, the small islands located in the border area need to be managed properly by both the local and central government. Indeed the local people and non-government organization (NGO) can joint in monitoring and evaluating of the policy.
Ndana Island in Nusa Tenggara Timur Province is selected as the study area, because:
a. The island was classified as small island; b. Located in the Australian border;
c. The island has many flora and fauna, such as many kinds of coral reef, fish, and sea grass.
d. The island has been develop as the conservation area for game hunting park (Taman Burubased on Ministry of Forestry No. 83/Kpts-II/1993); e. Need a special management for achieving sustainable natural resources.
Due the complexities of the use as can be seen in Figure 1.
will be has some advantages for Ndana Island such as increase and protect the carrying capacity of border territory; to use natural resources potencies with sustainable management; to increase income of local people; and to develop an isolated island.
Ndana Island
Ministry of Forestry No. 83/Kpts-II/1993)
Government Regulation No. 38/2002
- Coordinate of boundary points
Potencies of Ndana Island
Ecology Social Economic Politics
Management of Ndana Island
Sustainable development for Ndana Island
Tools: GIS-based DSS
Zonation at marine area Regional planning
of Ndana Island Land area Marine area
Conservation area as Hunting Park
Government Regulation No. 78/2005 -Management of small islands in boundary area
1.3. Location
The location of Ndana (Dana) Island, Nusa Tenggara Timur as the study area can be seen in Figure 2. Ndana Island bounded by Rote Island in the north, Hindia Ocean in the south, Sabu Sea in the west and Timor Sea in the east. Area covers 1,562 hectares.
1.4. Objectives
The objectives of this research are:
1. To identify and analyze potencies of Ndana Island
2. To develop prototype of GIS-based Decision Support System as a tool for analysis of decision making
3. To propose potential solutions based on sustainable management of Ndana Island
1.5. Advantages
The advantages of this research are:
1. Data and information of Ndana Island can be structured and accessible. 2. GIS-based decision support system may help decision maker in
managing a small island in a sustainable manner.
II.
LITERATURE REVIEW
2.1. Small Island
2.1.1. Definition and Characteristic
Definition of an island is a naturally area of land, surrounded by water which is above water at high tide. Small island is island that has small size, ecologically separated from main island and has fixed border. Small islands are unique and intensively individual and often requiring special management skills.
According to Ministry of Marine and Fisheries Affair (Doc. No. 41/2000), definition and characteristic of a small island are:
a. Island that has area equal or less than 10,000 km2 and total citizen less than or equal 200,000 people.
b. Ecologically separated from mainland and has a clear physical border. c. Has specific flora and fauna
d. Little catchments area where almost all of water’s surface and sediment directly go to the sea.
e. Local community has specific social, culture and economic value and activities.
Because small island development options are limited, there are special challenges to planning for and implementing sustainable development. Information on the geographic, environmental, cultural and socio-economic characteristics of islands should be compiled and assessed to assist in the planning process. Existing island databases should be expanded and geographic information systems developed and adapted to suit the special characteristics of islands (UNEP, 2004).
Several characteristics of small islands that can be obstacles to develop small islands are (Dahuri, 1998):
a. Size of area is small and isolate from other island, expensive in infrastructures and seldom in educated human resources.
b. Difficult to reach an optimal economic in part of production, transportation and administration.
c. Sometimes specific local culture in conflict with the development activity of small islands
Government Regulation No. 78/2005 is a new order for management of 92 bordered small islands in Indonesia and Ndana Island is one of them. It is written in the regulation that bordered small island is island with area equal or less than 2,000 km2 which has boundary point of Indonesia territory based on National and International Laws. The aims of bordered small island management are as national security, to use natural resources with sustainable development and to increase income of local people.
2.1.2. Potencies of Small Island
formation, estuary, lagoon and delta. Besides that there are manmade ecosystem, such as tourism area, marine culture and settlement (Dahuri et al., 2001).
The main potencies of ecosystem of small islands in tropical area are (UNEP, 1998):
a. Coral reefs. Coral reefs are a very productive type of ecosystem with many kinds of plants and animals crowded together and usually occur in shallow tropical waters. Many different kinds of fishing and food collecting are possible in reef areas, producing very high catches. Coral reef ecosystems also provide opportunities for recreation and tourism, scientific research, education, and shoreline protection.
b. Fisheries. Fish and other animals from the sea provide an important
source of protein for people living on islands. Fishing activity in the shallow coastal waters around the islands is an important occupation today as it has been for hundreds of years. Fish are a renewable resource because they can continue to be used over and over again if they are taken care of. If too many fish are caught at once, it is call over fishing, and it may not be possible for the few that are left to replace all those that were taken. Today it is happening in many places especially in the tropical islands. Fishery activity must be managed in accordance with certain ecological principles to avoid over fishing and other damage to fish resources.
c. Lagoon. Lagoons are common in the coastal environments of many
cut off or protected so that there are special environmental conditions inside them.
d. Tourism. Tourism in the small islands context involves people who
come from other region or countries for the pleasure of visiting the island environment. Tourism can be an important source of income for islands with few other possible sources of revenue because tourists may spend money on travel, hotels, food, entertainment and recreation. The most important tourism resources are the natural beauty of the island, their recreation possibilities, and the cultural interest of the people. The basic problem with tourism development is that tourism facilities and the tourists themselves have impacts on the environment. And the tourism development should be managed with ecological principal as ecotourism activity. The problem can be particularly serious on tropical small islands where the environment is fragile and easily degraded, and even moderate tourism development may have a proportionately large impact.
2.1.3. Island Directory
According to Island Directory from United Nations Environment Programme (UNEP, 2004) there are several kinds of information that should be collected for each island when available, as described below:
a. The present name in English, the official name if in another language, and significant former names if widely used in the literature;
b. Basic descriptive information on each island, such as its geographic co-ordinates, area etc.;
d. Climate data;
e. The major natural and human catastrophic threats which could endanger an already vulnerable population or feature, such as volcanic eruptions, earthquakes, tsunamis, and other effects;
f. Demographic data;
g. Indicators of human impact;
h. The major ecosystem types or biomes around the island; i. Features of special interest for conservation
j. The size and diversity of the flora and fauna; k. The numbers of endemic;
l. The scientific and common names of endemic species and other species of special conservation interest;
m. Information on introduced biota;
n. The names and area of terrestrial and marine protected areas; o. References;
2.2. Tools for Analysis of Small Island
2.2.1. Decision Support System
Turban (1995) stated that decision support system is an interactive, flexible and adaptable computer based information system, especially developed for supporting the solutions of a non-structured management problem for improved decision making.
A Decision Support System allows decision-makers to combine personal judgment with computer output, in a user-machine interface, to produce meaningful information for support in a decision-making process. Such systems are capable of assisting in solution of all problems (structured, semi-structured and unstructured) using all information available on request. They use quantitative models and database elements for problem solving and an integral part of the decision-maker’s approach to problem identification and solution (Simonovic, 1998).
According to Sol in Terfai and Schrimpf (2004), decision support is the development of approaches for applying information systems technology to increase the effectiveness of decision makers in situations where the computer can support and enhance human judgment in the performance of tasks that have elements, which cannot be specified in advance.
than on supporting the modeling process, but the main goal of a DSS should be to provide decision makers with tools for interactively exploring, designing and analyzing decision situations. Users should be able to perform the following functions: they can analyze decision situations according to their personal styles and knowledge; they can build and compare various quantitative models; they can adapt these models to changing conditions; and they can evaluate different aspects of their activities using a variety of different means (Terfai and Schrimpf, 2004).
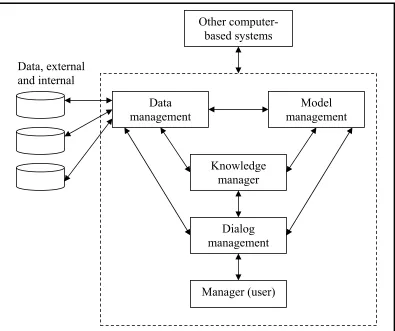
Other computer-based systems
Data management
Model management
Knowledge manager
Dialog management
Manager (user) Data, external
[image:36.595.115.510.275.606.2]and internal
Figure 3. Conceptual model of DSS (Turban, 1995) DSS is composed of the following subsystem (Turban, 1995):
b. Model management. A software package that includes financial, statistical, management science or other quantitative models that provide the system’s analytical capabilities and an appropriate software management
c. Communication (dialog system). It provides the user interface.
d. Knowledge management. This optional subsystem can support any of the other subsystem or act as an independent component.
Within the framework of management information systems (Mittra in
Simonovic, 1998) the DSS has four primary characteristics:
• It helps decision-makers at the upper levels;
• It is flexible and responds quickly to questions;
• It provides “what if” scenarios; and
• It considers the specific requirements of the decision-makers.
2.2.2. Geographic Information System
A Geographic Information System (GIS) is a specific information system applied to geographic data and mainly referred to as a system of hardware, software and procedures designed to support the capture, management, manipulation, analysis, modeling and display of spatially-referenced data for solving complex planning and management problems (Burrough, 1986).
Since GIS has been introduced in 1960 and due to the user demand for mapped data focused attention on data availability, accuracy, and standards, as well as data structure issues, GIS has served an important role as an integrating technology. The capability in providing data spatial and non-spatial that are cannot be fulfilled by another application, considering GIS, as an application for a user needs. The ultimate need, GIS has been linked to models, decision support systems and expert systems in order to make these tools applicable in spatially explicit planning and decision-making.
There are three important stages of working with geographic data (de By, 2000):
1. Data entry. The early stage in which data about the study phenomenon is collected and prepared to be entered into the system.
2. Data analysis. The middle stage in which collected data is carefully reviewed, and for instance, attempts are made to discover patterns.
3. Data presentation. The final stage in which the results of earlier analysis are presented in an appropriate way.
Data GIS demonstrated the advantage of organizing, managing, and distributing geographic information culled from various databases while maintaining data integrity and focusing on project direction.
In the framework of decision making perception, GIS evolves around its decision support capabilities including query functions, statistical analysis capabilities, spreadsheet analysis, graphics and mapping function for evaluating decision options and assessing the optimal and most suitable alternative (United Nations, 1996).
despite the proliferation of GIS software systems and the surge of public interest in the application of the system to resolve the real world problems, the technology has commonly seen as complex, inaccessible, and alienating to the decision makers (Sharifi, 2002).
Table 1. Computerized support for decision making (adapted from Turban, 1995)
Phase Description Traditional Tools Spatial tools
Early compute, "crunch numbers", summarize, organize early computer programs, management science models computerized cartography Intermediate
find, organize and display decision relevant information database management systems, MIS workstation GIS Current perform decision relevant computations on decision relevant information; organize and display the results. Query based and user friendly approach. "What if" analysis
financial models, spreadsheets, trend exploration, operations research models, decision support systems. spatial decision support systems
ability to zoom and to display or highlight different features. GIS provides database support that is designed to allow for the effective storage of spatial data. Furthermore GIS software provides a link between the interface and database to allow the user to easily query spatial data.
2.3. Research Dealing with GIS–based DSS
There are several studies using GIS-based DSS for natural resources management but not specific in small island case. O’Donnell et al. (2003) reported on use GIS tools for decision support in coastal habitat which this project was designed to house and manage a broad ranging spatial database and as a development tool in the production of a GIS based sensitivity analysis model. They used ArcInfo and Microsoft Visual Basic for this application.
In the other location Terfai and Schrimpf (2004) used GIS and remote sensing data for development of decision support system for coastal management in Morocco. They used three kinds of software that are Omnimage as graphical software, IDRISI for raster geographic analysis system and GRASS as raster or vector geographic system. They suggest that DSS for environmental management is a useful method and could be used at regional or national level. According to Agrawal et al (2003) the GIS based DSS provides an advanced modeling and analysis system for environmental parameters which they studied about GIS as modeling and decision support tool for air quality management.
From several case studies, Hall (1996) stated there are five kinds of problem for development of GIS based DSS, i.e.:
- Education and training. The current practice of decision making in developing countries has not advanced much in comparison to the tools available to help and may not yet be aware of the benefits of technology. Little effort has been spent on transforming data into information for making decisions. Training programs are needed for five major groups of users - policy makers, decision makers, programmers, technicians, and educators.
- Leadership and organization. The function of the leadership is to set clear goals and objectives, to win acceptance among information system users for such goals and objectives, and to provide commitment to achieve project goals and tasks. Another critical function of leadership is coordination of different departments sharing the information system. - Software development. Most of the programs and manuals are written in
English, but most of the users, have limited understanding of English. User-friendly application programs which hide the technology form the users, with instructions or pull-down menu written in local languages need to be developed in order to enable local planners and decision-makers to use decision support systems.
- Maintenance. The development of DSS should be considered as a continuous process.
generating alternate management scenarios for land and water management (Dutta, 2000).
Other study of spatial DSS reported by Ostendorf and Carrick (2004) about South Australia’s Prawn Fisheries. This report described the process of spatial decision-making and the utility of spatial information techniques using historic spatial data in conjunction with near real-time survey data and statistical risk assessment. The system is implemented linking an Oracle database to ArcGIS, Genstat and Splus and mobile phone technologies.
2.4. Sustainable Development of Natural Resources
The concept of sustainability was first launched in the World Conservation Strategy at 1980. It took quite a long time before the concept became more widely known, a process stimulated by the report 'Our Common Future' of the World Commission on Environment and Development (WCED, 1987 in Rothmans et al., 1994). In general, sustainable development is to meets the needs of the present without compromising the ability of future generations to meet their own needs or in other word, sustainable development is a process of change in which the exploitation of resources, the direction of investments, the orientation of technology development and institutional change are made consistent with future as well as present need (Cicin-Sain and Knecht, 1998).
a holistic view of developments in different societal domains (social, ecological and economic) and at different levels: macro, meso, micro (Rotmans et al., 2001
in LOICZ, 2004). Sustainable development and management of global and regional resources is not an ecological problem, nor an economic one, nor a social one. It is a combination of all three.
There are three conditions to achieve sustainable development in ecological aspect, i.e.: spatial harmonization, assimilation capacity and sustainable use (Dahuri et al., 2001). Spatial harmonization means in developing area should be not all for use zone but there are also locations for preservation and conservation zone.
One of the most important challenges facing society today is maintaining the natural values and resource potential that provide continuity of benefits for society from the goods and services of the small island areas. Therefore, sustainable natural resource use needs information on actual and predicted options and their ecological and monetary evaluation. Development involves making decisions, making choices amongst alternative possible development paths, selecting one line of action which returns benefit to the developing country. It is important that these decisions are made well, using the best information, methods and tools available. For sustainable development it need to make decisions that do not have long term negative effects, and assess the long term effects and impacts as well as the short term benefits.
Cicin-Sain and Knecht (1998) concluded that sustainable development involves three major emphases:
- Environmentally appropriate development – development that is environmental sensitive and makes appropriate use of natural resources, development that protects essential ecological processes, life support system and biological diversity;
III.
METHODOLOGY
This study was conducted from February to July 2006 at Research Lab. Master of Science in Information Technology for Natural Resources Management – Bogor Agricultural University.
3.1. Method
GIS-based Decision Support System was developed to solve the Ndana Island – the small island in border area problems. When the system approach is applied to solve the problem in the framework of information system, it is called information system development. Using the system approach to develop information system solutions involve a multi step process called the information system development cycle, also known as the System Development Life Cycle (SDLC). The steps of SDLC are: (1) investigation, (2) analysis, (3) design, (4) implementation and (5) maintenance (O’Brien, 1999).
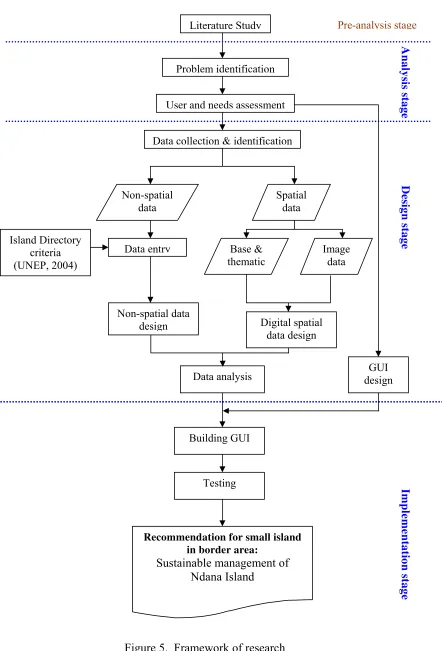
This research was based on the SDLC steps: analysis, design and implementation (Figure 4). Figure 5 show all research activities, which is set of three main steps starting with problem identification and ending on going use of the system.
Analysis - Problem identification - User identification - Need assessment
Design - Database design - User interface design - Data analysis
Implementation - Building GUI (Coding) - Testing
Literature Study
Problem identification
User and needs assessment
Data collection & identification
Non-spatial data
design Digital spatial
data design Island Directory
criteria (UNEP, 2004)
Data entry Base &
thematic Non-spatial data Image data Spatial data GUI design Data analysis Building GUI Testing
Recommendation for small island in border area:
[image:47.595.107.549.93.744.2]Sustainable management of Ndana Island A na lys is s ta g e D es ign sta g e Imple menta tio n s ta g e Pre-analysis stage
3.1.1. User Identification
User identification analysis is needed for defining the specific target and appropriate information. This should be done for designing the system. The considered users of the GIS-based DSS for small islands in border area can be classified into two categories, i.e.:
1) Government (Local/Central) as a decision maker, ex: Governor, DPRD,
DPR etc.
2) Researchers or Non Government Sectors. They will take benefit from the system by increasing their knowledge of small islands in the border area.
3.1.2. Need Assessment
In the beginning of the analysis and general design phase, intending to elicit an understanding of the scope of a study, a needs assessment was performed to understand the project process, to know what they want to accomplish with the automation, and to involve them at an early stage of the implementation. The information needed for the study have been elaborated by two approaches:
¾ Definition of the information for major issues, i.e., environmentally sustainable small islands management, problems identifications, and the development of small islands utilization;
¾ Definition of the types of information important to the expected beneficiaries. The completion of this needed information was checked by relating of the data sets.
Table 2. Question from need assessment
User as decision maker Researcher
What are the natural resources potencies of that island?
What are the physical characteristic of that island?
What is the best management for that island?
What are the demographic and socioeconomic characteristic of the local people?
How much the cost and benefit to develop that island?
How about the data of that island? It’s complete or not? Can we display, share or access those data? Can we make an analysis with those data? From literature review, it was found that Ndana Island needs a system to be implemented to enhance the information of this small island in the border area. To achieve the goals GIS-based Decision Support System will be developed and used.
3.1.3. Database
There are three main activities of the database system design where conceptual design is the first step (Rao, 1993), with the following activities:
a. Conceptual data modeling: identify data content, describe data, define
features and entities, list attributes and characteristics of each entity.
b. Logical design of the information system: converting the conceptual
design to the logical design of the GIS database, include logical process modeling and logical data modeling.
c. Physical design of the information system: design of the application
Database development is focused on two categories, spatial and non-spatial data that refers to the database design and developed by using hybrid system approach (Figure 6). A hybrid architecture manages geospatial data independently and in different software module from the non-spatial data (Worboys and Duckham, 2004). Spatial and non-spatial data in the designed small island database has to be linked up for better analysis and visualization of desired output. The link is provided by interface with connectivity function to other related database. Non-spatial database will be designed in MS Access and link up with the spatial data through ActiveX Data Object (ADO). ADO is familiar to database programmers using Microsoft Visual Basic.
GIS-based DSS for Small Island
Visual Basic
Map Object Microsoft Access
Spatial data Non-spatial data
Figure 6. Hybrid system design
3.1.4. Data Analysis
3.1.4.1.Spatial Analysis
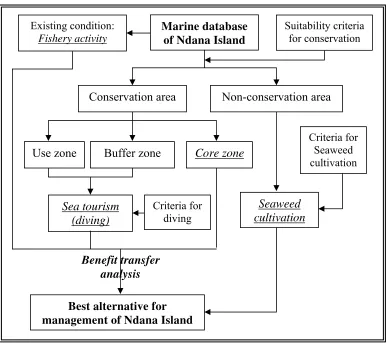
(Figure 7). Bengen (2001) in Angkotasan (2003) stated conservation area can be divided to three zones:
a. Core zone. This area has high value of conservation. It should be a closed area for development and accessible only for research activity.
b. Buffer zone is transition area but still need a strict control. Function of buffer zone is to protect core zone from disturbance of external factor. Several activities can permit, i.e.: research, traditional fisheries and limited of tourism activity.
c. Use zone. This area still has value of conservation but can be used by people such as for fisheries, tourism and limited marine cultivation activities.
Marine database of Ndana Island
Conservation area
Suitability criteria for conservation
Sea tourism (diving)
Seaweed cultivation
Best alternative for management of Ndana Island
Core zone
Buffer zone Use zone
Criteria for diving
Non-conservation area
Criteria for Seaweed cultivation
Benefit transfer analysis Existing condition:
Fishery activity
Based on the above explanation buffer and use zones can be analyzed further for marine activities suitability. This study will be focused on marine suitability analysis especially for sea tourism (diving).
Non-conservation area can be analysis for site selection of seaweed cultivation. Diving and seaweed cultivation suitability analysis used the physical factor. Criteria’s for coral reef conservation area, diving and seaweed cultivation can be seen in Table 3, 4 and 5. These criteria were based on literature and the availability of data. Scoring and weighting system was applied for assessing the suitability aspects. Decision of weighting value based on the importance of factor for a suitability analysis (Haris, 2003). The suitable area was determined based on the total of all scores. There are four classes in every criteria, i.e.: S1 = highly suitable, S2 = moderately suitable, S3 = marginally suitable and N = not suitable. Table 3. Criteria for coral reef conservation area
Category and scoring No Variable Unit Weig
hting S1 Score S2 Score S3 Score N Score
Ecology aspect 1. Coral reef
% 5 Live coral, >75% 4 Live coral, 25-75% 3 Live coral, <25% 2 Died coral, sand 1 2. Distance from beach
M 3 < 100 4 100-150 3
150-200 2 >200 1
3. Slope % 3 0-15 4 15-25 3 25-40 2 >40 1
4. Salinity
ppt 3 30-32 4 32-34 3 28-30 2 <28 >34 1 5. Sea Surface
Temperature
0 C 3 29-31 4 31-33 3 27-29 2 <27
>33 1 Economy aspect
6. Number of economy activities (fisheries, marine culture)
2 Non 4 1 3 2 2 > 3 1
Social aspect 7. Distance from
settlement Km 2 > 4 4 3 - 4 3 2 - 3 2 < 2 1 8. Number of tourism
area 2 Non 4 1 3 2 2 >3 1
9. Number of special
species 2 > 3 4 2 3 1 2 Non 1
The suitability classes were calculated based on the total maximal scores minus total of minimum scores divided by four classes. The ranges of suitable value for coral reef conservation area are:
S1 (highly suitable) : 81.25 – 100
S2 (moderately suitable) : 62.50 – 81.25 S3 (marginally suitable) : 43.75 – 62.50
N ( not suitable) : 25 – 43.75
Table 4. Criteria for diving activity
Category and scoring No Variable Unit Weig
hting S1 Score S2 Score S3 Score N Score
1. Water clarity M 10 >15-20 10 10-15 8 5-10 6 < 5 4 2. Percentage of life
coral
% 8 >75 9 >50-75 7 25-50 5 < 25 3 3. Variation of coral 8 >27 9 > 18-27 7 9-18 5 < 9 3 4. Variation of fish 8 > 70 9 > 50-70 7 > 20-50 5 ≤20 3 5. Current velocity M/se
c
6 0-0.1 8 0.11-0.4 6 0.41-0.5
4 > 0.5 2 6. Depth M 4 >10-20 7 >5-10 5 2-5 3 < 2 1 Source: BAKOSURTANAL (1996) and Yudasmara (2004)
Range of suitable index:
S1 (highly suitable) : 326 – 392
S2 (moderately suitable) : 260 – 326 S3 (marginally suitable) : 194 – 260
N ( not suitable) : 128 – 194
Table 5. Criteria for seaweed cultivation
Category and scoring No Variable Unit Weighting
S1 Score S2 Score S3 Score N Score
1. Salinity ppt 4 32 - 34 4 30 - 32 3 28-30 2 <28 & > 34 1 2. SST 0 C 4 26 - 29 4 29-30 3 30-31 2 < 26 & >
31 1 3. Current
velocity
Cm/s
ec 4 20-30 4 30-40 3 - 2
<20 & > 40 1 4. Substrate on bottom sea 3
Sand, coral, and seagrass 4 Sand, coral and seagrass
3 Coral sand 2 Coral sand 1
5. pH 3 7.5 - < 8 4 7-7.5 &
8-8.5 3 - 2
Range of suitable index:
S1 (highly suitable) : 68.25 – 84
S2 (moderately suitable) : 52.50 – 68.25
S3 (marginally suitable) : 36.75 – 52.50
N ( not suitable) : 21 – 36.75
3.1.4.2. Economic Valuation
Economic valuation is conducted to choose the best alternative for coral reef management of Ndana Island after site selection using GIS. The ultimate aim of applying valuation technique to the ecosystem is to highlight the ways in which economic issues can be addressed, economic tools used and management strengthens.
Spurgeon (2003) said that Total Economic Valuation (TEV) is a useful framework to help understand the full range of economic welfare benefits of coral reefs, which it measure the value of ecosystem services to people by estimating the amount people are willing to pay to preserve or enhance the services. TEV is based on the theory that environmental assets give rise to a range of economic values that include direct use values, indirect use values and non-use values. As based on World Bank definitions (Munasinghe, 1993 in Spurgeon, 2003):
TEV = DUV + IUV +OV + EV + BV
Direct use value is determined by the contribution an environmental asset makes to current production or consumption. Such values may comprise net economic returns (i.e. market revenues less “opportunity costs”, the cost of inputs in their next best alternative use) and “consumer surplus” (i.e. the amount of satisfaction gained over and above the amount paid for). E.g. fuel wood or recreation and tourism.
Indirect use valueincludes the benefits derived from functional services that the environment provides to support current production and consumption (e.g. coral reefs providing biological support to near-shore fisheries and a coast protection function to shoreline assets).
Option value is the premium that consumers are willing to pay for an unutilized asset, simply to avoid the risk of not having it available in the future (e.g. marine resources may be underutilized today but may have a high future value in terms of scientific, educational, commercial and other economic uses).
Non-use (passive) value: Existence value arises from the satisfaction of merely knowing that the asset exists; although the value has no intention of using it (e.g. People donate money to save endangered species even though they may only see it in books or on television). Part of the motive can be for future generations, in which case that element of value is known as “bequest value”. These values capture some of the social value afforded by corals.
that the value of a natural resource or impact calculated in one location can be used to estimate the value of a similar resource or impact elsewhere. Considerable care is needed in its application, for example to adjust the values appropriately, because most “site” and “impact” specific details are likely to vary considerably. Unfortunately, at present few thorough valuation studies exist for coral reefs that can be effectively transferred (Spurgeon, 2003).
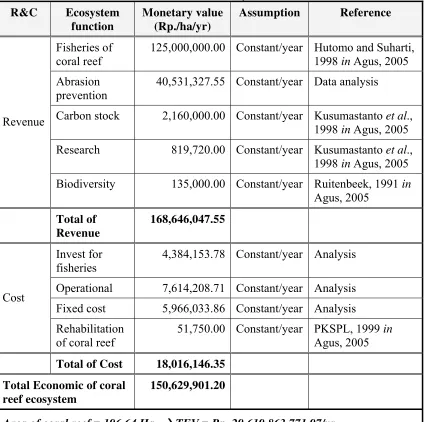
This study estimated economic valuation of coral reef area based on research of Husni (2001) in Lombok Timur and Agus (2005) in Lombok Barat. Husni (2001) calculated value of Total Economic Valuation of coral reef area for fishery and tourism activities while Agus (2005) only estimated value of fishery activity in coral reef area. Characteristics of the area study can be seen in (Appendix 1).
Indicators that used to evaluate decision rule of economic aspect are NPV (Net Present Value), and BCR (Benefit Cost Ratio). NPV is the present value of all benefits, discounted at appropriate discount rate minus the present value of all costs discounted at the same rate. BCR is the ratio between discounted total benefits and cost.
n
NPV = ∑ (Bt – Ct ) / (1 + i)t t=1
n n
BCR = [∑ (Bt/(1 + i)t ] / [ ∑ (Ct/(1 + i)t ] t=1 t=1
where: NPV = Net present value
BCR = Benefit cost ratio
Bt = Benefits
t = Year
i = discount rate
In most cases the NPV and BCR will give the same results and will produce the same alternatives ranking. But in general, where the government is using some sort of target (minimum or cut off) rate of return on capital, maximizing NPV should be the criterion with the BCR as a supplementary check (Anonim, 2000). The alternative can be develop if NPV > 0 or BCR > 1 and the best choice is maximize of NPV.
3.1.4.3.Development Alternatives
Four alternatives was made for sustainable management of Ndana Island, using economic valuation especially NPV. This because NPV is a tool that can be used to determine if an alternative is viable or not and make comparison between alternatives and rank alternatives. Ranking alternatives or choosing between mutually exclusive alternatives which all have a positive NPV, should be made on the basis of the highest NPV.
Table 6. Economic value of alternatives in coral reef area
Scenario Alternatives Economic value
I Existing condition (There is fishery activity)
NPV1
II All for conservation area, not for other activities
NPV2
III Based on suitability analysis for conservation and diving
NPV3
IV Core zone + diving + fishery (zonation based on literature and own judgment)
3.1.5. Graphical User interface
GIS-based DSS Application Development - preparing applications identified in the Needs Assessment, which require additional programming using the macro language or other supporting programming languages. Several models have been introduced for system development. In this research used prototyping model.
Prototyping is the rapid development and testing of working model or prototypes of new application in an interactive, iterative process that can be used by both systems analyst and end user. Prototyping makes the development process faster and easier for system analyst, especially for project where end user requirements are hard to define (O’Brien, 1999).
Graphical user interface is an application that can be used by users and it has specific functions. The system development can be integrated and operated in a personal computer. The interface has been developed using Microsoft Visual Basic and supported by database reference (ADO) and several ActiveX components, i.e. ESRI MapObject.
3.2. Data Source
Mainly the spatial data used for this research acquired from Center for Marine Natural Resources Survey, BAKOSURTANAL. There are two kinds of data, i.e:
a. Non-spatial data (based on criteria of Island Directory (UNEP, 2004): - Demographic (population, density, number of fisherman etc.) derived
- Geography, geology and ecology data (latitude, longitude, ecosystem etc.) derived from report of survey by BAKOSURTANAL and LPPM - IPB (Anonim, 2005).
b. Spatial data:
- Vector: administration boundary, coastline, bathymetry, land use, geology, landform, slope, SST, salinity, current velocity, water clarity, depth and pH.
- Raster: image of Ndana island (Quickbird satellite image, acquisition February 26, 2005).
3.3. Tools Used
The hardware used for this study is one unit of personal computer with Pentium III processor, 256 MB RAM and 40 GB hardisk. Several software employed to accomplish this research are shown in Table 7.
Table 7. List of software
Software Type Function
ArcView Ver. 3.x GIS application Spatial data analysis MapObject Ver. 2.1 Active X Developing user interface Visual Basic Ver. 6.0 Programming software Developing user interface
and database programming Microsoft Access Database application Developing attribute data Microsoft Excel Spreadsheet application Non spatial data entry and
IV.
DATABASE DESIGN AND CONSTRUCTION
4.1. Data Preparation
The data that used for the study were collected from several sources such as BAPPEDA, BAKOSURTANAL, BPS, and DISHIDROS. Prior to the analysis, these should be prepared for this system development, including data identification and classification, standardization, and conversion.
Data identification defines the data on spatial and non spatial types. Identified spatial data can be classified into feature (coverage or theme), scale (large, medium or small) and geometric type (point, line or polygon). Non spatial data can be classified into feature (topic or theme) and scale (province, regency, district or island).
Data standardization of spatial data refers to Map Accuracy for Spatial Planning Act No. 10, 2000 (Peraturan Pemerintah Nomor 10 tahun 2000 tentang
Tingkat Ketelitian Peta untuk Penataan Ruang Wilayah) and Technical
Specification for Database Development of Coastal and Marine Natural Resources
(Spesifikasi Teknis Penyusunan Basisdata Sumberdaya Alam Pesisir and Laut).
For example: administrative boundary used A code and settlement used S code. List of classification and standardization data can be shown in Table 8 and 9.
Last activity in data preparation is data conversion which data should be conversion to the same coordinate (UTM) and clip in the same area. All spatial data were prepared in ArcView shape formats and maps of spatial data can be seen in Appendix 2 and 3.
Daya, and Rote Barat Laut district while Ndana Island is located in Rote Barat Daya District. There are seven spatial data in marine area of Ndana Island that are salinity, sea surface temperature (SST), coral reef, depth of water, water clarity, current and pH (Appendix 3). Vegetation covers are palm and coconut in the central of island and grass field around the beach (see Landuse map in Appendix 3). White sand beach and some steep beach can be found with the island (see
Quickbird image in Figure 2).
Table 8. Classification and standardization data for non spatial data
No. Theme Scale Name
1. Administrative code and name Regency Kab_indo
2. Geography data Island Tb_geogpul
3. Geology data Island Tb_geolpul
4. Ecology data Island Tb_ekolpul
5. Demographic District Tb_demopul
6. Indicator Island Tb_indikator
7. Graphic data Island Tb_grafis
Table 9. Classification and standardization data for spatial data
No. Theme Geometric type Scale Name
1. Administrative boundary Polygon 25.000 A00NDANA
2. Settlement Polygon 25.000 S00NDANA
3. Coast line Line 25.000 L00NDANA
4. Land use Polygon 25.000 QA0NDANA
5. Landform Polygon 250.000 FA0NDANA
6. Geology Polygon 250.000 GA0NDANA
7. Slope Polygon 25.000 RC0NDANA
8. SST Polygon 25.000 OB0NDANA
9. Coral Polygon 25.000 OC0NDANA
10. Depth Polygon 25.000 OE0NDANA
11. Salinity Polygon 25.000 OH0NDANA
12. Current Polygon 250.000 OI0NDANA
13. Water clarity Polygon 25.000 OJ0NDANA
4.2. Database Building
4.2.1. Conceptual Design
The conceptual design of database is the result of the first understanding of the application and illustrates the application at its simplest. To answer the question those arise during the need assessment, conceptual design will defines the objective of the database and the data need which required in the system. Context Diagram
The context diagram is the highest level and represents the overall system, means context diagram shows all the external entities that interact with the system through data or information flow over the system. The Context Diagram for this study shows three main entities and what they currently share in the way of information; administrator, data source and user (Figure 8).
Figure ext aster Data
Maste ovided ion that listed in the
Table 10. Th vided in type abular data. The
spatial data a again i ypes n and line. 8. Cont diagram
M List
Table 10. Master data list
Data Type Entity Feature type Attribute
A00NDANA Polygon id_kab, nm_kab, Kecamatan, Area, Perimeter
L00NDANA Line id_shoreln, keterangan S00NDANA Polygon id_settle, keterangan QA0NDANA Polygon id_lu, klas_lu RC0NDANA Polygon id_slope, klas_slope FA0NDANA Polygon id_lf, klas_lf OH0NDANA Polygon id_sali, klas_sali OB0NDANA Polygon id_SST, klas_SST OI0NDANA Polygon id_current, klas_cv OE0NDANA Polygon id_depth, klas_depth
OJ0NDANA Polygon id_wcl, klas_wcl
OK0NDANA Polygon id_ph, klas_ph
GA0NDANA Polygon id_geol, geologi, formasi Spatial
OC0NDANA Polygon id_coral, klas_coral
Kab_indo Table KodeBPS, Id_prop, NM_prop, id_kab, NM_kab
Tb_pulau Table id_pul, id_kab, nm_pul, nm_lain, gugusan, laut, desa, kecamatan, luas
Tb_geogpul Table
d, id_pul, lat, long, luas, altitude, reef, lagoon, shoreln, scale, coastal, low_lan nearsl, jarak, depth
Tb_geolpul Table u, iklim,
ncam, ik_protek, change, ps_bdaya, ps_kritis, ps_reef, ps_mrove, ek_darat, ek_laut, ks_spes
id_pul, jenis, geologi, hujan, suh sd_air, ancaman, ik_a
ekosis, ps_hutan, ps_
Tb_ekolpul Table id_pul, sup_ksv, kws_ldg, jml_ldg, ldg_drt, ldg_laut, rel_data, referen, da_nil Tb_demopul Table id_pul, inhabit, human, popup, tahun,
densitas, grade, mjr_act, mnr_act, hm_imp, urb_pop, hab_type, port, airport, pop_agr, eco_prs, pop_tamb, pop_fish Tb_indikator Table id_pul, kls_TH, kd_np, kls_er, kls_sr,
kls_ep, kls_pa_kls_da, nilai_sk kls_ie_drt, kls_ie_laut, kls_inv, kls_ur,
2 Tabular
Entity Relationship Diagram
On Conceptual design, the master data list table would be follow by the design of Entity Relationship Diagram (ERD) of the database. ERD model contains components of entity set including their relationship set with their attributes that represent all facts from part of the real world. This diagram also describes cardinality, the number of possible relationship of each entity. There are three type of cardinality, namely one to one (1:1), one to many (1:M) and many to many (M:N). Figure 9 show ERD of this system.
Figure 9. Entity Relationship Diagram
4.2.2. Logical Design
describe the logic of the database which is the process of construction a model of information based on specific data model but independent of a particular DBMS and other physical consideration. Logical design table can be seen in Appendix 4.
4.2.3. Physical Design
Physical model is database software specific, meaning that the objects efined during physical model can vary depending on the relational database oftware being used. In this study, Microsoft Access software is used for the lational database. During physical design, object such as tables and columns are
created bas al design.
[image:65.595.208.457.496.730.2]onstraints are also defined including primary keys and foreign keys. Figure 10 sample of table design in Microsoft Access.
Figure 10. Sample of table design using Microsoft Access
Figure 11. Relationship of non-spatial data in Microsoft Access d
s re
ed on entities and attributes that were defined in logic C