A TRANSFORMATION METHOD FOR TEXTURE
FEATURE DESCRIPTION UNDER DIFFERENT IMAGINE CONDITIONS
Z. Guan, J. Yu, T. Feng , A. Li
Research Center of RS & Spatial Infor. Technology /Department of Surveying and Geo-informatics, College of Civil
Engineering, Tongji University
(zequnguan, 2011_jieyu,fengtiantian)@tongji.edu.cn
[email protected]
Commission VII, Working Group VII/6
KEY WORDS: Transformation method, Texture feature, Gabor wavelet, Gaussian mixture models
ABSTRACT:
For high spatial resolution Remote Sensing images, it is very important to investigate the transformational methods between background and target characteristics. Only in this way rich details in images under different imaging conditions can be well extracted. Amongst the characteristics of imagery targets, texture is a visual feature that reflects the homogeneity of images and the inner attributes of different objects. What’s more, it includes important information which describes the structural arrangement of objects and the connection with the surrounding environment. This paper regards texture as the major feature and investigates the transformational methods of texture feature description under different imaging conditions.
This paper mainly consists of three parts:(1) Construct a wavelet filter based on Gabor wavelet, which describes texture features obtained under different imaging conditions;(2) Process and analyze the different object’s texture features jointly by the relationship which is built by the wavelet description;(3) Build the transformation between the wavelet descriptions of the different object’s texture features based on the characteristics of the band and direction.
1. INTRODUCTION
As a natural attribute of subjects, texture is a visual feature that reflects the homogeneity of images. People have researched image texture for more than 50 years and formed many methods of texture features description under different imaging conditions. There are several approaches to multispectral texture description, both supervised and unsupervised. Haralick (1973) presented a new method called gray level co-occurrence matrix(GLCM) which is now widely used. He applied GLCM to Landsat-1 multispectral image of the California coastal area to solve the land use problem. Weszk et al. (1976)researched texture for terrain analysis by using first-order statistics of gray level differences and second-order gray level statistics. Lopez-Espinoza et al. (2008) presented a method for image classification which was taken by SPOT-5 and TM, based on tree-structured Markov random field (TS-MRF) and a texture energy function (TEF). Chellappa et al. (1985) applied Gaussian Markov random field (GMRF) models to image classification. Pentland (1984) put forward that fractals can be used in the area of texture features description. Shu (1998) described the SPOT image of Wuhan based on the method of fractal assessment in image texture analysis. Chitre and Dhawan (1999)used multi band wavelet for natural texture classification. People began to research SAR image texture after the first radar satellite running in earth orbit launched successfully by America. Soh and Tsatsoulis (1999)used GLCM to analyze sea ice texture with 100-m ERS-1 synthetic aperture radar (SAR) imagery. Duskunovic et al. (2000) detected urban areas with the Markov Random Field (MRF) texture classification in SAR imagery. Hu et al. (2001) extracted texture information from Radarsat imagery of Xuzhou with Daubechies3 orthogonal wavelet successfully. Ni et al. (2004) used orthogonal wavelet and second generation wavelet for SAR image classification and compared the results from different methods with each
other. Ivanov and Paschenko (2006) studied SAR image segmentation based on fractal dimension field. People also have researched infrared imagery texture description recently. Song, Wan and Chen (2006)applied GLCM to TM6 infrared imagery for image enhancement by computing six textural features. Lin et al. (2009) established the detection probability model based on texture feature of thermal infrared image with Gabor wavelet. All of the above methods of texture features description under different imaging conditions can be divided into five categories according to the principle proposed (Tuceryan, Jain, 1993). They are statistical methods, geometrical methods, structural methods, model based methods and signal processing methods. Both GLCM and Gabor wavelet are the most popular methods among all of them. And this paper will research the investigating transformational methods of texture features description under different imaging conditions based on Gabor wavelet.
The wavelet theory has been utilized in image texture analysis since it was introduced into the area of image process (Mallat, 1989). And among all branches developed from wavelet, Gabor wavelet has been proved to be the optical filter of both spatial domain and frequency domain under 2D uncertainty. Dunn, Higgins and Wakeley (1994) devised a more rigorous method for designing 2D Gabor filters and utilized it to segment images. Wu et al. (2001) designed a optimal Gabor filter for Bi-textured image segmentation with the Fourier power spectrum density. Chen and Wang (2007) integrated Gabor wavelet and independent component analysis (ICP) for image classification. Clausi and Jernigan (2000)used Gabor filters to classify a SAR aerial image and obtain textures from the Brodatz album based on human visual system (HVS). Arivazhagan et al. (2006) proposed a method of image classification using Gabor filter based on rotation invariant features. Also Gabor wavelet has been utilized in other areas. Lin et al. (2007) evaluated the result of camouflage with Gabor wavelet. Song, Liu and Xie
(2010) presented a method of medical image texture features classification by using Gabor wavelet model. This paper will utilize Gabor filters to extract texture features of multispectral and SAR images.
As few people are working on researching the transformational methods of texture features description under different imaging conditions so far, few papers can be found in this area. And this will be the main research content of our paper.
2. TEXTURE DISCRIPTION BASED ON GABOR WAVELET
Research has demonstrated that Gabor filter is the optical one when describes texture both in spatial domain and frequency domain. Its orientation, bandwidth and center frequency can be changed according to different requirements. People design optical Gabor filters for texture features description based on the theory that texture belongs to the narrowband signal and different textures always have different center frequency and bandwidth when it transforms to the frequency domain from space. Each filter will show one kind whose orientation and frequency is same as the filter’s only. People will get a set of image texture descriptions after using Gabor filters for image filtering.
Actually, the Gabor wavelet can be considered as a special wavelet transform. An image’s 2-d wavelet transform is
∫∫
The Eq.(2) shows that a 2-d Gabor function is Gaussian modulated sinusoid. The parameters of a Gabor function are the modulation frequency W , the orientation θ and the Gaussian function’s scale
x
σ
andσ
y (Li, Meng, 2008).In frequency domain, Gabor wavelet can be obtained by moving Gaussian function along
μ
-axis. The corresponding representation in frequency domain is(
)
axis in frequency domain. They can be calculated as:x
A set of self-similar filters can be generated from the dilation and rotation of the mother wavelet. And the rotated equation is
)
k = the total number of orientations
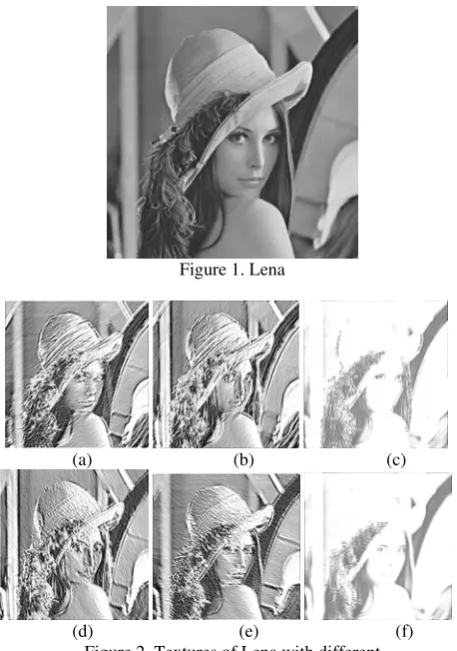
A set of Gabor filters are convolved with the image shown in figure.1, and the outputs for six orientations are shown in figure.2.
Figure 1. Lena
(a) (b) (c)
(d) (e) (f) Figure 2. Textures of Lena with different orientations(a to f stand the texture images of
6
In this implementation, the outputs demonstrate that the Gabor wavelet can generate texture in different directions according to people’s different needs for researches.
3. TEXTURE TRANSFORM BASED ON GAUSSIAN MIXTURE MODELS(GMM)
3.1 GMM Theory
Recently, GMM, which has been widely used in speech recognition, is applied in many domains of image processing. Permuter et al. (2006)proposed a method combining multi-scale wavelet with GMM to segment color textures.
In the possibility theory, a large number of independent random variables which obey the same distribution will obey the single Gaussian distribution on the whole according to the central limit theorem. Consequently, single Gaussian is a widespread and effective probability model in one-dimensional space. In fact, any probability density function can be represented by a linear combination of multiple single Gaussian models usually called GMM.
In the description of texture features, GMM is used to represent the possibility distribution of feature vector under different imaging conditions. The probability density of an image with N pixels is
X = the value of image gray under one imaging
condition , i=1,2,…,N m= the number of single Gaussian
ω
j= texture in j class) (
ω
jP = prior probability that is the weight of texture in j class and meets Eq.(7)
A GMM can be modeled when get the parameters of mean
μ
j
3.2 Parameter Solution in GMM
EM Expectation Maximization algorithm is a widely used maximum likelihood algorithm to solve the parameters in GMM. When solving parameters using EM, the following two steps of E and M should be done. First, calculate the expectation of likelihood function that is E step. Second, M step is for calculating the value of parameters.
(1) Initialize Gaussian parameters
μ
j
P
. The posterior probability that the probability of texture feature vectori
X
in class j can be represented in Eq.(9) according to Bayesian theory∑
∑
Combined with Eq.(6), Eq.(9) also can be represented as the following
(2) Update Gaussian parameters
μ
j restraining itself. Then get optimum evaluations of Gaussian parameters
μ
3.3 Transformation Function
Virtually, the transformation of texture features description under different imaging conditions can be implemented as a process of establishing texture mapping. Each class of texture features can be represented by a single Gaussian, so that the transformation function F can be established based on GMM by training texture feature vector
X
i under one condition andY
i under another. F is piecewise linear and given in Eq.(14)[
]
least square method. It needs to meet Eq.(15)∑
Kain et al. (1998) made some improvements by putting
i
optimal transformation function is
∑
∑
∑
= the mean vector of the source texture and destination texture in class j
∑
xxj
= the covariance of source texture in class j
∑
xy j= the cross covariance of the source texture and destination texture in class j.
The model parameters of
i
The method proposed by Kain can make the GMM more reasonable but will increase the amount of calculation.
After transforming, we use Eq.(19) to evaluate the accuracy
Y
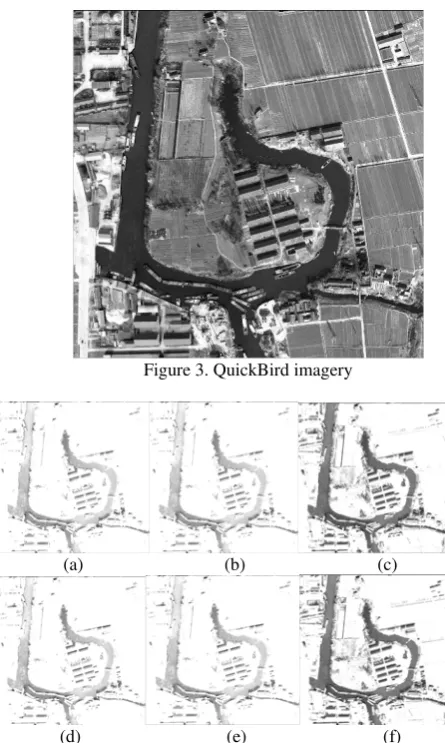
4. EXPERIMENTAL RESULTS AND CONCLUSIONS This paper uses QuickBird imagery and SAR imagery in the same area with spatial resolution of 1m. figure4 and figure6 show the Gabor filtered outputs of QuickBird and SAR imagery.
Figure 3. QuickBird imagery
(a) (b) (c)
(d) (e) (f) Figure 4. Textures of QuickBird imagery with different orientations(a to f stand the texture images of
6
Figure 5. SAR imagery
(a) (b) (c)
(d) (e) (f) Figure 6. Textures of SAR imagery with different orientations(a to f stand the texture images of
6 π
θ= to θ=π with every
6 π )
This paper will establish the transformation of horizontal texture
θ
=
π
since the two types of images have more explicit horizontal and vertical texture.Since the amount of calculation of the algorithm proposed by Kain is very great, this paper will take the following two steps to reduce the amount of calculation. On the one hand, it will use a local horizontal texture (θ=π) of figure4 and figure6 with 50
×
50 instead of the whole texture image. On the other hand, it will use the K-means algorithm before establishing the texture mapping.The registered local texture of QuickBird imagery and SAR imagery used in this experiment are shown in figure7 and figure8
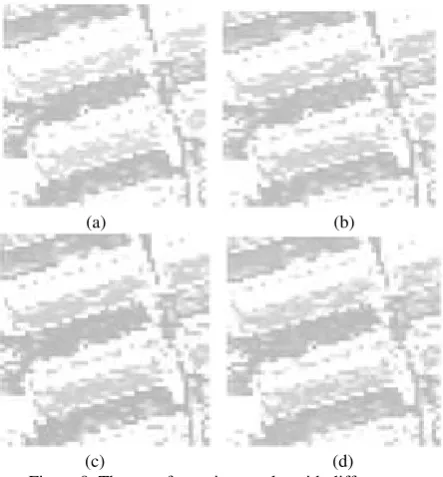
Figure 7. QuickBird imagery Figure 8. SAR imagery figure9 shows the outputs of transformation with different m which is the number of single Gaussians in one GMM.
Spatially, the output of transformation has a high similarity and expression with the SAR imagery in figure8, such as the building at the top of left corner both in figure7 and figure8. Its shape and scale have transformed to be more similar to the SAR imagery. Consequently, it demonstrates that the GMM can play a good performance in the transformational of texture features description under different imaging conditions.
(a) (b)
(c) (d) Figure 9. The transformation results with different m (a, result with m=4; b, result with m=8; c, result with m=16; d,result with m=64)
Table1 shows the results of the average of transformation error precision with different m in the experiment according to Eq.(19). And it demonstrated that the transformation error precision will reduce by the number of single Gaussian increasing.
m=4 m=8 m=16 m=64
Average error precision
0.2602 0.2533 0.2493 0.2482
Table 1. Average error precision
Figure10 shows the comparison of QuickBird imagery, SAR imagery and the transformed result with m=64. The x-axis is the point number from 1 to 50 and y-axis is the value of each pixel. There are three types of lines in Figure10. The solid line with point represents the value of SAR imagery texture. The solid line with star stands the value of transformed texture and dotted line stands the value of Quickbird imagery texture.
Figure 10. The comparison of results
5. SUMMARY
In this paper, texture features description of multispectral imagery and SAR imagery are conducted with Gabor wavelet. Then we established the texture mapping between two registered images based on GMM and solved the parameters with EM algorithm. It can be seen from the results that the output of transformation has a high similarity and expression with the SAR imagery texture. What’s more, the bigger the number of single Gaussians in one GMM is, the lower transformed error precision will be. But in fact, the amount of calculation will increase greatly since the number of single Gaussians in one GMM increasing. Hence, the value of m should be selected carefully in the experiment.
Finally, the approach proposed in this paper of texture features transformed under different imaging conditions has been proved to be effective.
ACKNOWLEDGEMENTS
This research is supported by National Key Basic Research Program of China (973 Program, Grant No. 2012CB719903). At the same time, the project is supported by the National Natural Science Foundation of China (Grant No. 41171327).
References
Arivazhagan, S., Ganesan, L., Priyal, S. P., 2006. Texture classification using Gabor wavelets based rotation invariant features. Pattern Recognition Letters, 27 (16), pp. 1976-1982. Bovik, A., Clark, M., Geisler, W. S., 1990. Multichannel texture
analysis using localized spatial filter. IEEE Transactions on Pattern Analysis and Machine Intelligence, 12(1), pp. 55-73. Clausi, D. A., Jernigan, M. E., 2000. Designing Gabor flters for
optimal texture separability. Pattern Recgnition, 33(11), pp. 1835-1849.
Chellappa, R., Chatterjee, S., 1985.Classification of texture using Gaussian Markov random fields. IEEE Transaction on Acoustics, Speech, and Signal Processing,33(4), pp. 959-963. Chitre, Y., Dhawan, A. P., 1999.M-band wavelet discrimination
of natural textures. Pattern Recgnition, 32(5), pp. 773-789. Chen, Y., Wang, R., 2007. A method for texture classification
by intergrating Gabor filters and ICA. Acta Electronica Sinica, 35(2), pp. 299-303.
Dunn, D., Higgins, W. E., Wakeley, J., 1994. Texture segmentation using 2-D Gabor elementary function. IEEE Transactions on Pattern Analysis and Machine Intelligence, 16(2), pp. 130-149.
Duskunovic, I., Heene, G., Philips, W., Bruyland, I., 2000. Urban area detection in SAR imagery using a new speckle reduction technique and Markov random field texture classification. International Geoscience and Remote Sensing Symposium. Honolulu, USA, July 24-28.
Haralick, R. M., Shanmugam, K., Dinstein, I., 1973. Textural features for image classification. IEEE Transactions on Systems, Man, and Cybernetics, 3 (6), pp. 610-621
Hu, S., Guo, D., Sheng, Y., 2001. Extracting textural information of satellite SAR image based on wavelet decomposition. Journal of Remote Sensing, 5(6), pp. 424-427. Ivanov, V. K., Paschenko, R. E., Stadnyk, O. M., etc, 2006. Radar remote sensing images segmentation using fractal dimension field. Radar Conference, pp. 217-220.
Kain, A., Macon, M., 1998. Spectral voice conversion for text-to-speech synthesis. Proc ICASSP. Seattle, USA, May 12-15. Lopez-Espinoza, E. D., Altamirano-Robles, L., 2008. A method
based on Tree-Structured Markov random field and a texture
energy function for classification of remote sensing images.Electrical Engineering, Computing Science and Automatic Control, CEE 2008, 5th , Mexico city, November 12-14.
Lin, W., et al., 2007. A method of camouflage evaluation based on texture analysis model of Gabor wavelet. Acta Armamentarii, 28(10), pp. 1191-1194.
Lin, W., et al., 2009. Detection probability evaluation model based on texture feature of thermal infrared. Infrared and Laster Engineering, 38(1), pp. 155-159.
Li, Y., Meng, X., 2008. Image texture feature detection based on Gabor filter. Journal of Changchun University of Technology(Natural Science Edition), 29(1), pp. 78-81. Mallat, S. G., 1989. A theory for multiresolution signal
decomposition: the wavelet reprentation. IEEE Transactions on Pattern Analysis and Machine Intelligence, 11(7), pp. 674-693.
Ni, L., Zhang, J., Yao, W., 2004. SAR image’s texture analysis based on wavelet. Geomatics and Information Science of Wuhan University, 29(4), pp. 367-370.
Pentland, A. P., 1984.Fractal-based description of natural scenes. IEEE Transactions on Pattern Analysis and Machine Intelligence, 6(6), pp. 661-674.
Permuter, H., Francos, J., Jermyn, I., 2006. A study of Gaussian mixture models of color and texture features for image classification and segmentation. Pattern Recgnition,39(4), pp. 695-706.
Soh, L., Tsatsoulis, C., 1999.Texture analysis of SAR sea ice imagery using gray level Co-occurrence matrices. IEEE Transactions on Geoscience and Remote Sensing, 37(2), pp. 780-795.
Shu, N., 1998.Remote sensing image texture analysis and fractal assessment. Journal of Wuhan technical university of surveying and mapping, 23(4), pp. 370-373.
Song, Y., Wan, Y., Chen, P., 2006. Textural features analysis based on GLCM in TM thermal infrared remotely sensed images . Remote Sensing Information, 4, pp. 24-26.
Song, Y., Liu, B., Xie, J., 2010. Medical image texture features classification based on Gabor wavelet transform. Computer Engineering, 36(11), pp. 200-202.
Tuceryan, M., Jain, A. K., 1993. Texture Analysis, Handbook Pattern Recognition and Computer Vision. World Scientific, Singapore, pp. 235-276.
Wu, G., Zhang, Y., Lin, X., 2001. Optimal Gabor filter design for Bi-textured image segmentation. Acta Electronica Sinica, 29(1), pp. 48-50.
Weszka, J. S., Dyer, C. R., Rosenfeld, A., 1976. A comparative study of texture measures for terrain classification. IEEE Transaction on Systems, Man, and Cybemetics, 6(4), pp. 269-285.