DETERMINING TOOTH OCCLUSAL SURFACE RELIEF INDICATOR BY MEANS OF
AUTOMATED 3D SHAPE ANALYSIS
A.V. Gaboutchian a, *, V.A. Knyaz b, c,
a
Moscow State Medical-Stomatological University, 127473 Moscow, Russia –[email protected]
b State Research Institute of Aviation System (GosNIIAS), 125319 Moscow, Russia –[email protected] c
Moscow Institute of Physics and Technology (MIPT), Moscow, Russia –[email protected]
Commission II, WG II/10
KEY WORDS: Photogrammetry, 3D reconstruction, Automation, Non-contact measurements, Odontometry
ABSTRACT:
Determining occlusal surface relief indicator plays an important role in odontometric tooth shape analysis. An analysis of the parameters of surface relief indicators provides valuable information about closure of dental arches (occlusion) and changes in structure of teeth in lifetime. Such data is relevant for dentistry or anthropology applications. Descriptive techniques commonly used for surface relief evaluation have limited precision which, as a result, does not provide for reliability of conclusions about structure and functioning of teeth. Parametric techniques developed for such applications need special facilities and are time-consuming which limits their spread and ease to access. Nevertheless the use of 3D models, obtained by photogrammetric techniques, allows attaining required measurements accuracy and has a potential for process automation.
We introduce new approaches for determining tooth occlusal surface relief indicator and provide data on efficiency in use of different indicators in natural attrition evaluation.
* Corresponding author.
1. INTRODUCTION
Measurements are more often becoming essential in dental treatment. Measurement techniques being in use and related to visualisation can be divided in two categories. One of them – photogrammetric, which is specific not only for dental applications, provides 3D model obtaining (Knyaz et al, 2007; Mitchell and Chadwick, 2008). The other – odontometric – depicts physical sizes of teeth and is applicable in dentistry, anthropology, forensic dentistry and other disciplines related to biometric knowledge, traditional or present-day (Naidu and Freer, 2013; Paredes et al, 2015; Zubov, A.A., 1968). The best results in regard to measurement objectivity, versatility, accuracy, speed and convenience can be obtained through combination of photogrammetric and odontometric techniques.
Odontometry has provided important data applied in prosthodontics (Marxkors, 2003), studies of teeth durability (Khera et al, 1990), studies of attrition (Khan and Young, 2011), in tooth modelling (Lomiashvili and Ayupova, 2008) and etc. Odontometric methods are widely used in anthropology. They become a part of ethnical, archaeological, genetic, gender, racial and other studies (Zubov, 1973; Townsend et al, 2012; Pilloud et al, 2014). Our studies including determining of various odontometric and occlusiometric parameters have proved to be effective in tooth shape and occlusion description and development of tooth preparation recommendations (Gaboutchian et al., 2016).
Among measured and calculated odontometric parameters the occlusal surface relief indicator has a special place as it is found to be relevant to anatomical occlusal surface feature description in regard to separate teeth, studied individuals, between studied groups of teeth (upper and lower, premolars and molars), in
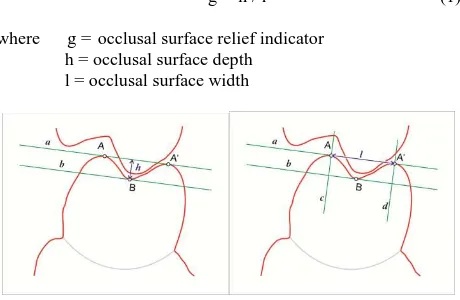
assessing pronounced natural changes in tooth structure caused by attrition (Gaboutchian, 2011). Unlike the known approach suggested by Marxkors it was combined with the odontotomic method and, therefore, possesses higher degree of objectivity. Our base method of determining the occlusal surface relief indicator was applied in odontometric studies of 1240 tooth sections. The indicator - g (1), is proportional to parameter h and reversely proportional to parameter l (Figure 1).
g = h / l (1)
where g = occlusal surface relief indicator h = occlusal surface depth
l = occlusal surface width
Figure 1. Base method for measuring occlusal surface relief indicator
Further studies and involvement of new software and photogrammetric techniques have expanded capabilities of odontometry. Thus we propose new improved approaches to measurement of occlusal surface relief expecting their higher sensitivity, in comparison to the base method, to minor but permanent attritional changes which have, as mentioned before,
The International Archives of the Photogrammetry, Remote Sensing and Spatial Information Sciences, Volume XLII-2/W4, 2017 2nd International ISPRS Workshop on PSBB, 15–17 May 2017, Moscow, Russia
This contribution has been peer-reviewed.
a strong connection with various conditions studied and described in dentistry. There are a number of techniques in tooth attrition assessment (Khan and Young, 2011). These techniques are either descriptive – more suitable for clinical applications, or parametric which are mainly used in researches. The presented approaches naturally derive from originally developed odontometric techniques we have been used for tooth size and angle measurements in our previous studies. They encompass positive features of odontotomy and provide parameters for occlusal surface feature evaluation. The presented study is aimed to assess the applicability of the suggested indicators in attrition evaluation in so far as it is not only a subject of versatile studies but is one of essential diagnostic features in treatment planning (Kalamkarov, 2004).
2. STUDIED 3D MODELS
As mentioned before, one of our research objectives was tooth attrition evaluation. Hereby we used 3D models of dental arches of 30-year old female; the same individual was examined in 10 year interval and found to have intact, regarding dental treatment, teeth (Figures 2 a, b).
Models were obtained by scanning stone cast models on two different devices: custom designed photogrammetric system (Knyaz et al, 2007) and S600 Arti Scanner (ZirkonZahn). Each of them provides scanning precision of 5 and 10 µm respectively. Both upper first molars were picked for further studies. They were separated from images of complete dental arches and images of corresponding teeth were superimposed by means of accurate 3D surface registration based on iterative closest points algorithms. Complete dental arch models were not used in our study due to interproximal tooth attrition and tooth migration which would cause inevitable errors in image superimposing procedure.
Figures 2 a, b. 3D models of upper dental arches, obtained with 10-year interval
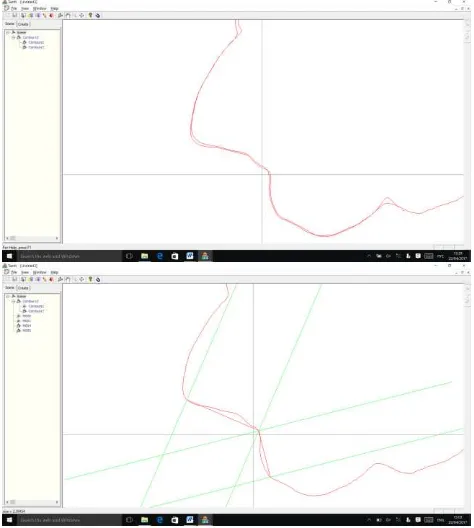
Thus images of the studied teeth were separated from dental arch images and merged for obtaining uniformly aligned
sections (Figure 3). For image merging procedure it is preferable to use side surfaces of teeth insofar as occlusal surfaces are susceptible to functionally caused morphological changes.
Figure 3. Odontotomy of combined images of upper right molars
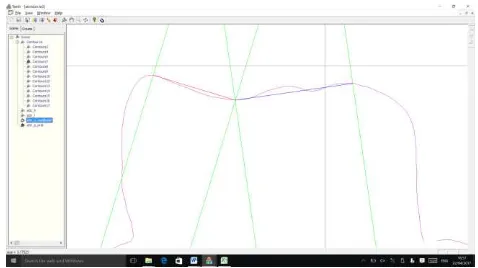
Odontomy was applied to combined teeth images providing for study objectivity. Contours of combined teeth were depicted in 2D mode and were subsequently used for automated measurements based on odontometric geometric constructions (Figures 4 a, b).
Figures 4 a, b. Combined contours of teeth depicted on a section and odontometry
3. MEASUREMENT METHODS AND TOOTH OCCLUSAL SURFACE RELIEF INDICATORS
techniques for determining the indicators’ sub-pixel accuracy for 2D tooth section and sub-facet accuracy for 3D tooth surface.
We are not going to duplicate the above-mentioned base method for valuation of occlusal surface relief in this chapter. The newly proposed indexes require some geometric constructions on contours (red lines on Figure 3a and 3b, taken onwards as s) of teeth very similar to ones we have used for cusp inner slope inclination measurements (Abdoulbekov et al, 2014).
The newly introduced indicator for occlusal relief assessment, taken as v, is proportional to tooth contour length (blue line on Figure 5a, taken as t) and is inversely proportional to the length of chord s connecting anthropometric points (2).
v = t / s (2)
where v = occlusal surface relief indicator t = cusp inner slope length
s = shortest distance between cusp inner slope limits
Tooth section shown in Figure 5 is obtained as a section of given plane P the tooth surface presented by triangulated irregular net (TIN). So the curve t is a set of connected lines and
t is calculated as a sum of all elementary lines li between points A and B.
The length of s is a distance between points A and B given by
2
Figures 5 a, b. New approach to measuring occlusal surface relief indicator
The next indicator taken as r is proportional to area demarcated by tooth contour above line s (grey area on Figure 3 b, taken as
p) and is inversely proportional to area demarcated by tooth contour below line s (yellow area on Figure 5 b, taken as n) (3). Relation of the above-mentioned parameters can be put down as
r = p / n (3)
where r = occlusal surface relief indicator p = area of “positive” tooth contour n = area of “negative” tooth contour
The point of intersection of line L and curve C xm is found as an intersection of line L with elementary line lj. Elementary line
lj is found by checking intersection for all elementary lines li between points A and B.
The area between of line L and curve C is found as a sum of
The variety of measurement results depends on tooth anatomical occlusal surface morphology which, in its turn, depicts genetically determined structure of premolar or molar subjected to natural attrition. We would like to present in this article examples of measurements conducted on combined contours (Figure 4b) and on a contour of an attrited tooth (Figure 6). The Figure 6. Odontometry on a section of an attrited tooth attrited tooth is the lower right molar of a 62 year old individual.
Figure 6. Odontometry on a section of an attrited tooth
Measurement and calculation results for g indicator are presented in Table 7. As can be seen, the difference between indexes on selected sections is not pronounced. The lowest indicator has the attrited tooth section, though at the same time, uniform sections on combined teeth sections are demonstrating an increase of g indicator alongside with attrition progress. In
The International Archives of the Photogrammetry, Remote Sensing and Spatial Information Sciences, Volume XLII-2/W4, 2017 2nd International ISPRS Workshop on PSBB, 15–17 May 2017, Moscow, Russia
This contribution has been peer-reviewed.
greater values on the attrited lower molar section. Upper molars demonstrate decreasing l indicator with the growth of attrition.
h, mm l, mm g
initial 0.785 7.062 0.111
plus 10 years 0.785 6.935 0.113
attrited 0.814 7.369 0.110
Table 7. Tooth occlusal surface relief indicator g
Measurement and calculation results for v indicator are presented in Table 8. They include measurements for vestibular, or buccal, cusps and oral, or lingual/palatinal, cusps. The measurements presented below demonstrate relief flattening through 10 year interval.
Table 8. Measuring results of tooth occlusal surface relief indicator v
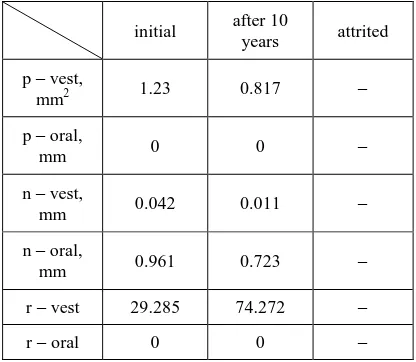
Measurement and calculation results for r indicator are presented in Table 9. They include measurements for vestibular, or buccal, cusps and oral, or lingual/palatinal, cusps. As can be seen measurement result for attrited tooth sections are not presented in the article in full.
initial after 10
Table 9. Measuring results for tooth occlusal surface relief indicator r
5. CONCLUSION
Hence a new method for tooth shape analysis is proposed. It is based on determination and comparison of two tooth shape characteristics named in present context linear indicator and area indicator. The results of preliminary researches demonstrated the advantages of the proposed approach in comparison to traditionally used techniques.
The algorithms and software for automated calculation of new shape indicators are developed and evaluated. The software allows to transform different tooth 3D models into common coordinate system (to align teeth), build a section for a set of aligned teeth at given place and calculate the required geometrical parameters. The evaluation of developed software shows the usefulness and convenience for an expert.
Combination of suggested evaluations facilitates study objectivity and precision. Whilst the proposed method is more complex, we can mark that measurement automation saves significant amount of time and effort. Another important feature of the newly suggested method is in high diagnostic potential in estimating attritional changes on teeth and their various parts.
REFERENCES
Abdoulbekov M., Bolshakov G., Gaboutchian A., Isakova T., Kuznetsov O., 2014. The Use of Odontometric Principles in Measurement of Angles of Tooth Cusp Inner Inclines // Dental Forum, No 4, pp. 14-15.
Gaboutchian A.V., 2011. Clinical-experimental study of tooth occlusal surface preparation for prosthetic treatment by fixed prosthesis. PhD thesis synopsis, Moscow, MSMSU.
Gaboutchian A.V., Bolshakov G.V., Knyaz V.A.,2016. The Use of 3D Image Processing in the Practice of Tooth Preparation // Dental Forum, №1, pp 24-27.
Gaboutchian A., Knyaz V., Bolshakov G., 2017. Odontometric and Occlusiometric Studies on Computer Three Dimensional Images of Premolars and Molars. Vestnik Antropologii
Kalamkarov Kh.A., 2004. Prosthetic Treatment of Pathological Attrition of Tooth Solid Tissues, Medical Informational Agency.
Khan, F., Young W.G., 2011. Tooth wear: The ABC of the worn dentition. Wiley-Blackwell.
Khera, S.C., Carpenter, C.W., Staley, R.N., 1990. Anatomy of cusps of posterior teeth and their fracture potential. – JPD, v 64, № 2, p. 139–147.
Knyaz, V., Zheltov, S., Gabuchyan, A., Bolshakov, G., 2007. Photogrammetric system for automated teeth arches 3D models generation and teeth occlusion analysis. Optical 3D Measurement Techniques VIII, Zurich, Vol. I, pp. 299-304.
Knyaz V., Gaboutchian A., 2016. Photogrammetry-based Automated Measurements for Tooth Shape and Occlusion Analysis // The International Archives of the Photogrammetry, Remote Sensing and Spatial Information Sciences, Volume XLI-B5, doi:10.5194/sprsarchives-XLI-B5-849-2016.
Lomiashvili, L.M., Ayupova, L.G., 2008. The art of modelling and restoration of teeth. Med. Kniga.
Marxkors, D., Marxkors, R., 2003. Tooth preperation for fixing crowns. Novoe v stomatologii, № 1, pp. 73-76.
Mitchell, H.L., Chadwick, R.G., 2008. Challenges of photogrammetric intra-oral tooth measurement. The International Archives of the Photogrammetry, Remote Sensing and Spatial Information Sciences. Vol. XXXVII. Part B5. Beijing.
Naidu, D., Freer, T.J. 2013b. The evidence supporting methods of tooth width measurement: Part II. Vernier calipers to stereophotogrammetry. Aust Orthod J. 2013 Nov; 29(2):164-9.
Paredes, V., Tarazona, B., Zamora, N., Hernandez, Y., San José, V., 2015. A Comparative Study of Reproducibility, Reliability and Accuracy in Measuring Mesiodistal Tooth Size Using Four Different Methods — 2D Digital, 3D CBCT, 3D Segmented and 3D Intraoral Scanner Method. Issues in Contemporary Orthodontics. http://dx.doi.org/10.5772/59366.
The International Archives of the Photogrammetry, Remote Sensing and Spatial Information Sciences, Volume XLII-2/W4, 2017 2nd International ISPRS Workshop on PSBB, 15–17 May 2017, Moscow, Russia
This contribution has been peer-reviewed.