arXiv:1709.05451v1 [nucl-th] 16 Sep 2017
Nuclear mass parabola and its applications
Junlong Tian,1,∗ Di Yuan,1 Shuo Han,1 Yun Huang,1 and Ning Wang2, 3,†
1
School of Physics and Electrical Engineering,
Anyang Normal University, Anyang 455000, People’s Republic of China
2
Department of Physics, Guangxi Normal University,
Guilin 541004, People’s Republic of China
3
State Key Laboratory of Theoretical Physics,
Institute of Theoretical Physics, Chinese Academy of Sciences,
Beijing 100190, People’s Republic of China
(Dated: September 19, 2017)
Abstract
We propose a method to extract the properties of the isobaric mass parabola based on the total
double β decay energies of isobaric nuclei. Two important parameters of the mass parabola, the
location of the most β-stable nuclei ZA and the curvature parameter bA, are obtained for 251 A
values based on the total double β decay energies of nuclei compiled in NUBASE2016 database.
The advantage of this approach is that one can efficiently remove the pairing energies term PA
caused by odd-even variation, and the mass excess M(A, ZA) of the most stable nuclide for mass
number A in the performance process, which are used in the mass parabolic fitting method. The
Coulomb energy coefficientac = 0.6910 MeV is determined by the mass difference relation of mirror
nuclei 0.5bA(A−2ZA) = ∆(1H−n)+ac(A2/3−1.0583c), andc= 1.1914 MeV. The symmetry energy
coefficient is also studied by the relation asym(A) = 0.25bAZA.
∗Electronic address: [email protected]
I. INTRODUCTION
The nuclide refers to an nucleus as characterized by the number of protons (Z) and
neutrons (N) that the nucleus contains. A chart of nuclides is formed by listing the known
nuclei, both stable and radioactive, in an array on a graph ofZ versusN. If perpendicular to
the plane in which a nuclide is located the atomic mass is plotted as a third dimension, the
resulting mass surface has the shape of a valley. An isobaric (A = constant) slice through
this mass surface yields roughly a parabola which is usually referred to as a Bohr-Wheeler
parabola [1]. The isobars located on the sides of the parabola are unstable to radioactive
decay to more stable nuclides lower on the parabola, though usually the most stable nucleus
is not located exactly at the minimum ZA of the parabola. Nuclides on the low Z side of
the parabolic minimum ZA decay by β− emission toward the minimum. Nuclides on the
high Z side of the minimum ZA decay in the opposite direction toward the minimum, the
decay being either by β+ emission or electron capture. The term “β decay” is used here to
cover disintegration by emission of β− and β+ particles and by capture of electrons. The
β decay energies is the maximum value in the β energy spectrum. Indeed, it follows from
the parabolic mass dependence that the β decay energy is directly proportional toZ−ZA.
Because of the extra stability associated with pairs of like nucleons an isobaric slice through
the mass surface at an even A value tends to yield two parabolas of the same shape but
displaced one below the other. On the lower parabola lie the even-even nuclides, on the
upper parabola lie the odd-odd nuclides. Consequently the β decay energies plotted versus
Z lie not on a single straight line but on a pair of parallel straight lines.
Isobaric analysis of β-decay energies have been made by several authors [1–3], the early
work necessarily being based on scanty experimental data. In Ref. [1], Bohr and Wheeler
had used the least squares method to determine the parameters of the mass parabola – the
location of the most β-stable nuclei ZA, the curvature parameter bA and odd-even mass
difference ∆E for 20 A values by three-parameter parabola fitting to the isobaric mass
excess. In Ref. [2], J. W. Dewdney had analyzed the isobaricβ decay energies and used the
least squares method to determine the parameters of the mass parabola for 157 A values.
The experimental data are taken from the Refs. [4, 5]. Later, X. Y. Li and co-workers [3]
updated the three parameters of isobaric mass parabola for 234 A values (10≤A≤253) in
about 1000 nuclides. In recent decades, with the development of experimental instruments
and the progress of science technology, a large number of unstable nuclei can be produced
in a single experiment in their ground and/or isomeric states, and their masses can be
measured with high precision. The experimental information or recommended values for
nuclear and decay properties of 3437 nuclides in their ground and excited isomeric states are
compiled in the mass table of the NUBASE2016 [7]. The number and precision of nuclear
mass in NUBASE2016 have highly increased in comparison with the results compiled in
the AME1977 database [6]. The data now available are so much more extensive that it is
possible to analyse them in a statistical way.
Double β decay has been and continues to be a popular topic, which is a rare transition
between two nuclei with the same mass number that changes the nuclear charge number by
two units. The doubleβdecay is a second-order weak process of the form (A, Z)→(A, Z+2)
that has been observed in many nuclei [8,9]. It has been long recognized as a powerful tool
for the study of lepton conservation in general and of neutrino properties in particular.
Because the lifetimes of ββ decay are so long greater than 1017 years, the experimental
study ofββ decay is particularly challenging and has spawned a whole field of experiments
requiring very low background. The energy release to be expected in double β decay shows
even greater regularity than that of singleβ-decay as shown in Ref. [10], but detailed studies
of the properties of the mass parabola have not been performed by using the total double
β-decay energies. In this paper we use more than 2400 total doubleβ decay energies, which
are complied in the NUBASE2016 database, to analyze the properties of the Bohr-Wheeler
isobaric mass parabola by all modes of double β decay in the theoretical method. The
advantage of this approach is that one can efficiently remove the pairing energies term PA
caused by odd-even variation, and the mass excess M(A, ZA) of the most stable nuclide for
mass number A in the performance process, which are used in the mass parabolic fitting
method. Furthermore, the over-all simplicity of the double β decay energy pattern may
II. THEORETICAL FRAMEWORK
Bohr and Wheeler [1] expressed the semi-empirical formula for the mass surface in the
form for constant A,
M(A, Z) =M(A, ZA) +
1
2bA(Z−ZA)
2−P
A−S(N, Z), (1)
Where M is the mass excess of the nucleus (A,Z) (nuclidic mass minus mass number), Z is
as usual the proton number and A the total number of nucleons in the nucleus. M(A, ZA)
the mass excess of the stable nuclidic Z = ZA for mass number A, bA a measure of the
curvature of the isobaric mass section, ZA the charge (not necessarily an integer) of the
most β-stable isobar,PA the pairing energy due to the odd-even variation, and S(N, Z) the
shell correction term.
The Q value is defined as the total energy released in a given nuclear decay. The Q
value of β decay is calculated by the mass difference between the two nuclei (A, Z) and
(A, Z+ 1), meanwhile, the expressions for β decay energies may be derived from empirical
mass equation Eq. (1) when shell correction be neglected. If such parabolas actually exist,
the β decay energies for constant values of odd A will give precisely straight lines when
plotted against the proton number. For even A value, the β decay energies tends to yield
a pair of parallel straight lines. For negative β decay and positive β decay (or electron
capture), one can combine them into one universal description,
Qβ =M(A, Z)−M(A, Z + 1) =−bA(Z−ZA+
1
2) + ∆E. (2)
Because the reaction will proceed only when the Q value is positive. Where “Qβ >0” forβ−
decay occurs when the mass of atomM(A, Z) is greater than the mass of atomM(A, Z+ 1);
“Qβ <0” for β+ decay occurs when the mass of atom M(A, Z + 1) is greater than that of
M(A, Z). The ∆E = 2PA for even-even nuclides, the ∆E =−2PA is for odd-odd nuclides,
and for odd-A nuclides (i.e. even-odd and odd-even) ∆E = 0.
In this paper our aim is propose a very simple empirical formula only depends on the basic
parametersZAandbA. So we use the total doubleβdecay energies to analyze the properties
of the mass parabola rather than total single β decay energies. The parameters M(A, ZA)
and ∆E are removed by the mass difference of (A, Z) and (A, Z + 2). We can obtain the
mentioned,
Q2β =M(A, Z)−M(A, Z+ 2) =−2bA(Z−ZA+ 1), (3)
where “Q2β > 0” for β−β−, and “Q2β < 0” for β+β+. (Z, A) will be called hereafter
the “disintegrating atom” no matter whether the decay actually proceeds from (A, Z) to
(A, Z + 2) or vice versa. The total double β decay energies are lie on the same lines for
odd-odd and even-even nuclide for even-A values, and for adjacent odd-A and even-A values
lie approximately on the same lines.
III. THE RESULTS AND DISCUSSIONS
A. The procedure of the calculated values of ZA and bA
We use the three equations Eqs.(1)-(3) to analyse the corresponding experimental data,
i.e. mass excess, totalβ decay energies and total double β decay energies, both parameters
ZA and bA of the isobaric mass parabola are obtained by using the least-squares fitting
procedure. We obtain the optimal values ZA and bA are list in three attached files (see the
attached files table 1-3). The calculated results are compared, and they are almost identical
for three different methods to fit the corresponding experimental data.
But the first equation Eq.(1) at least need three parameters ZA, bA and M(A, ZA) to
fit experimental mass excess for odd-A nuclei. Here, PA =0 is taken, in fact the values of
PA < 0.3 MeV for odd-A nuclei presented in Ref. [2]. For even-A nuclei, an isobaric slice
through the mass surface tends to yield two parabolas of the same shape but displaced one
below the other. On the lower parabola lie the even nuclides, on the upper parabola lie the
odd nuclides. So it is necessary to unify the parametersZA and bA for even-even nuclei and
odd-odd nuclei, bA= 0.5(boA−o+b e−e
A ) and ZA= 0.5(ZAo−o+Z e−e
A ) , where b e−e
A and Z e−e A for
even-even nuclei,boA−o and ZAo−o for odd-odd nuclei, respectively. Finally, the value of ∆E is
obtained by the difference of ∆E =Mo−o(A, Z
A)−Me−e(A, ZA). For Eq. (2), it is similar
procedure to that of Eq. (1), the value of ∆E equals the half of the difference between two
intercepts of a pair of parallel lines.
For the construction of the Q2β formula we start by plotting the total double β decay
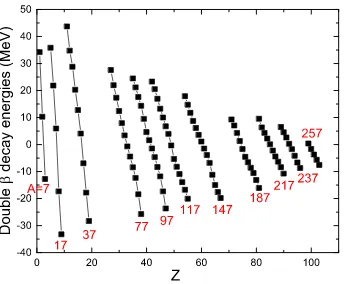
energies Q2β versus the charge number Z for 11 odd-A values 7 ≤ A ≤ 257 in Fig.1. The
0 20 40 60 80 100
FIG. 1: (Color online) Total double β decay energies Q2β as a function of the charge number ofZ
for 11 odd-A values (7≤A≤257). The experimental data are taken from NUBASE2016 [7].
line relation in this plot, and the slopes 2bA of these lines show the general trend of Q2β to
decrease slightly with increasing mass number A. The similar linear relation is also shown
for even-A values in Fig. 2.
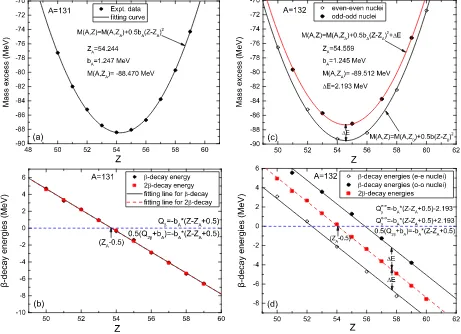
Fig. 2 shows two examples of the treatment of experimental data forA= 131 andA= 132
as a function of the nuclear charge number Z. The Fig.2 (a) is a plot of the experimental
isobaric mass parabola at A = 131. The mass parabola imply the β or 2β decay energies
directly below (b). The intercept ZA on the β decay energy graph corresponds to the
minimum of the mass parabola. The slope bA of the β energy graph is a measure of the
steepness of the mass parabola. The red dashed lines in fig.2 (b) and (d) denote the results
of the fitting experimental data Q2β by Eq. (3) transformation. The fig.2 (c) and (d) are
similar plots but for A = 132. Fig. 2 (c) shown mass excesses lie alternately on a pair of
50 52 54 56 58 60 62 fitting line for -decay fitting line for 2-decay
(Z
FIG. 2: (Color online) Two examples of experimental data and their treatment. The mass excesses
(a), the β decay energies (b) and the curves fitted to them for A= 131, (c) and (d) are same as
(a) and (b) forA= 132, as a function of the nuclear charge numberZ. The solid curves in Fig. 2
(a) and (c) denote the results of the fitting experimental mass excess by Eq. (1). The solid lines
in Fig. 2 (b) and (d) denote the results of the fitting experimental data Qβ by Eq. (2), and the
dashed lines in Fig. 2 (b) and (d) denote the results of the fitting experimental data Q2β by Eq.
(3).
below the odd parabola. This implies thatβ decay points lie alternately on a pair of parallel
straight lines, while the double β decay points lie on a single straight line both odd-A and
even-A values.
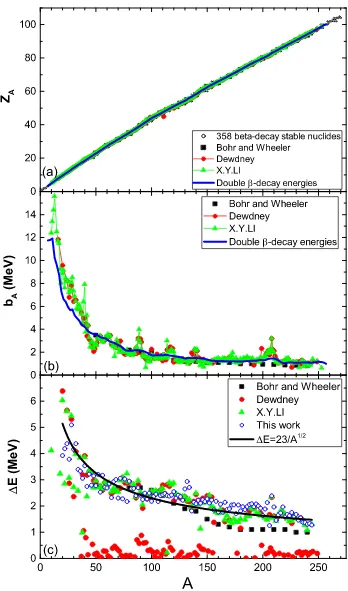
Fig. 3 presents the mass parabola parameters ZA (a), bA (b) and ∆E (c) as a function
of nuclear mass number A. The calculated values of ZA and bA are shown in Fig. 3 (a) and
(b) with the blue solid curves by using Eq. (3). The ∆E are plotted with blue open circles
0
Double -decay energies 358 beta-dec ay stable nuc lides Bohr and W heeler
Dewdney X.Y.LI
Double -dec ay energies
Z
nuclear mass number A. The calculated values of them are compared with early results of Bohr
and Wheeler [1] (the solid squares), Dewdney [2] (solid circles) and X.Y.Li [3] (solid triangles).
decay energies, and the pairing energy termPA= 11.50δ/A1/2 is obtained, where δ equals 0
for odd-A, +1 for even-even and -1 for odd-odd nuclides. The calculated values of them are
compared with early results of Bohr and Wheeler [1] (the solid squares), Dewdney [2] (solid
circles) and X.Y.Li [3] (solid triangles). There are currently known to be 358 beta-decay
stable nuclides [11] plotted in Fig. 3 (a) with open circles. We also find that Dewdney
in Ref. [2] maybe make a mistake on Z0=44.912 for A=111, and X. Y. Li et.al [3] make
an almost identical mistake on bA=0.8401 for A=144. Because the marked discontinuities
occur only at the two A values shown in Fig. 3. Our results are Z0=47.7566, bA=1.7955 for
A=111, and Z0=59.9768, bA=1.5102 for A=144.
B. Determination of the Coulomb energy coefficient ac by the relation of ZA and
bA
In semi-empirical Bethe-Weizs¨acker mass formula [12,13], the binding energy B(A, Z) of
a nucleus can be expressed as a function of mass number Aand charge number Z,
B(A, Z) =avA−asA2/3−ac Z2
A1/3 −asym
(N −Z)2
A +PA, (4)
withPA=apδA−1/2, where the “δ=+1” is for even-even nuclides, the “δ=–1” is for odd-odd
nuclides, and for odd-A nuclides (i.e. even-odd and odd-even)δ= 0. The av, as, ac, asymand
ap are the volume, surface, Coulomb, symmetry and pairing energy coefficients, respectively.
In the textbook, the relation between the nuclear mass excess and the binding energy is
written as
B(A, Z) = 931.4943×(0.008665A−0.00084Z)−M(A, Z), (5)
where 0.008665 is the mass excess of neutron and 0.00084 the hydrogen-neutron mass
dif-ference in atomic mass unit, and one atomic mass unit is equivalent to 931.4943 MeV.
Mirror nuclei mass relation is deduced based on three assumptions as follows: 1) The
dif-ference between the binding energies of mirror nuclei is only due to the Coulomb interaction.
It is known that in the absence of Coulomb interactions between the protons, a perfectly
charge-symmetric and charge-independent nuclear force would result in the binding energies
of mirror nuclei being identical [14–16]; 2) The Coulomb energy difference between a pair of
mirror nuclei is proportional to Y =N −Z, the same as the assumption used in Ref. [14],
−∆B =EC[A,1
2(A+Y)]−EC[A, 1
in which bc is the proportionality coefficient; 3) The coefficient of proportionality which
indeed depends on A, may be considered as independent of Y for a given A. In Refs.
[14,17], it was found that thebc coefficients are roughly constant (see the Tables 3-7 in Ref.
[17]) for a givenA, and Ormand obtained an empirical formula bc = 0.710A2/3−0.946 MeV
by fitting to 116 experimental data with an rms deviation of 102 keV [14].
On the other hand, the mirror mass relations can be obtained by Eq.(1). Firstly, one
need to express charge number Z with mass number A, that is to say, Z = 12(A±Y) for
a pair of mirror nuclei. The difference of mass excess for a pair mirror nuclei for both odd
and even values ofA with different Y = 1,2,3, ... reads
∆M =M[A,1
2(A+Y)]−M[A, 1
2(A−Y)] = 1
2bA(A−2ZA)Y. (7)
Combining the three equations Eqs. (5)-(7), and taking the hydrogen-neutron mass
differ-ence ∆(1H−n)=−0.7825 MeV, we can obtain
1
2bA(A−2ZA)−∆(1H−n) =bc. (8)
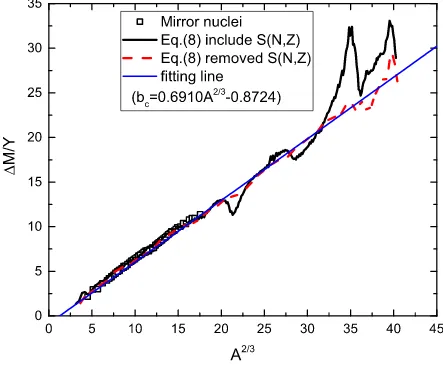
This result is consistent with that in Ref. [18]. The calculation results are presented in
Fig. 4, the mass differences of the 95 pairs of mirror nuclei, scaled by the charge difference
Y, are plotted versus A2/3 and are seen to lie on a straight line. The value of Y ranges from
1 (32 cases) to 6 (1 case). The thick solid curve and the dashed curve represent the left hand
of Eq. (8) including the shell correction energies and removed the shell correction energies,
respectively. The shell correction energies take from Ref. [19]. The thick solid curve shows
some oscillations and fluctuations due to the shell effect. When the shell corrections are
taken into account, the fluctuations in the extractedbc are reduced effectively for the dashed
curve. The thin solid line is the fitting straight line. We obtain bc = 0.691A2/3 −0.8724
MeV by fitting left hand of Eq.(8) to 251 A values with an rms deviation of 0.384 MeV
smaller than that bc = 0.710A2/3 − 0.946 MeV with rms deviation of 0.588 MeV. The
intercept 0.8724 is the contributions of the Coulomb exchange term and other correction term
such as the nuclear surface diffuseness correction. If adopt the Coulomb energy expression
Ec = acZ 2
A1/3(1−cZ
−2/3), in which the contributions of the Coulomb exchange term and other
correction terms are taken into account, we obtain ac = 0.691 MeV and c = 1.1914 MeV.
Previous determinations of Coulomb-energy coefficient from the energy difference for mirror
0 5 10 15 20 25 30 35 40 45 0
5 10 15 20 25 30 35
Mirror nuclei
Eq.(8) include S(N,Z)
Eq.(8) removed S(N,Z)
fitting line
(b c
=0.6910A 2/3
-0.8724)
M
/
Y
A 2/3
FIG. 4: (Color online) Scaled mass difference (solid squares) of 95 pairs of mirror nuclei in the
region 11≤A≤75 as a function of A2/3. The solid curve and the dashed curve represent the left
hand of Eq.(8) including the shell correction energies and removed the shell correction energies,
respectively. The shell correction energies are taken from Ref. [19]. The thin solid line is the fitting
straight line.
forA >75. However, it is shown that the mirror-nuclide method can be extended to include
all values of A in the Eq. (8). The availability of the Coulomb energy coefficient for the
complete range of A values should be helpful in a study of the variation of the Coulomb
C. Determination of the symmetry energy coefficient asym by the relation of ZA
and bA
Insert Eq.(4) and Eq.(5) into the expression Eq.(3) and take the doubleβ decay Q value
of (A,Z-1), we can obtain
Q2β(A, Z −1) = M(A, Z −1)−M(A, Z+ 1)
=B(A, Z+ 1)−B(A, Z−1) + 2∆(1 H−n)
=−(16asym
A +
4ac
A1/3)Z+ 8asym+ 1.5649. (9)
Meanwhile, the doubleβ decay Q value of (A,Z-1) in Eq.(3) is written as
Q2β(A, Z−1) =−2bA(Z −ZA), (10)
The results of symmetry energy coefficient asym are obtained by solving the combination of
Eqs.(9) and (10).
asym =
(2bAZA−1.5649)
8 ≃
bAZA
4 (11)
The mass dependence of the symmetry energy coefficient of nuclei is written by
Danielewicz and Lee [21] as asym(A) = S0/(1 + κA−1/3), where S0 is the volume
sym-metry energy coefficient of the nuclei and κ is the ratio of the surface symmetry coefficient
to the volume symmetry coefficient. The other form for description of the mass dependence
of asym(A) is frequently used and written as asym(A) = S0(1−κA−1/3) [22–27]. Figure 5
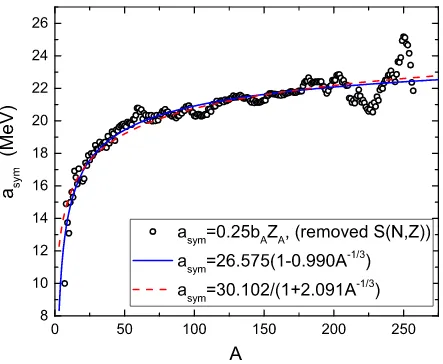
shows the extracted symmetry-energy coefficient asym(A) as a function of A from Eq. (11).
The open circles denote the results removed the shell corrections from the KTUY model
be-ing taken into account. But it also show some odd-even staggerbe-ings and fluctuations, they
can be caused by nuclear residual pairing interaction and the quantum effect, i.e., simple
fluctuations of simple particle levels near the Fermi energy. The blue solid curve and the
red dashed curve denote the results of two analytic expressions in which the coefficients are
determined by fitting the open circles. By performing a two-parameter fitting to theasym(A)
obtained previously by the relation Eq.(11), one can obtain the values of S0 and κ. With
95% confidence intervals, we obtain the values of S0 = 26.575±0.271 and κ= 0.99±0.035,
and the corresponding rms deviation is 389 keV, if assuming mass dependence of symmetry
0 50 100 150 200 250 8
10 12 14 16 18 20 22 24 26
a
s
y
m
(
M
e
V
)
A a
sym
=0.25b A
Z A
, (removed S(N,Z))
a sym
=26.575(1-0.990A -1/3
)
a sym
=30.102/(1+2.091A -1/3
)
FIG. 5: (Color online) Extracted symmetry energy coefficient of finite nucleiasym(A) as a function
of mass number A from Eq. (11) (open circles), but the shell corrections S(N,Z) from Ref. [19]
are removed from the mass excess of nuclei. The blue solid curve and the red dashed curve denote
the results of two analytic expressions in which the coefficients are determined by fitting the open
circles.
obtainsS0 = 30.102±0.741 MeV andκ= 2.091±0.166, respectively, with an rms deviation
of 398 keV. The result is shown in Fig.5 by the red dashed curve. The obtained values ofS0
and κ are in agreement with the range ofS0 = 31.1±1.7 MeV and κ= 2.31±038 given by
IV. SUMMARY
In summary, we have proposed a method to determine the two important parameters
of the well-known Bohr-Wheeler mass parabola, the location of the most β-stable nuclei
ZA and the curvature bA of the isobars. The linear relation of the total double β decay
energies is deduced based on the isobaric mass parabola, which only include two parameters
of ZA and bA, their values have been refitted for 251 A values based the latest
experi-mental total double β decay energies of nuclei compiled in NUBASE2016 database. The
advantage of this approach is that one can efficiently remove the pairing energies term PA
caused by odd-even variation, and the mass excess M(A, ZA) of the most stable nuclide
for mass number A in the performance process, which are used in the mass parabolic
fit-ting method. Based on the obtained two parameters of ZA and bA, the Coulomb energy
coefficient ac = 0.691 MeV is determined by the mass difference relation of mirror nuclei
0.5bA(A−2ZA) = ∆(1
H−n)+ac(A2/3 −1.0583c), and c = 1.1914 MeV. Two analytic
ex-pressions of symmetry energy coefficient for description of the mass dependence ofasym(A),
asym(A) = 30.102/(1+2.091A−1/3) andasym(A) = 26.575(1−0.99A−1/3), are also determined
by the relationasym(A) = 0.25bAZA. The obtained values ofS0 and κare in agreement with
the results in references. It imply the method is reliable to determine Coulomb energy
coef-ficient and the mass dependence of the symmetry energy coefcoef-ficient by the correspondence
relations only including two parameters ZA and bA. The further work is in progress based
several theoretical mass tables and in comparison with the results of the experimental data.
ACKNOWLEDGEMENTS
We thank Prof. L. Ou for helpful communications. This work was supported by
National Natural Science Foundation of China, Nos. 11475004, 11275052, 11365004,
11375094 and 11447001, the Natural Science Foundation of He’nan Educational
Commit-tee Nos.2011A140001 and 2011GGJS-147, and innovation fund of undergraduate at Anyang
Normal University (ASCX/2017-Z40). N. W. acknowledges the support of the Open Project
Chinese Academy of Sciences, China (No. Y4KF041CJ1).
[1] N. Bohr and J. A. Wheeler, Phys. Rev.56,426 (1939).
[2] J. W. Dewdney, Nucl. Phys. 43, 303 (1963).
[3] Xian-Yin Li, Shi-Huai Yao and Fu-Xin Xu, Chin. Phys. C 5, 611 (1981).
[4] F. Everling, L. A. K¨onig, J. H. E. Mattauch and A. H. Wapstra, Nuclear Physics 18, 529
(1960).
[5] L. A. K¨onig, J. H. E. Mattauch and A. H. Wapstra, Nuclear Physics 31 (1962) 18
[6] A. H. Wapstra and K. Bos, Atomic data and nuclear data tables,19, 175 (1977).
[7] G. Audi, F. G. Kondev, M. Wang, W.J. Huang and S. Naimi, Chin. Phys. C 41, 030001 (2017).
[8] W. Rodejohann, Int. J. Mod. Phys. E 20, 1833 (2011).
[9] J. Beringer, et al, (Particle Data Group), Phys. Rev. D 86, 010001 (2012).
[10] K. Way and M. Wood, Phys. Rev. 94, 119 (1954).
[11] Interactive Chart of Nuclides (Brookhaven National Laboratory), http://www.nndc.bnl.gov
/chart/; or https://en.wikipedia.org/wiki/Beta-decay stable isobars
[12] C. F. von Weizs¨aker, Z. Phys. 96 (1935) 431.
[13] H. A. Bethe and R. F. Bacher, Rev. Mod. Phys. 8, 82 (1936).
[14] W. E. Ormand, Phys. Rev. C 55, 2407 (1997).
[15] S. M. Lenzi and M. A. Bentley, Lect. Notes Phys.764, 57 (2009).
[16] S. Shlomo, Rep. Prog. Phys.41, 957 (1978).
[17] W. E. Ormand and B. A. Brown, Nucl. Phys. A491, 1 (1989).
[18] A. M. Durnford , J. Phys. A2, 59 (1969).
[19] H. Koura, T. Tachibana, M. Uno, and M. Yamada, Prog. Theor. Phys. 113,305 (2005).
[20] Junlong Tian, Haitao Cui, Kuankuan Zheng, and Ning Wang, Phys. Rev. C 90, 024313 (2014).
[21] P. Danielewicz and J. Lee, Nucl. Phys. A 818, 36 (2009)
[22] P. M¨oller, J.R. Nix, W.D. Myers, and W.J. Swiatecki, At. Data Nucl. Data Tables 59, 185
(1995).
[23] M. Stoitsov, R. B. Cakirli, R. F. Casten, W. Nazarewicz, and W. Satula, Phys. Rev. Lett. 98,
132502 (2007).
[25] S. K. Samaddar, J. N. De, X. Vinas, and M. Centelles, Phys. Rev. C 76, 041602(R) (2007).
[26] V. M. Kolomietz and A. I. Sanzhur, Phys. Rev. C 81, 024324 (2010).
[27] H. Jiang, G. J. Fu, Y. M. Zhao, and A. Arima, Phys. Rev. C 85, 024301 (2012).