International Review of Economics and Finance 8 (1999) 455–466
The evaluation of the performance of UK American
unit trusts
Jonathan Fletcher*
Department of Finance and Accounting, Glasgow Caledonian University, Cowcaddens Road, Glasgow, G4 0BA, UK
Received 19 December 1997; accepted 7 April 1999
Abstract
This article examines the performance of 85 UK unit trusts with North American investment objectives between January 1985 and December 1996 using unconditional and conditional performance measures. The paper finds that, on average, the trusts register insignificant perfor-mance to each of the respective benchmark portfolios. In addition there is no evidence of any predictability in performance. The results of the article are consistent with market efficiency in that unit trusts do not, on average, possess private information, higher expenses tend not to improve performance, and trusts are not able to consistently outperform the market. 1999 Elsevier Science Inc. All rights reserved.
JEL classification:G14
Keywords:Unit trusts; Performance; Market efficiency
1. Introduction
A major trend in institutional investment management over the past 15 years has been the growth of funds that invest internationally. This is due to financial liberaliza-tion in many of the world financial markets and increasing capital market integraliberaliza-tion. International portfolio investment by UK unit trusts1expanded rapidly in the 1980s
because of the abolition of exchange controls by the Conservative government in 1979. The United States has proved to be one of the most popular sectors of international investments by UK unit trusts. However, there is little empirical evidence on how unit trusts with international objectives have performed.
* Corresponding author. Tel.:144-141-331-3796; fax:144-141-331-3171.
E-mail address: [email protected] (J. Fletcher)
A number of studies have examined the performance of US mutual funds. One of the first major studies was by Jensen (1968). Jensen found that on average US mutual funds underperformed passive combinations of the risk free asset and the Standard and Poor (S&P) 500 index as the market proxy. Also, the underperformance could be attributed to expenses. Ippolito (1989) found over a later period than Jensen (1968) that mutual funds were able to generate positive abnormal returns using the S&P 500 index as the benchmark and that expenses did not hurt performance. However Elton et al. (1993) showed that Ippolito’s (1989) results are sensitive to the fact that the S& P 500 excludes asset categories invested by mutual funds, for example small stocks. Using a three index model, Elton et al. (1993) found negative abnormal returns for funds and that expenses have a negative impact on performance. This is confirmed in subsequent studies by Carhart (1997a, 1997b). This paper considers whether the performance of UK unit trusts that invest in North America is different from that observed for US mutual funds.
This article addresses three main issues. The first is whether trusts exhibit superior performance. The second issue is the relationship between performance and various trust characteristics, for example size and expenses, while the final issue relates to the predictability of trust performance. The performance of the trusts is estimated using both the unconditional Jensen (1968) performance measure and the conditional Jensen measure developed by Ferson and Schadt (1996), which takes account of the role of conditioning information. Ferson and Schadt (1996) found that using conditional measures tended to improve performance inferences for US mutual funds.
The main findings of the article are consistent with the view of market efficiency. These are that trusts do not have access on average to private information, higher expenses tend not to lead to better performance, and there is no evidence of any significant predictability in performance.
The article is organized as follows. The following section explains how performance is measured. Section 3 describes the data and benchmarks used in the performance tests. Section 4 presents the empirical results of unit trust performance. Section 5 contains concluding comments.
2. Performance evaluation
The performance evaluation of unit trusts uses both the Jensen (1968) measure and the conditional Jensen measure of Ferson and Schadt (1996). The Jensen measure can be estimated from the following regression model [Eq. (1)]:
rit5 ai1
o
Kj51
bijrjt 1 eit (1)
hypothesis of no performance ability is thatai50.2A positiveaiis usually interpreted as a measure of superior performance and a negativeaias reflecting poor performance. The Jensen measure can be viewed as an unconditional performance measure.
Recent work on performance evaluation has started to develop measures that take account of the conditioning information used by investors in setting prices. Conditional measures allow the asset betas and factor risk premiums to vary through time. Ferson and Schadt (1996) use both the Capital Asset Pricing Model (CAPM) and Arbitrage Pricing Theory (APT) models to develop linear conditional performance measures. They assume that prices in securities markets reflect publicly available information, i.e., semi-strong form efficiency. In addition, the portfolio beta of the fund is assumed to be a linear function of the information variables assumed to be used by investors. Ferson and Schadt (1996) show that if the conditional CAPM is valid then the conditional Jensen measure can be estimated from the following regression:
rit5 ai1 girpt 1 gilZl,t21 rpt1. . . . 1 giLZL,t21rpt1uit (2)
wheregiis the average conditional beta of the trust andgi1togiL are the coefficients of how the portfolio beta responds to information variables, z1,t21, . . . ,zL,t21 are the
values of theLinformation variables (demeaned) at timet21 andaiis the conditional Jensen measure. The products of the benchmark excess return and information vari-ables capture the covariance between the conditional factor risk premium and the conditional beta.
The null hypothesis of no performance ability is thatai50. Superior performance is measured byai.0. The conditionalaimplies that superior performance can only be generated by portfolio managers if they use more information than is publicly available. Eq. (2) can be extended to include a conditional APT framework. In an APT framework, the excess returns of the trust are regressed on a constant, the excess returns on the factor portfolios and each factor portfolio multiplied by each information variable.
3. Data, sample of trusts, and benchmarks
This study examines the performance of a sample of 85 UK American unit trusts from January 1985 through December 1996. The sample includes all trusts that were identified in the 1985 Unit Trust Yearbook and which had a North American invest-ment objective. Only those trusts that invested 70% or more in the US were included in the sample. The history of the 85 trusts was tracked over the whole time period. No survivorship requirements were imposed on the trusts.3 Fifty of the trusts had
continuous return data. Transfers of unit trusts and name changes were treated as a continuation of the original trust. When a trust is taken over, this was treated as a termination.
The monthly returns of the trusts were calculated from the beginning of month offer prices (collected from Money Management and Datastream International4), and
Rit 5ln[(Pit111Dit)/Pit)] (3)
wherePitis the offer price of trust iat the start of montht,Pit11is the offer price at
the start of montht11, andDitis the gross dividend paid (in the ex-dividend month) on trustiin periodt.This assumes that dividends are re-invested at the month end. The offer price of the trust includes the initial (load) charge5of the trust, stamp duty,
and brokerage fees. Adjustments are also made for the accrued annual management fee not yet paid. As a result, the return series of the trusts can be viewed approximately as gross of the load charge and trading costs but net of the management charge.6
All returns in this study are computed in US dollars and are continuously com-pounded returns. The monthly return on a 13-week US Treasury Bill (obtained from Datastream) is used as the risk-free return chosen because of data availability. In addition to monthly returns, various trust characteristics were collected from the 1985 Unit Trust Yearbook. This included the market value, load charge, annual charge, and the proportion invested in the US at the beginning of 1985 for the trusts.
The North American investment category includes trusts with different investment styles. The Unit Trust Yearbook does not further classify the North American trusts into these styles. Instead a brief aim of the trust is included. An approximate way to deal with the different objectives is to infer the objective of the trust from these brief statements. Using these statements the trusts are divided into four categories.
1. Growth—aim is long-term capital growth. 2. Income—aim is to maximize yield.
3. Special Situations/Smaller Companies—aim is long-term capital growth through investing in these types of companies.
4. General (Unspecified)—aim is a mixture of capital growth and income or there is no other information provided by the Yearbook other than the North American classification.
The majority of trusts within the sample appear to be trusts with a Growth objective, with very few having an Income objective. Fifty of the trusts were assigned to group 1, six to group 2, fifteen to group 3, and fourteen to group 4. Empirical results in the next section suggest that these classifications are reasonably informative. Table 1 reports descriptive data for the trusts. This includes the mean excess return, load charge, annual charge, and size for the whole sample of trusts and for the four investment objective groups.
Table 1 shows that the mean excess return of trusts across the different objectives ranges between 0.412% (Special Situations/Small Companies) and 0.685% (Income). The lower return of the Special Situations/Small Companies reflects the poorer perfor-mance of small companies over this time period. The average annual charge was just below 1%, and average load charge was just below 5%.
Table 1
Descriptive Statistics of Trusts
Special Situations
All Growth Income Small Companies General
N 85 50 6 15 14
Excess return 0.5927 0.5118 0.685 0.4117 0.4518
Load 4.738 4.785 5.1667 5.0667 4.036
Annual 0.922 0.935 0.771 0.8833 0.982
Size 17.14 16.77 10 19.33 19.16
The table includes the mean excess return (%), average annual charge (%), average load charge (%), and average market value (£m) at the start of 1985 for the whole sample of trusts and the four investment objectives (Growth, Income, Special Situations/Small Companies, and General). The number of trusts (N) within each investment objective is also included.
index (obtained from BARRA’s Internet site), and the excess return on the Datastream US government bond index. This takes account of the fact that some trusts invest in asset categories not included in the S&P 500. This will be referred to as the 3-Factor model.
The conditional measures of performance are computed relative to the benchmark excess returns and the products of the benchmark excess returns and the information variables. The following information variables were chosen because they have been found to be important in predicting US stock returns (e.g., Keim & Stambaugh, 1986; Fama & French, 1988). The information variables (collected from Datastream) are:
1. Monthly return on 13-week/tender US Treasury Bills. 2. Dividend yield on the S&P 500 index.
3. Difference between the monthly annualized yield of US 10-year Treasury bonds and yield on 13-week Treasury Bills.
4. January dummy, which equals 1 in the month of January and 0 otherwise.
4. UK American unit trust performance
4.1. Overall trust performance
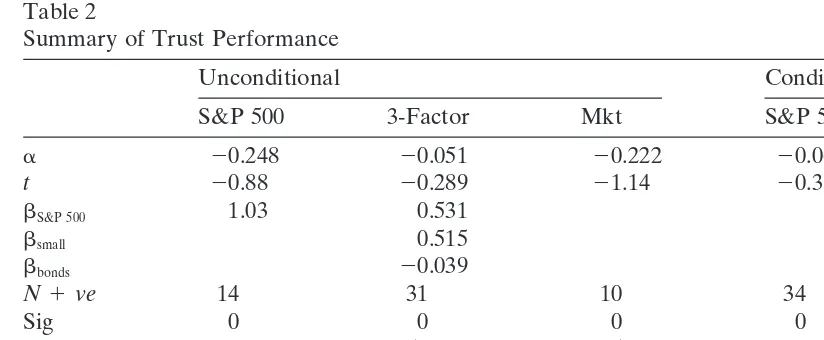
Table 2
Summary of Trust Performance
Unconditional Conditional
S&P 500 3-Factor Mkt S&P 500 3-Factor
a 20.248 20.051 20.222 20.065 0.0069
t 20.88 20.289 21.14 20.3 0.05
bS&P 500 1.03 0.531
bsmall 0.515
bbonds 20.039
N1ve 14 31 10 34 40
Sig 0 0 0 0 2
N2ve 71 54 75 46 40
Sig 0 0 4 0 0
Bonf1 1 1 1 1 0.475
Wald 50 62
Bonf2 0.01 0.01
The performance of the trusts is evaluated from January 1985 and December 1996 relative to two benchmark portfolios (S&P 500 and three index model [3-Factor]) using the unconditional Jensen (1968) measure and the conditonal Ferson and Schadt (1996) measure. Performance is also calculated using the market adjusted returns (Mkt). The first three columns refer to the unconditional measures and the final two columns to the conditional measures. The table includes the abnormal performance (witht
statistic) and the beta coefficients for the two unconditional models for the equally weighted portfolio of all trusts. It also gives the number of trusts with either positive or negative performance and how many are statistically significant at the 5% level. The performance numbers are % monthly. The Bonf1
is the Bonferronipvalue of the joint test of whether the performance across trusts are jointly equal to zero. The final two rows report the number of trusts with a significant Wald test at 5%, which rejects the hypothesis of constant conditional betas. The Bonf2pvalue is the Bonferronipvalue of whether
the conditional betas are constant across trusts. The test statistics are corrected for heteroskedasticity using White (1980).
Table 2 reports summary statistics of trust performance. It includes the abnormal performance and t statistic for the equally weighted portfolio of trusts. The t test examines the hypothesis that the abnormal performance of the equally weighted portfolio of trusts equals 0. The unconditional betas are reported for both benchmark portfolios for the equally weighted portfolio of trusts. Table 2 also contains the number of trusts with positive and negative performance and those that are statistically significant at 5%. To ensure a sufficient number of observations to estimate the conditional measures of performance, a requirement that the trusts have a minimum of 2 years monthly return observations was imposed. This implies that the conditional measures could only be estimated for 80 trusts. The Bonferroni p value provides a joint test of the hypothesis that the performance of the trusts are jointly equal to 0.7
is the Bonferronipvalue of the joint tests that the slope coefficients across trusts are jointly equal to 0. The test statistics have been corrected for heteroskedasticity using White (1980).
The evidence in Table 2 suggests that unit trusts exhibit abnormal performance that is not significantly different from 0 (at 5% significance level) relative to the five models. The average abnormal returns of the trusts for the unconditional measures on an annualized basis are22.976% (S&P 500), 20.612% (3-Factor), and 22.664% (Mkt). The majority of individual trusts exhibit negative abnormal performance with the unconditional measures. However, few are statistically significant at 5%.
An inspection of the betas in the three index model suggests that smaller companies are an important asset category for unit trusts on average. This is perhaps not surprising since the majority of trusts within the sample are growth oriented. It also explains the large numerical difference in the abnormal performance between the three index model and the S&P 500. Smaller companies tended to underperform the S&P 500 over this period. This is consistent with the findings of Elton et al. (1993) and Gruber (1996), which included asset categories in the benchmark in which fund managers invest.
Using the conditional measures, the annualized average abnormal performance are
20.780% (S&P 500) and 0.828% (3-Factor). The average performance of the trusts tends to improve when moving to conditional measures. However, the trusts are not able to generate superior abnormal returns. The number of trusts with positive abnor-mal performance also increases. With the 3-Factor model, 50% of the trusts have positive performance; however, only two trusts differ statistically from 0 at traditional levels. This does not change the inferences that unit trusts on average or individually possess superior information. In addition, the Bonferronipvalues are unable to reject the hypothesis that thea’s are jointly equal to 0.
The Waldx2test, reported in the second to last row, suggests that the assumption of constant conditional beta can be rejected for the majority of trusts. The hypothesis of constant conditional betas can be rejected for 50 trusts for the S&P 500 and 62 trusts for the 3-Factor model. Also, the Bonferronipvalue rejects the hypothesis that all trusts have constant conditional betas.
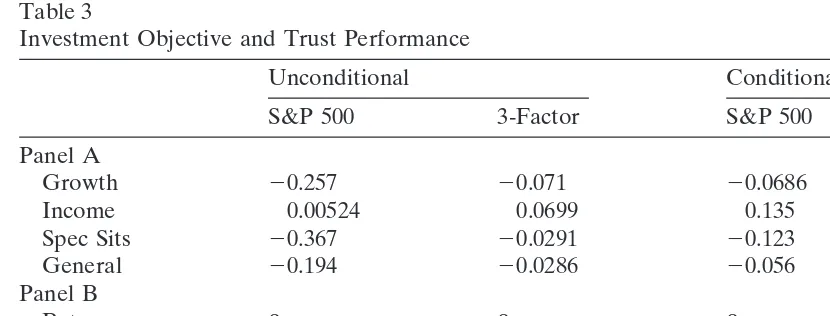
Table 3 explores the relationship between the abnormal performance of equally weighted portfolios of trusts grouped according to investment objective. The table includes the abnormal performance of each portfolio withtstatistics. In addition, the beta coefficients for the unconditional measures are reported.
Table 3 shows that the portfolios of the Smaller Companies/Special Situations and Growth trusts register the poorest abnormal performance and that the Income portfolio register the best abnormal returns. However, none of the abnormal returns are statisti-cally significantly different from 0 at the 5% significance level. In addition, the Bonfer-ronipvalue (unreported) is unable to reject the hypothesis that the abnormal perfor-mance across the four portfolios are jointly equal to 0. This suggests that there is no significant relationship between investment objective and abnormal performance.
Table 3
Investment Objective and Trust Performance
Unconditional Conditional
S&P 500 3-Factor S&P 500 3-Factor
Panel A
Growth 20.257 20.071 20.0686 20.026
Income 0.00524 0.0699 0.135 0.097
Spec Sits 20.367 20.0291 20.123 0.055
General 20.194 20.0286 20.056 0.048
Panel B
Betas bS&P 500 bS&P 500 bsmall bbonds
Growth 1.05 0.583 0.479 20.049
Income 0.702 0.407 0.278 0.185
Spec Sits 1.16 0.298 0.886 20.057
General 0.98 0.578 0.416 20.058
Panel A of the table includes the abnormal performance of equally weighted portfolios of trusts sorted according to the investment objective of the trust. The investment objectives are Growth, Income, Special Situations/Small Companies, and General. The performance of the trusts is evaluated from January 1985 and December 1996 relative to two benchmark portfolios (S&P 500 and three index model [3-Factor]) using the unconditional Jensen (1968) measure and the conditional Ferson and Schadt (1996) measure. The first two columns refer to the unconditional measures, and the second two columns refer to the conditional measures for the four categories of trusts. Panel B of the table includes the betas for the two unconditional measures. The first column is the beta on the S&P 500 model and the other columns are the betas on the 3-Factor model.
S&P 500 and small stock index than the Income portfolio. The Small Companies/ Special Situations has the largest exposure to the small stock index. The Income portfolio has a lower exposure to these two indices and higher to the bond index. The greater exposure of the Growth and Small Companies portfolios to the small stock index explains the poorer abnormal performance of these trusts to the S&P 500 since small companies have performed poorly over this period.
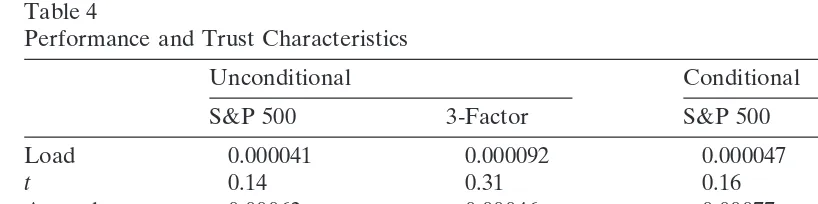
4.1. Trust characteristics and performance
The previous section found that unit trusts are unable to generate superior abnormal returns on average. This section examines the relationship between various trust characteristics and abnormal performance. Three factors are considered:
1. Size of trust
2. Initial (load) charge 3. Annual charge
Table 4
Performance and Trust Characteristics
Unconditional Conditional
S&P 500 3-Factor S&P 500 3-Factor
Load 0.000041 0.000092 0.000047 20.00015
t 0.14 0.31 0.16 20.58
Annual 20.00063 20.00046 20.00077 20.00019
t 20.5 20.37 20.61 20.16
Size 20.00000005 20.0000079 20.0000076 20.000012
t 20.055 21.08 20.93 21.78
Monthly cross-sectional regressions are estimated of the abnormal returns of the trusts on a constant and the trust characteristics of load charge, annual charge, and size between January 1985 and December 1996. The performance of the trusts is evaluated relative to two benchmark portfolios (S&P 500 and three index model [3-Factor]) using the unconditional Jensen (1968) measure and the conditional Ferson and Schadt (1996) measure. The table includes the mean of the monthly slope coefficients and the Fama and MacBethtstatistics. The first two columns refer to the unconditional measures and the second two columns to the conditional measures.
there should no relationship between annual charge and performance if markets are efficient. This implies that net abnormal returns will be lower for trusts with higher annual charges because of the higher trading costs. An alternative view is advanced by Grossman and Stiglitz (1980), where informed investors are able to generate higher abnormal returns to compensate for higher charges.
A number of US mutual fund studies have examined the relationship between mutual fund characteristics and performance. Ippolito (1989) found no relationship between expenses and performance using net returns. Grinblatt and Titman (1994) observed a positive relationship between performance and the turnover of the fund. However, Elton et al. (1993) discovered a negative relationship between performance and expense ratios. This was confirmed by Malkiel (1995). Carhart (1997a) found that expenses and turnover have a negative impact on performance, and Carhart (1997b) suggested that the positive findings in Grinblatt and Titman (1994) are likely to be due to survivorship bias.
The relationship between trust characteristics and performance is evaluated using cross-sectional regressions. Each month cross-sectional regressions are estimated from the performance measures (a plus monthly residual) on a constant and the trust characteristics. The mean of the monthly coefficients are taken as the final estimate and t statistics are calculated as in Fama and MacBeth (1973). Table 4 reports the slope coefficients and Fama and MacBeth (1973)tstatistics for each benchmark.
Table 4 shows that each of the trust characteristics is unrelated to the abnormal performance of the trusts. This is the case regardless of the benchmark used. The most interesting result is the absence of a significant relationship between abnormal performance and either the load or annual charge. This is consistent with the view that trusts with higher charges tend to be unable to deliver superior performance, consistent with Elton et al. (1993) and Malkiel (1995).
be-tween abnormal performance and the proportion invested in the US. The trusts were assigned to three groups according to the proportion invested in the US recorded in the 1985 Unit Trust Yearbook. The groups were greater than 95%, between 85–95%. and between 70–85%. Each trust was given a dummy variable depending on which group they were in, and cross-sectional regressions were estimated as before. None of the groups had a significant relationship with abnormal performance, which suggests performance is unrelated to the proportion invested in the US.
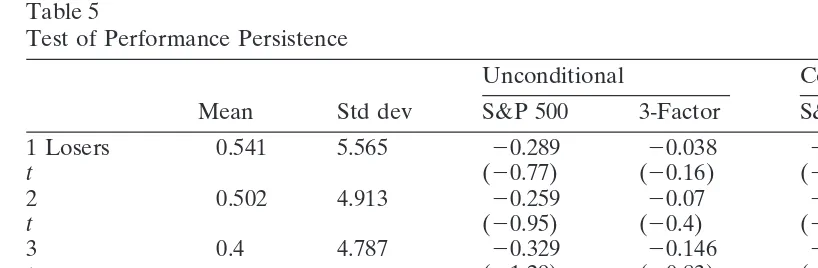
4.3. Predictability of trust performance
This section examines whether trust performance is predictable over time. If perfor-mance is partly predictable, then it should provide some justification for the usefulness of performance league tables. Recent research has shown that mutual fund perfor-mance does exhibit some persistence (see Hendricks et al., 1993; Brown and Goetz-mann, 1995; Elton et al., 1996). Evidence in Carhart (1997a) suggests that most of the positive persistence in US fund raw returns and risk-adjusted returns can be explained by a failure of the performance measure to adjust for momentum trading strategies and differences in expense ratios and transactions costs.
The performance persistence of the trusts is examined with a simple test. At the start of each year all trusts are ranked on the basis of their cumulative excess returns over the previous year and grouped into quartile portfolios. Equally weighted monthly excess returns are then estimated over the next year. All trusts that exist at the start of the year are included in the portfolios. This is repeated each year. Table 5 reports the abnormal performance of the four quartile portfolios and the portfolio that is long in the Winners portfolio and short in the Losers portfolio evaluated between January 1986 to December 1996 relative to each benchmark portfolio.
Table 5 reveals no evidence that there is persistence in performance for this sample of trusts. The annualized mean difference in excess return between the top and bottom quartiles is only 20.696%. In addition, the abnormal returns between the top and bottom quartiles is fairly small except for the 3-Factor conditional measure. The Winners portfolio earns slightly more than the Losers portfolio for the unconditional measures and less with the conditional measures. However the abnormal performance is not statistically significant at traditional levels. This is consistent with market effi-ciency that the past performance of a trust is unable to generate superior abnormal returns.
5. Conclusions
Table 5
Test of Performance Persistence
Unconditional Conditional
Mean Std dev S&P 500 3-Factor S&P 500 3-Factor
1 Losers 0.541 5.565 20.289 20.038 20.032 0.13
t (20.77) (20.16) (20.13) (0.75)
2 0.502 4.913 20.259 20.07 20.081 0.0079
t (20.95) (20.4) (20.43) (0.06)
3 0.4 4.787 20.329 20.146 20.199 20.168
t (21.29) (20.83) (20.96) (21.07)
4 Winners 0.482 5.112 20.262 20.016 20.11 20.052
t (20.87) (20.09) (20.44) (20.28)
4-1 20.058 1.641 0.028 0.022 20.078 20.182
t (0.16) (0.14) (20.61) (21.39)
At the start of each year between 1986 and 1996, trusts are ranked on the basis of their prior year cumulative excess return and grouped into quartile portfolios. The performance of the portfolios is evaluated between January 1986 and December 1996. The table includes the mean excess return (% monthly), standard deviation and abnormal performance for the four quartile portfolios, and a portfolio that is long in the Winners portfolio and short in the Losers portfolio. The performance of the trusts is evaluated relative to two benchmark portfolios (S&P 500 and three index model [3-Factor]) using the unconditional Jensen (1968) measure and the conditional Ferson and Schadt (1996) measure. The t
statistics have been corrected for heteroskedasticity using White (1980). The third and fourth columns refer to the unconditional measures and the fifth and sixth columns refer to the conditional measures.
The results in this study are consistent with many studies of US mutual funds. It suggests that UK trust managers exhibit similar performance skills to US mutual fund managers. In addition, the results are consistent with market efficiency. These are that trusts on average do not have access to private information, expenses tend to hurt performance, and there is no evidence of trusts being able to consistently achieve superior performance.
Acknowledgments
Helpful comments have been received from two anonymous reviewers and partici-pants at the 1996 British Accounting Association (Scotland) conference and the 1996 Southern Finance Association meeting.
Notes
1. UK unit trusts are equivalent to open-ended US mutual funds.
2. A useful interpretation of the Jensen measure is that it gives the extra return earned by the fund compared to a passive combination of the risk-free asset and the benchmark portfolio(s) with the same risk as the fund (see Elton & Gruber, 1995). 3. Brown et al. (1992) illustrate the impact that survivorship bias can have on
4. Datastream is an online data service that provides a wide range of information on macroeconomic variables, stock market data, and company accounting information. 5. In contrast to the US, nearly all UK unit trusts have a load charge.
6. The problem with the return measure is that it may not correctly capture the manager’s performance since returns are not net of trading costs. However this is the only data available.
7. The Bonferronip value is a conservative test which places an upper bound on the pvalue of a joint test. It equals Ntimes the smallest of the Nindividual p
values, where Nis the number of trusts.
References
Brown, S. J., & Goetzmann, W. N. (1995). Performance persistence.Journal of Finance 50, 679–698. Brown, S. J., Goetzmann, W. N., Ibbotson, R. G., & Ross, S. A. (1992). Survivorship bias in performance
studies.Review of Financial Studies 5, 553–580.
Carhart, M. (1997a). Persistence in mutual fund performance.Journal of Finance 52, 57–82.
Carhart, M. (1997b). Mutual fund survivorship. Unpublished manuscript, University of Southern California. Elton, E. J., Gruber, M.J., Das, S., & Hlavka, M.(1993). Efficiency with costly information: A
reinterpreta-tion of the evidence.Review of Financial Studies, 6, 1–22.
Elton, E.J., & Gruber, M.J.(1995).Modern Portfolio Theory and Investment Analysis.Wiley, 5th Edition. Elton, E.J., Gruber, M. J., & Blake, C. R. (1996). The persistence of risk-adjusted mutual fund
perfor-mance.Journal of Business 9, 133–157.
Fama, E. F., & French, K. (1988). Dividend yields and expected stock returns.Journal of Financial Economics 22, 3–25.
Fama, E. F., & MacBeth, J. D. (1973). Risk, return and equilibrium: empirical tests.Journal of Political Economy 81, 607–636.
Ferson, W. E., & Schadt, R. W. (1996). Measuring fund strategy and performance in changing economic conditions.Journal of Finance 51, 425–461.
Grinblatt, M., & Titman, S. (1994). A study of monthly mutual funds returns and performance evaluation techniques.Journal of Financial and Quantitative Analysis 29, 419–444.
Grossman, S., & Stiglitz, J. (1980). On the impossibility of informationally efficient markets.American Economic Review 70,393–408.
Gruber, M. (1996). Another puzzle: the growth in actively managed mutual funds.Journal of Finance 51, 783–810.
Hendricks, D., Patel, J., & Zeckhauser, R. (1993). Hot hands in mutual funds: short-run persistence of performance in relative performance 1974–1988.Journal of Finance 48, 93–130.
Ippolito, R. A. (1989). Efficiency with costly information: a study of mutual fund performance.Quarterly Journal of Economics 104, 1–23.
Jensen, M. C. (1968). The performance of mutual funds in the period 1945–1964.Journal of Finance 23, 389–416.
Keim, D. B., & Stambaugh, R. F. (1986). Predicting return in the bond and stock market.Journal of Financial Economics 17, 357–390.
Malkiel, B. G. (1995). Returns from investing in equity mutual funds 1971 to 1991.Journal of Finance 50, 549–572.