CLASSIFICATION ACCURACY INCREASE USING MULTISENSOR DATA FUSION
Aliaksei Makarau, Gintautas Palubinskas, and Peter Reinartz
German Aerospace Center (DLR)
German Remote Sensing Data Center (DFD) bzw. Remote Sensing Technology Institute (IMF) 82234 Oberpfaffenhofen, Germany
{aliaksei.makarau, gintautas.palubinskas, peter.reinartz}@dlr.de
Commission VII/6
KEY WORDS:Multispectral image, VNIR data, WorldView-2, SAR, TerraSAR-X, data fusion, classification, very high resolution
ABSTRACT:
The practical use of very high resolution visible and near-infrared (VNIR) data is still growing (IKONOS, Quickbird, GeoEye-1, etc.) but for classification purposes the number of bands is limited in comparison to full spectral imaging. These limitations may lead to the confusion of materials such as different roofs, pavements, roads, etc. and therefore may provide wrong interpretation and use of clas-sification products. Employment of hyperspectral data is another solution, but their low spatial resolution (comparing to multispectral data) restrict their usage for many applications. Another improvement can be achieved by fusion approaches of multisensory data since this may increase the quality of scene classification. Integration of Synthetic Aperture Radar (SAR) and optical data is widely per-formed for automatic classification, interpretation, and change detection. In this paper we present an approach for very high resolution SAR and multispectral data fusion for automatic classification in urban areas. Single polarization TerraSAR-X (SpotLight mode) and multispectral data are integrated using the INFOFUSE framework, consisting of feature extraction (information fission), unsupervised clustering (data representation on a finite domain and dimensionality reduction), and data aggregation (Bayesian or neural network). This framework allows a relevant way of multisource data combination following consensus theory. The classification is not influenced by the limitations of dimensionality, and the calculation complexity primarily depends on the step of dimensionality reduction. Fusion of single polarization TerraSAR-X, WorldView-2 (VNIR or full set), and Digital Surface Model (DSM) data allow for different types of urban objects to be classified into predefined classes of interest with increased accuracy. The comparison to classification results of WorldView-2 multispectral data (8 spectral bands) is provided and the numerical evaluation of the method in comparison to other established methods illustrates the advantage in the classification accuracy for many classes such as buildings, low vegetation, sport objects, forest, roads, rail roads, etc.
1 INTRODUCTION
AVAILABILITY of high and very high spatial resolution multi-sensory data opens new perspectives for processing, recognition and decision making in urban areas containing a variety of ob-jects and structures. Nevertheless, high resolution data is repre-sented by optical sensors with limited spectral resolution. For example, the well known satellites providing high resolution data (IKONOS, Quickbird, GeoEye-1) acquire multispectral data only in VNIR range, except the new WorldView-2 satellite. Limited spectral range covered by the multispectral sensors does not al-low to obtain high accuracy of thematic classification as well as relatively high number of classes. Employment of hyperspectral data is not a solution because of the low spatial resolution of most spaceborne sensors. Data fusion is employed to overcome this limitation on spatial resolution. Different modalities and differ-ent types of digital data (e.g. multispectral, SAR, Digital Eleve-tion Model (DEM), Geographic informaEleve-tion system (GIS), vector maps, etc.) allow significant increase of the accuracy of auto-matic recognition and interpretation for urban areas only in the case when a correct fusion methodology is used.
A fusion methodology should properly deal with different statis-tics of input incommensurable multisensory data (e.g. optical and SAR). Several fusion methodologies following consensus theory (Benediktsson et al., 1997) were developed and successfully used (Pacifici et al., 2008, Fauvel et al., 2006, Rottensteiner et al., 2004) but still the number of thematic classes is low.
Pacifici et. al. (2008) developed the best fusion algorithm for 2007 GRSS Data Fusion Contest. The algorithm is based on
a neural network classification enhanced by preprocessing and postprocessing. Employment of 2 SAR images, 6 Landsat-5 spec-tral images, and 6 Landsat-7 specspec-tral images resulted in the clas-sification into 5 classes (City center, Residential area, Sparse build-ings, Water, Vegetation) with Kappa coefficient equal to 0.93.
Fauvel et. al. (2006) applied decision fusion (fuzzy decision rule) for classification of urban area. The overall accuracy of classifica-tion for 6 classes (Large buildings, Houses, Large roads, Streets, Open areas, and Shadows) is 75.7 %.
2 PROPOSED FUSION MODEL
Instead of continuous representation of data, a discrete represen-tation of the data on a finite domain is employed. Discrete repre-sentation is motivated by the fact that integration of incommensu-rable multisensory data with different nature and statistics could be difficult using conventional statistical methods. To overcome this difficulty, a kind of “discretization” of continuous data is em-ployed resulting in data with several possible states (e.g. multi-nomial distribution, see (Aksoy et al., 2005)). Neural network, Bayesian network, or discrete graphical models are employed to integrate the multisensory data with discrete states.
The fusion framework consists of three main steps:
These features are expected to characterize different proper-ties of structures and objects separately in each data source. After feature extraction a large amount of redundant infor-mation is obtained.
2. Feature representation on a finite domain.The aim of this stage is to represent a feature on a finite predefined domain. A kind of feature value range “quantization” is made. This representation can be made using several ways. Unsuper-vised clustering allows to make this task. Here, objects with similar properties are grouped and the feature dimensional-ity is reduced. Unsupervised clustering (k-means, entropy basedk-means (Palubinskas, 1999)) is used.
3. Fusion and classification of coded featuresis performed using a neural network (multilayer perceptron). Training of the neural network is performed according to supervisely selected classes and training areas. Configured neural net-work is used for fusion and classification of clustered input features.
2.1 Employed data
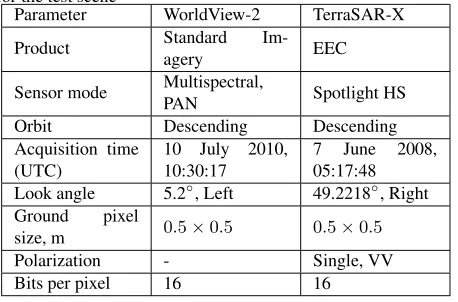
The optical and SAR data were orthorectified (SRTM 30m DEM) and distortions introduced by terrain are decreased. Orthorecti-fied WorldView-2 (WV-2) and SpotLight Level-1B Product Terra-SAR-X (TSX) data were used. Detailed description of employed data is given in Table 1. WV-2 multispectral data were pan-sharpened by the General Fusion Framework method (Palubin-skas and Reinartz, 2011). Registration of optical and radar data was made in ENVI using manual selection of control points. In more complicated cases other registration methods should be em-ployed, e.g. (Suri and Reinartz, 2010). Detailed Digital Surface Model (DSM) of urban scene is generated using the Semiglobal Matching algorithm if Worldview-2 stereo pairs or triplets with small convergence angles (less then 20 degrees) are available.
Table 1: Parameters of the WorldView-2 and TerraSAR-X data for the test scene
Bits per pixel 16 16
2.2 Feature extraction
Specific feature types should be extracted to make exhausting de-scription of data. For example, a multispectral image can be used for extraction of spectral information, Difference Vegetation In-dex (DVI) inIn-dexes, while TSX data is more suitable for extraction of texture features (Co-occurence, Gabor, Laws, etc.). For some data sources (e.g. DEM) feature extraction is not carried out and the data directly represented on the domain. The cardinality of the domain should be appropriately defined for different features (multispectral, textural, DEM, etc.).
TSX image is employed for characterization of objects surface structure and textural properties (e.g. grass land versus football field, bare soil versus construction sites, etc.). Multispectral data
is also used for textural feature extraction and for providing spec-tral information on the objects of a scene. In our experiment Ga-bor features (Daugman, 1988) were calculated on TSX data and on Red color channel from WV-2 data. A bank of gabor wavelets consists of 48 filters (6 orientations (0, π/6, π/3, π/2,2
3π, 5 6π), 4 different periods of filter’s sine component (π/4, π/2,3
4π, π), and 2 different sigma values (σ= 1,4)), recursive implementa-tion of Gabor filtering is employed (Young et al., 2002).
The number of clusters for feature representation on finite set was equal to 50 (used for representation of all features).
2.3 Fusion strategies and classification
One of the main interests is to compare the influence of data fu-sion for classification accuracy, and to compare fufu-sion with single sensor classification results. Availability of WV-2 multispectral data allows to compare fusion of multisensory data to classifica-tion result of VNIR or WV-2 multispectral data. Therefore, the following combinations of multisensory and single-sensor data can be created:
1. WV-2 VNIR (single sensor, 4 features (spectral bands)), 2. WV-2 (single sensor, 8 features (spectral bands)), 3. VNIR + TSX Texture + Optical Texture, 4. WV-2 + DSM (9 features),
5. TSX Texture + Optical Texture + DSM (97 features), 6. WV-2 + TSX Texture + Optical Texture (104 features), 7. WV-2 + TSX Texture + Optical Texture + DSM (105
fea-tures).
VNIR data were taken from WV-2 multispectral image (bands 2,3,5,6). This range was taken since most of the very high reso-lution spaceborne sensors (e.g. IKONOS, Quickbird, GeoEye-1, etc.) acquire multispectral data in VNIR range.
Altogether, 23 classes were defined: 1. Water; 2. Forest/Trees; 3. Grass/Low vegetation; 4. Bare soil; 5. Construction site; 6. Swimming pool; 7. Asphalt road; 8. Concrete road; 9. Football field; 10. Tennis field; 11. Green house; 12. Rail road; 13. Tram line; 14. Cemetery; 15. Parking/car; 16. Shadow; 17. Red roofing tiles; 18. Grey roofing tiles; 19. Dark roofing tiles; 20. Roofing concrete; 21. Vegetation roof; 22. Zinc roof; 23. Roofing copper.
Selection of training and test regions was made manually accord-ing to available ground truth data. It should be noted that the validated ground truth is limited by the size (e.g. vector data on classes 4, 5, 6, 11, 17-23 is available only for a small number of objects and buildings). The ground truth for the area under in-vestigation was proofed by the ATKIS vector map provided by Bavarian State Agency for Surveying and Geoinformation (Lan-desamt f¨ur Vermessung und Geoinformation). Vector data on the materials available in the scene was created and provided by Dr. Wieke Heldens (Heldens et al., 2009).
3 RESULTS AND DISCUSSION
104, or 105 features, 9 neurons for 8 features), 50 clusters for each feature,k-means clustering was employed. For single sen-sor data (VNIR, WV-2, WV-2+DSM) fusion and classification using INFOFUSE 100 clusters were used for each feature. The ML was run in the ENVI software.
Fusion and classification results for different combinations of the data and features as well as classification using single sensor data are given. The best accuracy of the classification provided by IN-FOFUSE and NN methods on the combination of the multispec-tral data, Gabor texture features are acquired both on the TSX and optical band and the DSM data.
Table 2: Classification accuracy using different methods together with the proposed approach. OVA – overall accuracy, Kappa – Kohen’s Kappa. Best result is marked in bold
Method Employed features OVA, % Kappa
ML VNIR (4) 70.73 0.6846
ML WV-2 (8) 77.11 0.7530
ML VNIR+Texture (100) 72.11 0.6975
ML WV-2+DSM (9) 85.48 0.8409
ML Texture+DSM (97) 60.57 0.5666 ML WV-2+Texture (104) 81.42 0.7932 ML WV-2+Texture+DSM (105) 82.19 0.8019
NN VNIR (4) 68.59 0.6609
NN WV-2 (8) 73.88 0.7182
NN VNIR+Texture (100) 75.29 0.7316
NN WV-2+DSM (9) 85.65 0.8426
NN Texture+DSM (97) 60.86 0.5643 NN WV-2+Texture (104) 82.64 0.8076 NN WV-2+Texture+DSM (105) 87.06 0.8566
INFOFUSE VNIR (4) 70.36 0.6779
INFOFUSE WV-2 (8) 71.90 0.6957
INFOFUSE VNIR+Texture (100) 77.01 0.7502 INFOFUSE WV-2+DSM (9) 75.96 0.7383 INFOFUSE Texture+DSM (97) 71.86 0.6906 INFOFUSE WV-2+Texture (104) 84.86 0.8358 INFOFUSE WV-2+Texture+DSM (105) 90.11 0.8907
Feature representation on a finite domain allows to convert in-commensurable features and data with different statistical proper-ties and distributions into one type of distribution (e.g. multinom-inal distribution (Aksoy et al., 2005)). Fusion of multisensory data using INFOFUSE based on a neural network (OVA=90.1092, Kappa=0.8907) allowed to obtain higher accuracy comparing to fusion and classification results obtained by the neural network with the same structure (OVA=87.0697, Kappa=0.8566). These high accuracies of classification can be explained that the val-idated ground truth is available only for limited small areas or objects (e.g. several buildings). Therefore in practice (having ground truth for larger area) the accuracy is expected to be less.
Low accuracies of the ML classification method may be caused that the ML classifier can not efficiently deal with different dis-tributions of the data and features, or the multisensor data is not classified in the way of consensus classification (Benediktsson et al., 1997). Low accuracy for classification of single source data by the INFOFUSE method (WV-2, 8 features) as well as fusion of WV-2+DSM data (9 features) can be caused since the size of the finite domain (i.e. the number of clusters) is low. Therefore a loss of information during clustering influences the accuracy compar-ing to the methods dealcompar-ing with original 11-bit scompar-ingle source data.
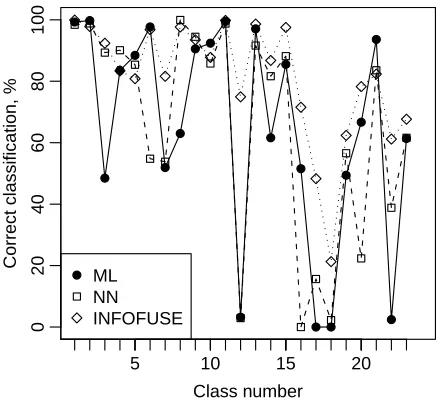
Figure 1 illustrates classification accuracy for the defined classes. Classification results (Table 2 and Figure 1) illustrate the
diffi-culty to obtain very high classification accuracy for the specifi-cally defined classes of buildings with different roofing materials (classes: 18. Grey roofing tiles and 19. Dark roofing tiles).
5 10 15 20
Figure 1: Class test accuracy for the WV-2+TSX Texture+Optical Texture+DSM data fusion and classification using the ML, NN, and INFOFUSE
Subscenes of a classification map (INFOFUSE; WV-2 multispec-tral+TSX Texture+Optical Texture+DSM) are presented in Fig-ures 2, 3, and 4.
Table 3 illustrates influence of a particular feature or sensor for proper separation of classes with similar spectral or textural prop-erties according to the fusion and classification strategy.
Table 3: Influence of data sources for classification of particular classes
Class 1 Class 2 Sensor or feature influence
Road Building DSM
Rail road/Tram
road Road TSX Texture
Rail road Tram road TSX Texture Bare soil Construction site TSX Texture
Football field Grass/Low vege-tation
TSX Texture, Multispectral
Parking/car Road Texture on opti-cal data
Cemetery Grass/Low
vege-tation TSX Texture
Green house Building TSX Texture, Multispectral
4 CONCLUSIONS
In this paper we present results on high resolution multisensory data fusion for classification. The developed method follows con-sensus theory rules for multisensory data fusion and allows to fuse and classify input data (Multispectral, SAR, and DSM) into extended number of classes.
(a)
(b)
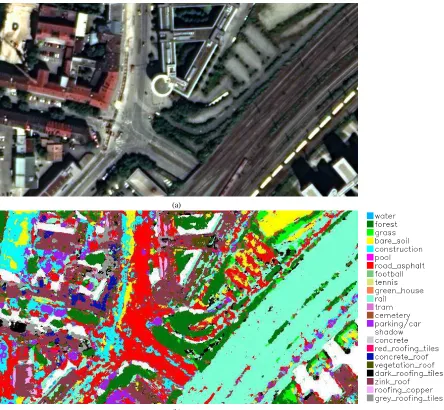
Figure 2: A region of the classification map (INFOFUSE): (a) visible range multispectral image (bands 5,3,2), (b) fusion and classifi-cation by INFOFUSE (this region contains several of the 23 classes)
(a) (b)
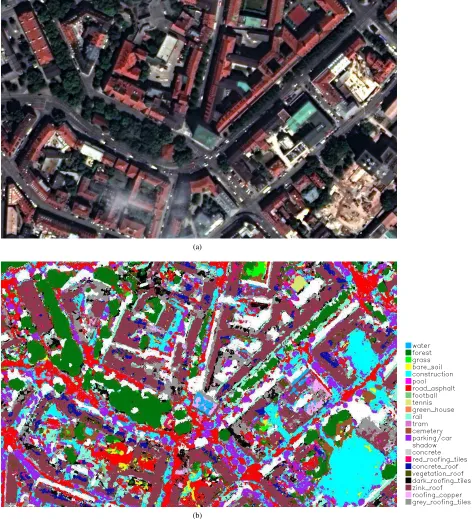
Figure 3: A region of the classification map (INFOFUSE): (a) visible range multispectral image (bands 5,3,2), (b) fusion and classifi-cation by INFOFUSE (this region contains several of the 23 classes)
on the step of feature representation using unsupervised cluster-ing. Representation of input features on a finite domain allows to properly employ multisensory data with different nature and
(a)
(b)
Figure 4: A region of the classification map (INFOFUSE): (a) visible range multispectral image (bands 5,3,2), (b) fusion and classifi-cation by INFOFUSE (this region contains several of the 23 classes)
SAR-X, and DSM data allows to obtain approx. 90% of overall accuracy with Kappa equal to approx. 0.89 for 23 classes of in-terest. Fusion of data acquired by a single sensor (e.g. DSM and multispectral) is not dependant on providers of other modalities, therefore it is possible to reduce data cost and waiting time.
A special acquisition model for SAR and optical data (Palubin-skas et al., 2010) will be employed in future work in order to extract the most of the available information from the observed area. The model is also going to be employed for class-specific change detection on single and multisensory data. More thor-ough validation of the method is going to be performed on the new available ground truth data for the test area.
ACKNOWLEDGEMENTS
This work was supported by the DLR-DAAD research grant (A /09/95629). We would like to thank European Space Imaging (EUSI) for provision of DigitalGlobe WorldView-2 data. Terra-SAR-X data were provided by DLR through the Science Projects MTH0505 and MTH0948.
REFERENCES
a visual grammar. IEEE Transactions on Geoscience and Remote Sensing 43(3), pp. 581–589.
Benediktsson, J., Sveinsson, J. and Swain, P., 1997. Hybrid con-sensus theoretic classification. IEEE TGRS 35(4), pp. 833–843.
Daugman, J., 1988. Complete discrete 2-d gabor transforms by neural networks for image analysis and compression. IEEE Transactions on Acoustics, Speech, and Signal Processing 36(7), pp. 1169–1179.
Fauvel, M., Chanussot, J. and Benediktsson, J. A., 2006. Deci-sion fuDeci-sion for the classification of urban remote sensing images. IEEE Transactions on Geoscience and Remote Sensing 44(10), pp. 2828–2838.
Heldens, W., Heiden, U., Bachmann, M., Esch, T., M¨uller, A. and Dech, S., 2009. Scaling issues in validation of abundance maps derived from hymap data of an urban area. In: 6th EARSeL SIG IS Workshop on Imaging Spectroscopy, Tel Aviv, Israel.
Pacifici, F., Del Frate, F., Emery, W., Gamba, P. and Chanussot, J., 2008. Urban mapping using coarse SAR and optical data: Out-come of the 2007 GRSS data fusion contest. IEEE Geoscience and Remote Sensing Letters 5(3), pp. 331–335.
Palubinskas, G., 1999. An unsupervised clustering method by en-tropy minimization. In: Maximum Enen-tropy and Bayesian Meth-ods, W. von der Linden et al., Eds., Kluwer Academic Publisher, pp. 327–334.
Palubinskas, G. and Datcu, M., 2008. Information fusion ap-proach for the data classification: an example for ERS-1/2 InSAR data. International Journal of Remote Sensing 29(16), pp. 4689– 4703.
Palubinskas, G. and Reinartz, P., 2011. Multi-resolution, multi-sensor image fusion: general fusion framework. In: JURSE 2011 - Joint Urban Remote Sensing Event, Munich, pp. 313–316.
Palubinskas, G., Reinartz, P. and Bamler, R., 2010. Image ac-quisition geometry analysis for the fusion of optical and radar remote sensing data. International Journal of Image and Data Fusion 1(3), pp. 271–282.
Rottensteiner, F., Trinder, J., Clode, S., Kubik, K. and Lovell, B., 2004. Building detection by Dempster-Shafer fusion of LIDAR data and multispectral aerial imagery. ICPR 2, pp. 339–342.
Suri, S. and Reinartz, P., 2010. Mutual-information-based reg-istration of TerraSAR-X and IKONOS imagery in urban areas. IEEE Transactions on Geoscience and Remote Sensing 48(2), pp. 939–949.
Young, I., van Vliet, L. and van Ginkel, M., 2002. Recursive Gabor filtering. IEEE Transactions on Signal Processing 50(11), pp. 2798–2805.