A study on variations of shoreline changes and temporal-spatial potentiality for cloud seeding at
Urumia Lake
R. Agha Taher a, M. Jafari b, M. Fallah c, A. Alavi d
a
MSc of GIS at Khaje Nasir Al-din Tousi University and expert at Geographic Organization, Tehran- [email protected]
b
MSc of GIS at University of Tehranand expert at Geographic Organization, Tehran- Iran- [email protected]
c
MSc of Remote Sensing & GIS at Science and Research Branch of Azad Islamic University and expert at Geographic Organization, Tehran- Iran- [email protected]
d MSc of GIS at Khaje Nasir Al-din Tousi University and expert at Geographic Organization, Tehran- Iran
KEY WORDS:Shoreline Changes, Neural Network, Urmia Lake, Landsat Satellite, Temporal- Spatial Potentiality Evaluation
ABSTRACT:
Protecting the living environment has become one of the greatest human concerns; sudden increase of population, industry and technology development, unrestrained over consumption of the citizens and climate changes, have all caused many problems for mankind. Shores are special zones that are in contact with three Atmosphere, Hydrosphere and Lithosphere environments of earth. Shore
lines are of the most important linear features of the earth’s surface which have an animated and alive nature. In this regard, optimized management of the shores and environmental protection for stable development require observing the shorelines and their variations. Protection of shorelines within appropriate time periods is of high importance for the purpose of optimized management of the shores. The twenty first century has been called the era of information explosion. A time that, through benefits of new technologies, information experts attempt to generate more and up to date information in various fields and to provide them for managers and decision makers in order to be considered for future planning and also to assist the planners to arrange and set a comprehensive plan.
Aerial images and remote sensing technology are economic methods to acquire the required data. Such met hods are free from common time and place limitations in survey based methods. Among remote sensing data, the ones acquired from optical images have several benefits which include low cost, interpretation simplicity and ease of access. That is why most of t he researches concerning extraction of shorelines are practiced using optical images. On the other hand, wide range coverage of satellite images along with rapid access to them caused these images to be used extensively for extracting the shorelines.
The attempt in this research is to use satellite images and their application in order to study variations of the shorelines. Thus, for this purpose, Landsat satellite images from TM and ETM+ sensors in the 35 time period has been used. In order to reach better results, images from MODIS satellite has been used as auxiliary data for the images that are with an error margin. Initial classification on the images was conducted to distinguish water and non water applications. Neural network classification was applied with specific scales on the images and the two major applications were thereby extracted. Then, in order to authenticate the proceedings, Error matrix and Kappa coefficient has been applied on the classified images. Base pixel method of neural network was used for the purpose of information extraction while authenticity of that was evaluated too. The outcomes display the trend of Urmia shoreline has been approximately constant bet ween the years of 1976 to 1995 and has experienced very low variations. In 1998 the lake experienced increase of water and therefore advancement of the shoreline of the lake due to increase of precipitation and the volume of inflowing water to the basin. During 2000 to 20125,
however, the lake’s shoreline has experienced a downward trend, which was intensified in 2007 and reached to its most critical level ever since, that is decreasing to about one third.
Further, temporal and spatial potentiality evaluation of clouds seeding in Urmia lake zone has been studied as a solution for improvement and recovery of the current status of the lake, and an algorithm was proposed for optimized temporal- spatial study on could seeding. Ecological, meteorological and synoptic data were used for timing study of the cloud’s seeding plan, which upon study; it is easy to evaluate precipitation potential and quality of the system. At the next step, the rate of humidity and also stability of the precipitating system can be analyzed using radar acquired data. Whereas extracted date from MODIS images are expressing the spatial position, therefore in order to study the location of the cloud’s seeding, MODIS images of the selected time intervals along with applying MCM algorithm were used to conclude thick clouds. Also, with interpolation of the TRMM data, it is possible to deduce maximum precipitation in the form of spatial arena. One of the data categories that is used both for temporal and spatial analysis is radar images which in addition to time, displays the existing humidity range, movement direction, and positions of accumulated precipitation cores. Therefor e, using this algorithm, it is possible to conclude the most optimized spatial position in order to execute the seeding plan.
1. INTRODUCTION
Forms and features of the earth’s surface are subject to rapid
changes and such changes are remarkable during the life of mankind [1]. An important point here, thus, is to carefully study such changes in order to well recognize the natural and manmade processes causing such changes.
During the recent decades, application of remote sensing technology in order to recognize such changes over time has
brought the attention of several researchers to itself [2]. Therefore, littoral regions and especially domestic lakes as
ecologic environments have been considered remarkably [3]. Under these circumstances, it can be assumed of importance to survey and evaluate such regions for the purpose of natural resources management.
Surveying coastal regions and extracting changes in water level over various time intervals has been considered as an infrastructural research at earlier periods. This is due to the fact that shore lines have a dynamic nature and thus management of such ecologic environments needs to acquire accurate data over various time intervals [4-5]. In this regard, several researchers have conducted their studies and researches, which in following, some of them are brought for review:
In a research at Bhopal Research and Technology Society of India, by Singh et.al. [6], remote sensing technology were used as a combined method for evaluation of surface waters and management of Bhopal Lake. The conclusion of that research displayed that satellite data can be used for topography and survey of a huge water basin over various time periods.
In a research, Qudah [7], has used remote sensing technology and geographic positioning system as appropriate tools for border plotting and evaluation of the Dead sea in Jordan and Palestine. The derived results were stating that the lake had experienced remarkable changes in terms of level and shorelines over the study period, which such conclusion could be acquired only through remote sensing technology for studying and extraction of shorelines in their research.
Zavadianun et.al. [9] have used remote sensing system in order to explore environmental changes of coastal regions of Romania at the Black Sea, and have assessed image processing procedure as a fundamental tool for environmental studies.
In a research, Stephen Kish [10] focused on balance of water levels at Jackson and Florida lakes, based on ecological elements
(precipitation and evaporation) with usage of remote sensing technology in addition to geographic information system, and came to conclusion that water level periodic variations at the 1998 and 2000 and have plotted its relative chart over the period of study.
Kiachang Di et.al. [12] at Ohio University of Japan conducted coastal topography and detecting variations in the shore line with a semi automatic plotting method at Lake Erie using Panchromatic Ikonos images which the result of said study was accurate extraction of shoreline and preparation of its variation chart over the studied period.
Rasouli et.al. [13], conducted a research with the title of surveying variations of water level at Urumia lake applying multi sensing
Various studies in Iran and over the world has been conducted on cloud seeding with the method of MODIS Cloud Mask, which some of them are reviewed hereunder:
Weather Modification Association , California [14] has expressed several facts regarding cloud seeding and has concluded that it commonly result in 10 to 15 percent increase of precipitation, and in a small section, it even cause an increase of precipitation between 20 to 30 percent .
Stauffer et.al. [15] as a result of an experiment of cloud seeding in Utah have stated that for absolute judgment on the results of cloud seeding plans, it is needed to conduct at least five consecutive projects in the same region.
Li et.al. [16] attempted to classify the types of clouds using multi spectrum bands of MODIS images and have applied ML4 classification method and MCM5 algorithm.
Koloskov and et al. [18] have studied the function of cloud seeding during the years 2003 to 2006 for the purpose of modifying climate in various Russian cities.
Omidvar [19] conducted a synoptic analysis of precipitation systems in Kerman region and the possibility of increasing their precipitation by cloud seeding, and, concluded that Sudanese low pressure systems and the low pressure system positioned over Arabia peninsula can cause appropriate conditions for cloud seeding and increase of precipitation within the region, however, whereas Mediterranean low pressure systems carry less humidity and instability, thus cannot play a significant role in precipitation projects.
Meteorology Research Institute, through the studies related to artificial cloud seeding in various counties and its examination for Khorasan province, eventually concluded that successful execution of cloud seeding operations is pending to necessary local basic and feasibility studies [9].
In a research which was conducted by Omidvar [10] for the purpose of evaluating feasibility of execution of precipitation increase projects in the southern heights of Kerman, he concluded that the highest ampleness of low clouds and fully cloudy sky occurrence are observed in the region during the rainy and cold months of the year (from late November to late March and especially during February), thus the heights with the most probability of frost level occurrence and the maximum base height for low clouds, during late November to late March, provide more appropriate conditions for execution of precipitation plans in the region.
In another research by Omidvar [11], which was conducted in order to analyze winds and atmospheric streams for the purpose of positioning the cloud seeding zones in Yazd and Kerman considered as advantages for execution of cloud seeding projects in the named regions of the country. Further, Omidvar [12] conducted a study on temporal-spatial opportunities for increase of precipitation in Yazd province and concluded that, time wise, this province host an almost constant precipitation regime within late November to March, especially during December, January and February and the total amount of precipitation and number of occurring precipitation during such period have better conditions and therefore are appropriate to execute precipitation plans within the Province. Regarding its spatial positioning, Shirkouh elevated heights and its southern and western slopes are susceptible to seeding.
In a research plan, Hossein Sadeghi and Rezaeian [13], have studied a number of instability indices and seeding potentials for convectional clouds in Isfahan region.
Rasouli and Abbassian [14] have studied variations of water levels at Urmia lake using remote sensing technology and geographical information system in the statistical period of the years 1976-2005, which the outcome of their investigations
displayed that the surface of this lake has reduced about 23 percent during the studied period, and such caused accelerated
conversion of watered lands to barren areas and regions of salt province and concluded that it has ecological atmospheric basis for cloud seeding due to the position of this province in the streams of various atmospheric systems, also appropriate cloud coverage and climate, and necessary humidity at different surfaces.
Mobasheri et.al.[16] attempted to promote a cloud detector algorithm simultaneously using image of MODIS and Aster in Damghan and classified the clouds through MCM method. The outcome states that application of MODIS images enables us to distinguish a pixel with cloud in it from the clear non cloudy ones.
Mohammadi et.al. [17] conducted a research studying feasibility of weather modification using cloud seeding technique, and thereby concluded that ecology of Khorasan province is semi dry and dry and considering the results of cloudiness, the months with seeding potential are December, January and February, March and April and the proposed appropriate regions for cloud seeding are northern and north-western regions of the province.
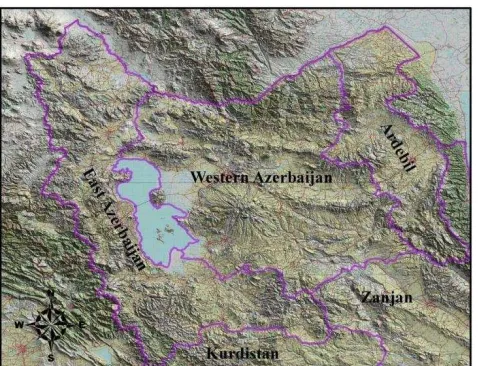
2. THE REGION OF STUDY
Urmia lake is located between the two provinces of Eastern and Western Azerbaijan. This lake is situated in 45 to 46 Eastern degree longitude and 37 to 38.5 Northern degree latitude; also it is in the zone number 38 of the Universal Transverse Mercator Coordinates System (UTM).
3. CATCHMENT BASIN OF URMIA LAKE
A “catchment basin” is the most logical unit for hydrological
studies on surface waters. Precise investigation of water balances ( i.e. the amount of water inlet and outlet ) is possible in such areas for various purposes [1]. A catchment basin is an area of land which is surrounded by heights and thus runoffs caused by precipitation are concentrated in its lowest surface and will exit the area from a point of lowest altitude within the basin area. In other words, a catchment basin is an area in which surface runoff
is naturally led toward a certain point called “point of concentration” [28].
Figure 1: Location of Urmia Lake in the Country ( Author)
4. CATCHMENT BASIN OF URMIA LAKE
A “catchment basin” is the most logical unit for hydrological
studies on surface waters. Precise investigation of water balances ( i.e. the amount of water inlet and outlet ) is possible in such areas for various purposes [1]. A catchment basin is an area of land which is surrounded by heights and thus runoffs caused by precipitation are concentrated in its lowest surface and will exit the area from a point of lowest altitude within the basin area. In other words, a catchment basin is an area in which surface runoff is naturally led toward a certain point called “point of
concentration” [28].
5. MATERIALS AND METHODOLOGY OF
THE RESEARCH
Considering the category of this research which is divided in two sectors of determining shorelines of Urmia Lake and analyzing spatial-temporal potentiality of could seeding thus the data and information used herein is automatically separated in two where each is studied separately in following.
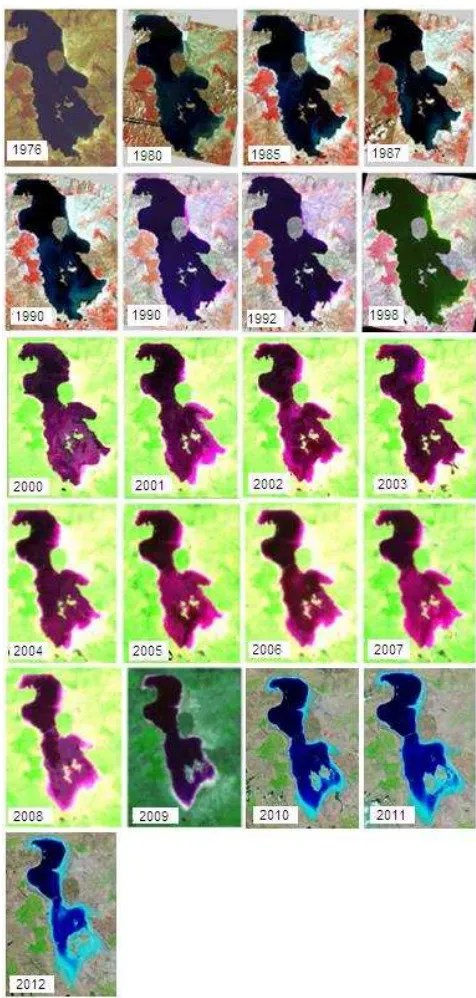
Due to the target of research which is determining the trend of changes in shorelines of Urmia Lake in the first sector, available images have been used. The images are projected by and derived from Landsat sensor including ETM+ and TM images in a 35 year period between 1976 to 2012. The attempt was to use images in summer months as they displayed the lowest water limits. MODIS satellite images of the region have been also used as auxiliary assisting data for the images with a margin of error.
The index of ETM and TM images for the region of study are displayed here under in Figures 2 and 3.
Figure 2: Index of ETM images (Author)
Figure 3: Index of TM images (Author)
Considering the above mentioned, table 1 expresses the features of images used in this research.
Table 1: Features of the images used in the research
Features Sensors
Temporal Resolution
Mechanical Resolution
Radiometric Resolution
Spectrometric Resolution
TM 16 days 30 meter 8 bit
0.45 to 12.5 mµ
ETM+ 16 days
30 meter - 15 meters panchromat
ic
8 bit 0.45 to 12.5
mµ
Images from the years 1976, 1989, 1995, 1998, 2000, 2005, 2007, 2010, 2011, and 2012 were used in this study for investigating the shoreline of Urmia Lake.
Figure 4: Satellite images that are used in this research (Author)
The software that is used in the research was ENVI 4.7 for taking required measures in the process for determining the changes of the shoreline; also Arc GIS desktop was used for cartography of the acquired outputs. The general algorithm for extracting the shoreline out of the process is shown in Figure 5
Figure 5: The algorithm for extracting the shoreline out of the process (Author)
According to the algorithm charted in Figure 5, after acquisition of satellite data and within the extracting and enhancement of the changes, the factors that should be considered are Temporal, Spatial and Radiometric resolution of the images, which if verified as appropriate then the images will be pre-processed and processed subsequently. After applying the named techniques and accuracy check, the evaluation of classification authenticity for extracting the shorelines will be made.
The classification authenticity can be checked by comparing the sample classified pixels with the surveyed information [36]. Further, an authenticity check, also determines the quality of derived information from remote sensing data. However, this quantity based checking is not the final target and is actually measuring the error margin on the chart [37]. The most common method for quantity evaluation of the classification accuracy is to choose a series of known sample pixels and to compare their label with the results of the classification process. These types of data are mostly called ground facts. The results of this comparison are also known as error matrix or ambiguity matrix [38].
Therefore, using the existing charts and taking the ground surveyed points within various desired coverage of the area; some experimental sub-areas were selected on the image. There are several factors such as commission error, omission error,
producers accuracy, user accuracy, overall accuracy and Kappa coefficient, which in this research, three of these indexes, that are error matrix, overall accuracy and Kappa coefficient were used to evaluate the classification authenticity.
5.1. Error matrix
In an error matrix, the relationship between source data and the acquired results are compared class to class[39], and the columns are for the source data and the rows are for the acquired classification derived from remote sensing data. Error matrix is an effective method for authenticity check, as verification of each class is along with clear expression of commission and omission errors [40, 41].
5.2. Overall authenticity
Overall authenticity is one of the simplest accuracy parameters which is not pending on complex calculations. Therefore, overall accuracy which is an average of classification accuracy compared to the accurate classified pixels to the total determined pixels and is calculated as following:
Equation 1:
Where C is the number of classes, N is number of known classes, Eii are diagonal elements of the error matrix and OA reflects the accuracy of classification [41].
5.3. Kappa Coefficient
Kappa analysis is a multi variable discrete technique which statistically is applied in order to determine basic difference of the error matrix for authenticity evaluation. Kappa coefficient which is also known as KHAT statistics and is acquired for comparison of various matrices is actually applicable in various classification methods and upon calculation it is clarified if one method results better than the other, or not [42]. The amount of Kappa index varies between zero to one, which the more it is close to one, the more accuracy of the acquired variable from the classification is close to reality [43]. Kappa index is calculated as following:
Equation 2:
Where nii is the number of observations in the i row and I column on the major diameter , n+I is the number of overall observations in the I row and I column and N is the total observations.
6. Extraction of changes in the shoreline
At this stage, after classifying with the mentioned algorithm and upon verification of authenticity, then the outputs are divided in two major application, one is water and the other is non water application. Therefore, the shore line can be extracted as a result of determination of the limit between water and land.
The data used for potentiality evaluation of cloud seeding include synoptic precipitation data ( 3 hours) recorded by precipitation
stations of the catchment basin of Urmia lake since 2000 to 2011, and number of the days with could seeding are provided from general directorate of meteorology organization of Eastern Azerbaijan province. Then, surface atmospheric factors are observed within specific timings at synoptic stations and the results are recorded with pre specified codes and are referred to concerned centers [31]. Among the surface charts, See Level Pressure charts and 850 Hpa level of the Eastern Azerbaijan were used. For the remote sensing data, images of MODIS sensor and TRMM satellite were applied and images of Dopper radar system from Sahand radar meteorology station was used as radar images.
7. Temporal study of cloud seeding plan
Upon study, it is concluded that several months are potential for cloud seeding in the Urmia lake area. Also, studying long term data provides us with ecological, meteorological and synoptic data of such period of time. Therefore, several appropriate periods can be chosen upon studying such statistics. On the other hand, studying charted data such as 850 Hpa and SLP charts can lead us to locate precipitate systems. Upon studying these two data set, precipitation potential and system quality can be easily evaluated. At the next step, humidity and stability of precipitation system can be analyzed through studying radar acquired data.
Thus, with studying above stated data sets, appropriate timings within each selected period based on ecologic data can be chosen reasonably. Figure 6, displays the algorithm for investigating the potentiality for timing of cloud seeding.
8. Spatial Study on the could seeding plan
Urmia lake area includes parts of three provinces, Eastern Azerbaijan, Western Azerbaijan and Kurdistan. One of the other very significant elements in the cloud seeding procedure, is the spatial aspect which must be analyzed. As referred earlier, it is possible to derive maximum precipitation at stations and other locations from recorded data at precipitation and synoptic stations.
Figure 6: Algorithm for investigating the potentiality for timing of cloud seeding
For performing the cloud seeding plan, the optimal temporal period and spatial limit can be selected with the application of the above algorithms.
The softwares used in this research are ENVI 4.7 for preparation, processing of satellite images and erection of the model and Arc GIS 9.3 for interpolation of TRMM images.
9. Findings
For the purpose of extracting shoreline, the algorithm in Figure 5 has been used in this research. Therefore, the images were initially processed for a 35 year period since 1976 to 2012 and then the images were prepared and snalyzed subsequently.
Figure 7: Algorithm for spatial study of cloud seeding plan
Initial classification on the images was made in order to distinguish water and non water application. Neural network classification was applied with certain standards on the images and resulted in dividing the images for the two major applications. For authenticity test of the results, error matrix and kappa coefficient were applied on the classified images, which after verification, the outputs were placed in the interface of Arc GIS software and upon required modification, the shoreline in was extracted for different years.
9.1. Extracting the shoreline
Extraction of shorelines in order to monitor coastal areas for the purposes of national development and environmental protection is a fundamental and necessary measure.
After applying essential modifications one the initially classified images, the two major types of water and non water applications were distinguished and produced with utmost accuracy.
Now therefore, in order to extract the shore lines of Urmia lake, it only requires to eliminate non water application and to keep only
the water application which is actually the borderline of the lake’s
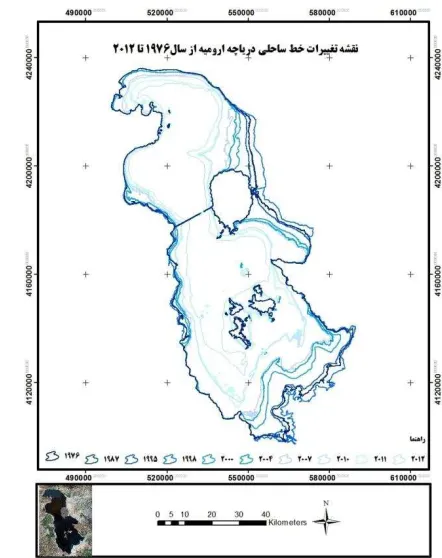
shore. For this purpose, Arc GIS software was used to follow these procedures and shoreline and their respective surfaces were extracted accordingly. The shoreline of Urmia lake since 1976 to 2012 are therefore displayed in Figures 8 to 16.
Figure 8: Urmia lake shoreline in 1976
Figure 9: Urmia lake shoreline in 1989
Figure 10: Urmia lake shoreline in 1995
Figure 12: Urmia lake shoreline in 2000
Figure 13: Urmia lake shoreline in 2005
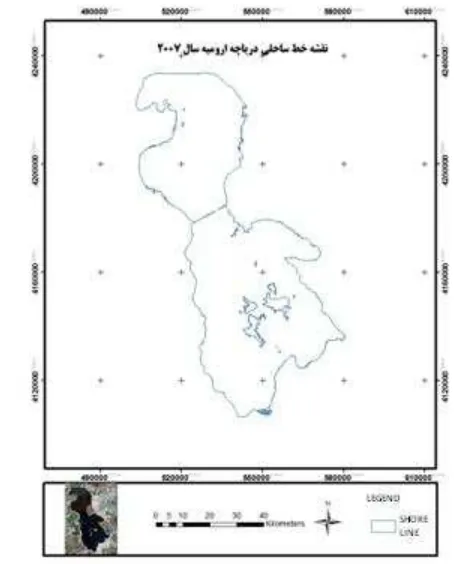
Figure 14: Urmia lake shoreline in 2007
Figure 15: Urmia lake shoreline in 2010
Figure 16: Urmia lake shoreline in 2011
Figure 17: Urmia lake shoreline in 2012
Figure 16: Urmia lake shoreline variations since 1976 to
2012
As a result of studying necessary basic and effective factors for cloud seeding, it was concluded that April is the best month for this purpose. Meanwhile, verification was the confirmation that was received for this month through interviews with related experts and authorities. Study on the articles and comments of respective experts, a data set which assisted to improve the trend of this research were also gathered and was analyzed accordingly, such as statistic data of Water Organization and Meteorology Organization ( of the studied days for cloud seeding), data on annual precipitation amount over several years within the area, data derived from synoptic stations which assisted the aspect of spatial study and also other data such as 850 Hpa charts and SLP charts, in addition to analysis of meteorology experts concerning existence of precipitation systems, humidity rate and their stability derived from TRMM satellite data that displayed the average of precipitation rate over the whole area.
Another data which remarkably assisted for a clear and comprehensive vision in this research was radar images which were applied both for spatial and temporal analysis of the atmospheric status over the Urmia lake area.
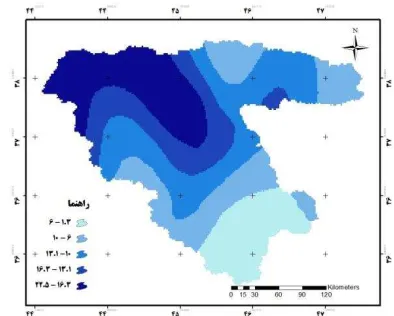
Also, with a study on ecologic data and effective factors in cloud seeding, the appropriate timing period was chosen. Data from synoptic stations were used to specify which stations in terms of location (x, y) have the highest precipitation rate and better potential for the purpose of this project. In this regard, after downloading precipitation data from TRMM satellite for the whole day, they were converted to appropriate applicable format for analysis. Then, with the use of spline method, precipitation data over the catchment basin of Urmia lake were interpolated. In figure 17, interpolation of precipitation data for April 20th is displayed.
Figure 17: Interpolation of TRMM precipitation data over the catchment basin of Urmia lake (April 20th)
Considering the interpolation of data on April 20th, it is evident
that the maximum precipitation (36.2 – 49.1) took place at the south of the area with 11.2 % of the whole precipitation over the
area and this rate gradually decreased while moving toward north,
so a slight rate of precipitation has been recorded at the Urmia
lake, itself.
Figure 18: Interpolation of TRMM precipitation data over the catchment basin of Urmia lake (April 21st)
The chart based on interpolation of precipitation data displays that
most of the precipitation over the area (i.e.16.2%-28.3%) took
place at central and southern parts of the area (i.e. 17.2%) and the
quantity was also reported good. Highest rate of precipitation
coincided with the center of the area a and concentration of the
precipitation over the west of the area displayed continuity of the
system over the area for the next day.
Figure 19: Interpolation of TRMM precipitation data over the catchment basin of Urmia lake (April 22nd)
However, interpolation of precipitation data for the whole day reflected that the maximum precipitation (i.e. 16.3-22.6) took place over the North-West (26.1%) with decreasing diagonal trend toward South-East, due to entrance or boost of precipitation system from the North West. The maximum rate of precipitation is 22.5 mm which this amount is in conformity with the relative surveyed data. Thus, Urmia Lake is probably located under not cloudy portion of the area.
Figure 20: Interpolation of TRMM precipitation data over the catchment basin of Urmia lake (April 23rd)
As a result of studying necessary basic and effective factors for cloud seeding, it was concluded that April is the best month for this purpose. Meanwhile, verification was the confirmation that was received for this month through interviews with related experts and authorities. Study on the articles and comments of respective experts, a data set which assisted to improve the trend of this research were also gathered and was analyzed accordingly, such as statistic data of Water Organization and Meteorology Organization ( of the studied days for cloud seeding), data on annual precipitation amount over several years within the area, data derived from synoptic stations which assisted the aspect of spatial study and also other data such as 850 Hpa charts and SLP charts, in addition to analysis of meteorology experts concerning existence of precipitation systems, humidity rate and their stability derived from TRMM satellite data that displayed the average of precipitation rate over the whole area.
Another data which remarkably assisted for a clear and comprehensive vision in this research was radar images which were applied both for spatial and temporal analysis of the atmospheric status over the Urmia lake area.
With all these data, a specific date for applying NCN algorithm, which is a practical algorithm for determining the cloud index, was chosen. Three different scenarios were conceived for clouds with different thresholds and thus, thick and thin clouds were located, and the authenticity and correct calibration can be checked with radar images of TRMM data.
Also, with a study on ecologic data and effective factors in cloud seeding, the appropriate timing period was chosen. Data from synoptic stations were used to specify which stations in terms of location ( x,y) have the highest precipitation rate and better potential for the purpose of this project.
In this regard, after downloading precipitation data from TRMM satellite for the whole day, they were converted to appropriate applicable format for analysis. Then, with the use of spline method, precipitation data over the catchment basin of Urmia lake were interpolated. In figure ---, interpolation of precipitation data for April 20th is idplayed.
The chart that is concluded based on precipitation data display that most of the precipitation ( 7.6-11.6) on April 23rd, i.e. about 11.6%, took place at Northern, Western and Southern parts of the area which coincides with the area with thick clouds. However, in general, the rate of precipitation on this day was reported lower which was a result of existing the precipitation system from the area.
Considering the statistics and studies on ecologic, synoptic and meteorological data which were acquired from Water Organization, Metrology Organization and Environment Protection Organization it is concluded that the maximum rate of precipitation over Urmia lake area over a long term period of 50 years has been in Spring and specifically in April. Therefore, the best month for inducing precipitation to add the natural precipitation to collectively inject more precipitation in the area is
April. On the other hand, as April is before the hot season, thus it can provide the required amount of water which will be evaporated during summer and therefore, to prevent further dry out of the lake and fall back of the shoreline.
The statistics are also displaying that precipitation actually took placed more in the second half of this month. Investigating the above studied four days of the month and data analysis such as SLP and 854 Hpa charts, radar and TRMM proved that the desired day for performing cloud seeding can be derived from studying these data.
Thus, as it was observed, the first two days experienced a precipitation rate of 29, due to entrance of precipitation system and density of clouds. Accordingly, he next days, the rate of precipitation decreased to 11 due to exit of the same precipitations system. Therefore, the first two days (i.e. April 20th and 21st) were chosen for applying MCM algorithm.
9.2 Performing MCM algorithm
Considering the focus on luminosity temperature in MCM method, after preparing the photos, the relative luminosity temperature of the applied bands in this method were calculated. Hereunder, luminosity temperatures of the bands required for placing in the ENVI software are calculated.
9.2.1 Various Luminosity temperatures of MODIS sensor:
Luminosity temperature of the band 22 of MODIS sensor:
(1) 3632.404/alog((122311882186.185/(float(b22)*1000000))+1)
Also for threshold placing at the calculated Luminosity temperature in ENVI, there is:
(2) (b1lt X)*1+(b1 ge X)*0
Where x is this relationship is the calculated threshold for each model.
Luminosity temperature of the band 27 of MODIS sensor:
(3) 2130.379/alog((8487551264/(float(b27)*1000000))+1)
Luminosity temperature of the band 29 of MODIS sensor:
(4) 1682.376/alog((2606837803.25/(float(b29)*1000000))+1)
Luminosity temperature of the band 31 of MODIS sensor:
(5) 1304.108/alog((729570804.6723/(float(b31)*1000000))+1)
Luminosity temperature of the band 32 of MODIS sensor:
9.2.2 Final Confidence level
Each of the models has a confidence level between 0 to 1, which in the present research there are four confidence level calculated through relationship (3) above:
Completely clear and non cloudy pixels (Q <0.5)
Probably clear and non cloudy pixels ( 0.5< Q<0.75)
Probably cloudy pixels (0.75 < Q< 0.875) and
Cetrainly cloudy pixels (Q > 0.875)
9.2.3. Studies on April 20th
Studies were made in two groups of models on this date as per below description:
9.2.4. Results of the first group:
Models of the first group are threshold placing of luminosity temprature at 6.7, 13.9 and 11 micrometer, which comprise 27, 31 and 35 bands of MODIS sensor, respectively.
As MODIS sensor is extremely capable of absorbing water varpor particles in the limit of 6.7 micro meter, thus it is used for detedting clouds at 600 Hpa levels. In fact, radiations that are
transmitted by earth’s surface and clouds at low levels of the
athmosphere within this limit are actually absorebed by water vapour before they even reach to the sensor. Therefore the emmited radiations from the clouds that are above the absorbtiopn limit of these particles reach to the sensor while their temprature are lower than other zones of the image and thus can be well distinguished.
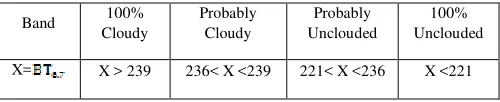
Table 2: The calculated threshold for ( (April 20th)
Band 100%
Cloudy
Probably Cloudy
Probably Unclouded
100% Unclouded
X= X > 239 236< X <239 221< X <236 X <221
As the band 35 of MODIS sensor (13.9 μm) is in the range of athmospheric , thus the cloudes above the 500 Hpa can be detected. One of the existing problems for performing the model in the present research is extreme banding of the band 35 which has severely damaged the image and faced the modeling proceess with problems.
Based on the observations, the modified and ideal thereshold for in the concerned area is provided in Table 3.
Table 3: calculated threshold for (April 20th )
Band 100%
Cloudy
Probably Cloudy
Probably Unclouded
100% Unclouded
X= X > 267 265< X <267 221< X <256 X <221
Figure 21 : Cloud coverage concluded from placing threshold (April 20th)
Table 4: The surface of area under various conditions derived from placing thresholds on April 20th
Sky Condition Surface ( ) Surface area (%)
Cloudy 50,538.77 98.6
Unclouded 684.61 1.4
Observing the results of luminosity temperature with the threshold limit of 221 K
˚
, it was evident that 98.6% of the area was covered with clouds and only 1.4% of the North-East sky was uncloudy and clear on April 20th.Figure 22: Thick clouds concluded from threshold placing of the
first group models (April 20th)
Table 5: Surface of thick clouds of the area concluded from threshold placing in the first group of models (April 20th)
Sky Condition Surface ( ) Surface area (%)
proportionally have more precipitation capacity. Thus, these
clouds are more apt to seeding. It was also noted that thick clouds
has been spread over the area almost for the whole day on this
date.
9.2.5. Results of the second group:
Second group of models are used for detecting thin clouds that
were not detectable in the first group.
Upon placing appropriate thresholds in - models, thin
and dispersed clouds can be located. Table 5, contains appropriate
thresholds in order to form this model.
Table 6: Acquired thresholds for
BT11- BT12
(April 20th)expresses presence of a cloud, while negative figures for the same
relationship are interpreted as unclouded areas. The acquire
thresholds for this model are provided in Table 7.
Table 7: Acquired thresholds for
BT8.6- BT11
(April 20th)clouds at low levels and also thin and small clouds. The acquired
thresholds for this model are as below.
Table 8: Acquired thresholds for - (April 20th)
Figure 23: Thin clouds concluded from threshold placing of the
second group of models ( April 20th )
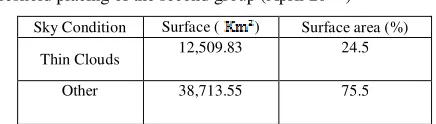
Table 9: Surface of thin clouds in the area concluded from
threshold placing of the second group (April 20th )
Sky Condition Surface ( ) Surface area (%)
Thin Clouds 12,509.83 24.5
Other 38,713.55 75.5
The outcomes derived from applying the second group of models on April 20th displayed that 24.5% of the clouds in the area are comprised of thin clouds that are dispersed over the whole area.
10. Discussion and Conclusion
The attempt in this research was to note the critical condition of Urmia lake and to provide, criticize and study possible solutions. Therefore the first part of the research focused on the variations of shoreline of Urmia lake over a 35 year period. The charts of shoreline fall back at Urmia lake and its consequences is an alarm for concerned managers and authorities.
was shown in diagrams. Such diagram displayed a red alert for death and its consequences at Urmia lake.
Despite the economic aspects of the lake which is Artemia,
In the second part of this research, cloud seeding was introduced and studies as a solution, capable of at least compensate a part of such shoreline fall back. In locating the best spatial position for cloud seeding plans, it is noted that temporal distribution of the precipitation is of high importance. Economically these plans should be performed at their best timing due to the very advanced and complex technologies that are used for these plans.
References
[1]Macleod, R. S & R. G. Congalton,; a quantitative comparison of change detection algorithms for monitoring eelegrass from remotely sensed data. Photogrammetric and Remote Sensing of Environment,Vol. 8, 1998.
[2] Singh, A., “Digital change detection techniques using remotely senseddata“, Int J. R. S.Vol.10,No 6, ,1989
.
[3]Jensen J.R.; Introductory digital image processing: A remote sensing perspective (Second Edition), Prentice-Hall, Upper Saddle River NewJersey, 316, 1996
.
[4] upp D. L. B., Background and extensions to depth of penetration (DOP) Mapping in Shallow Coastal Waters. Proceeding of the Symposium on remote sensing of Coastal zone,Gold Coast,Queensland,September 1988
,
IV.2.1-IV.2.19, 1988.
[5]DasarathyV.; Nearest neighbor classification techniques; IEEE ComputerSociety,1991.
[6] K. Singh, N. V. Deshpande, B. Sakalley, S. N. Rajak and J. Kelsy
.,
Satellite remote sensing for surface water assessment and management of Bhopal Lake - An integrated approach, Remote Sensing Applications,
Centre M.P. Council of Science & Technology Bhopal, India, 1991.
[7]ng. Omar Qudah, Eng. HusseinHarahsheh, Recession of Dead Sea through the Satellite Images Royal Jordanian Geographic Centre Amman-Jordan, 1994
.
[8] eng . P. S., Shunji M., Kiyoshi H., Robert L.G. S. Samarakoon. , Detectionof coast lines of tonle Sap lake in flood season using JERS-1 data for water volume estimation STAR program, Asian Institute of Technology
,
1997.[9] L.Zavoianu A, Caramizoiu D. B., Study and accuracy assessment of remote sensing data for enviromental change detection in Romanina coastal zone of the Black sea; Faculty of Geodesy, Technical University of Engineering Bucharest, Romania, 2001
.
[10]tephen A. K., A remote sensing and GIS Study of Lont-Term water mass balance lake Jackson, College of Enegineering Science Technology
&
Agriculture. Florda, U.S.A, 2002.
[11] Bayram B., Bayraktar H., Helvaci C., Acar U;Coast line change detection using corona, SPOT and IRS ID Images,Turkey–Istanbul, 2004
.
[12] Kaichang Di, Ruijin Ma, Jue Wang, Ron Li, Coastal mapping and change detection using high-resolution IKONOS satellite imagery, Japan- Ohio
,
2004.
[13] Rasouli, Ali Akbar, Abbassian, Shirzad and jahanbakhsh, Saeid, Surveying the vibrations of water surface at Urmia lake with processing the multi sensor and multi time images, Masters of Human Sciences Quarterly, No.2, page 5, 2008.
[14]Ault, T, Czajkowski, K, Benko, T, Coss, J, Struble, J, Spongberg, A, Templin, M, Gross, C, 2006, Validation of the MODIS snow product and cloud mask using student and NWS cooperative station observations in the Lower Great Lakes Region, Remote Sensing of Environment 105 : 341–353.
[15]Hall, Dorothy,K, 2002, Moderate Resolution Imaging Spectroradiometer (MODIS) Snow and Ice Maps – An Overview, MODIS Land Workshop on Radiation Budget Variables and Snow and Ice Products Boston Uiversity.
[16].Li, Z, Li, J, Paul Menzel, W,Yang, Z, Frey, R.A, Ackerman, S.A, 2002 , High-Spatial-Resolution Surface and Cloud-Type Classification from MODIS Multispectral Band Measurements . Journal Of Applied Meteorology 42 : 204-226 .
[17]. Li, Z, Li, J, Paul Menzel, W, Schmit, T.J, Ackerman, S.A, 2007, Comparison between current and future environmental satellite imagers on cloud classification using MODIS, Remote Sensing of Environment 108 : 311–326 .
[18].Koloskov, B.P, Korneev V.P, Petrov V.V, Beryulev G.P, Danelyan B.G, Chernikov A.A, Shchukin G.G, 2006, Cloud Seeding Operations To Modify Weather Conditions Over Cities.
[19] Omidvar, K, Synoptic Analysis of precipitation systems and possibility of increasing precipitation by cloud seeding at Kerman area, Geographic Researches Magazine, No.40, Pgs. 19-32, 2001.
[20] Hemmati, R, Potential evaluation of cloud seeding in Ardebil province relying on atmospheric section analysis, Thesis, Azad Islamic University, Ardebil Branch, 2010.
[21] Omidvar, K, Some of ecological features of clouds in Southern Kerman heights for possibility evaluation of performing precipitation increase projects, Masters of Human Sciences Quarterly, No. 4, Pgs37-49, 2002.
[22] Omidvar, K, Winds and atmospheric streams analysis within precipitation periods for determination of appropriate position of cloud seeding in Central Iran: Yazd and Kerman Provinces, Masters of Human Sciences Quarterly, No 4, Pgs. 1-30, 2004.
[23] Omidvar, K, Studying Spatial-Temporal opportunities for precipitation increase in Yazd Province, Isfahan University Research Magazine, No.1, Pgs. 93-120, 2006.
[24] Sadeghi Hosseini, R & Rezaeiyan, M, Study on some of instability factors and potential of seeding convectional clouds at Isfahan area, Earth and Space Physics magazine, No. 2, Pgs. 83-98, 2006.
[25]Rasouli, A, Abbasian, Sh & Jahanbakhsh, S, Surveying Water surface variations at Urmia lake through processing multisensory and multi time sate3llite images, Masters of Human Sciences Quarterly, No.2, Pgs. 53-71, 2007.
[26] Karimi, N, Mobasheri M & Farajzadeh, M, Determination and distinguishing pixels with cloudsfrom unclouded pixels in MODIS images using MCM algorithm ( Area of study: Southern shores of Caspian Sea), Geomantic Convention 2009.
[27] Mobasheri, M, Gholami, N & Farajzadeh Asl, M , Cloud appearing algorithm of MODIS using simultaneously ASTER images, Damghan city case study, Space survey an planning, No. 2, Pgs. 81-99, 2011.
[28] Mohammadi, H, Asian , M, Potentiality Evaluation of climate modification with the target of cloud seeding in Khorasan Province ( Northern, Razavi and Southern), Geographic Sciences Magazine, Pgs. 56-83, 2003.
[29] Lutfi Suzan, M.(2002), Data Driven Landslide Hazard Assessment Using Geographical Information Systems and Remote Sensing , Doctor Thesis, Department of Geological Engineering, School of Neural and Applied Sciences, Middle Eat Technical University, Turkey.
[30] Pashazadeh, Gholamhossein, Comparison of item oriented and base pixel methods in classification of urban lands using
remote sensing data, Master’s Thesis, Shahid Beheshti University,
2009.
[31] Mahmoudzadeh, Hassan, Application of multi time satellite data in GIS environment with the purpose of studying changes in
applications of Tabriz city lands , Master’s Thesis, Faculty of
Social and Human Sciences, University of Tabriz, 2004.
[32] Varshney, P.K., Arora, M.K.(2004). Advanced Image Processing Techniques for Remptely Sensed Hyperspectral Data, Springer-Verlag, Berlin.
[33] Peter Scan. Tardie & Russell, G.Congalton.(2001). A Change Detection Analysis: Using Remotely Sensed Data assess the progression of development in ESSEX Counyy, Massachusetts from 1990 to 2001. Department of Natural Resources. University of New Hampshire Durham.
[34] Rasouli, Ali Akbar, mahmoudzadeh, Hassan, Fundamentals of remote sensing, basic sciences, Elmiran publications, 2010.
[35] Alavi Panah, Seyed Kazem, Application of Remore sensing in earch sciences ( soil sciences) , Second Publish, University of Tehran Publications, 2006.