lxxi
LAMPIRAN 1 : KUESIONER PENELITIAN
KUESIONER
ANALISIS FAKTOR YANG MEMPENGARUHI KONSUMEN DALAM PROSES KEPUTUSAN PEMBELIAN PRODUK TUPPERWARE
Petunjuk pengisian :
1. Isikan terlebih dahulu identitas anda.
2. Jawablah pertanyaan yang telah tersedia sesuai dengan diri anda.
3. Lingkari nilai yang tersedia pada setiap pernyataan yang tersedia pada tabel pernyataan sesuai dengan pendapat anda,dengan keterangan nilai sebagai berikut :
Nilai 1= STS (Sangat Tidak Setuju) Nilai 2 = TS (Tidak Setuju)
Nilai 3 = N (Netral/Ragu) Nilai 4 = S (Setuju)
Nilai 5 = SS (Sangat Setuju)
Berikan jawaban yang paling benar, sesuai dengan diri anda. I.
Nama Responden :
Nim :
Jurusan :
II.
• Produk tupperware apa yang pernah anda beli ?
...
• Dimana biasa anda membeli produk tupperware ? ...
• Seberapa sering anda membeli tupperware dalam sebulan ? ( Lingkari pilihan jawaban anda)
a. Sekali dalam sebulan b. Lebih dari sekali dalam sebulan c. Tidak menentu
lxxii
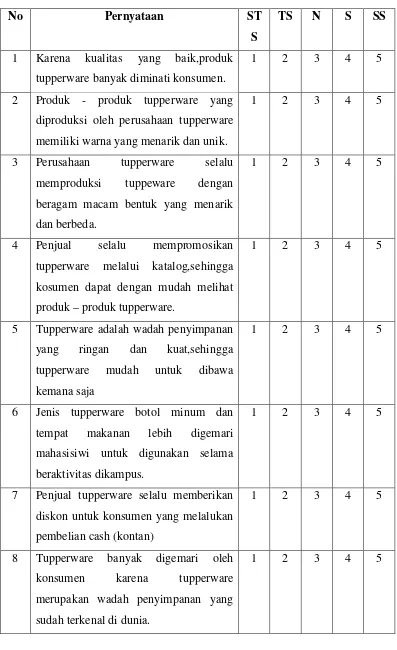
TABEL PERNYATAAN
No Pernyataan ST
S
TS N S SS
1 Karena kualitas yang baik,produk tupperware banyak diminati konsumen.
1 2 3 4 5
2 Produk - produk tupperware yang diproduksi oleh perusahaan tupperware memiliki warna yang menarik dan unik.
1 2 3 4 5
3 Perusahaan tupperware selalu memproduksi tuppeware dengan beragam macam bentuk yang menarik dan berbeda.
1 2 3 4 5
4 Penjual selalu mempromosikan tupperware melalui katalog,sehingga kosumen dapat dengan mudah melihat produk – produk tupperware.
1 2 3 4 5
5 Tupperware adalah wadah penyimpanan yang ringan dan kuat,sehingga tupperware mudah untuk dibawa kemana saja
1 2 3 4 5
6 Jenis tupperware botol minum dan tempat makanan lebih digemari mahasisiwi untuk digunakan selama beraktivitas dikampus.
1 2 3 4 5
7 Penjual tupperware selalu memberikan diskon untuk konsumen yang melalukan pembelian cash (kontan)
1 2 3 4 5
8 Tupperware banyak digemari oleh konsumen karena tupperware merupakan wadah penyimpanan yang sudah terkenal di dunia.
lxxiii
9 Produk tupperware memiliki berbagai macam ukuran,mahasisiwi biasa lebih senang dengan ukuran tupperware yang sedang atau kecil karena mudah untuk dibawa dalam beraktivitas dikampus.
1 2 3 4 5
LAMPIRAN 2 : DATA HASIL KUESIONER
LAMPIRAN 2A : Data mentah Hasil Kuesioner
lxxiv
19 4 5 4 5 4 5 3 5 4
20 3 4 4 4 4 5 4 4 4
21 3 4 4 4 5 5 4 4 4
22 5 4 4 4 4 4 4 5 5
23 4 5 5 4 4 5 4 3 4
24 4 4 4 4 4 4 4 4 4
25 4 5 4 5 4 5 4 5 4
(1) (2) (3) (4) (5) (6) (7) (8) (9) (10)
26 4 5 4 5 4 5 4 5 4
27 4 5 4 5 4 5 4 5 4
28 4 5 4 5 4 5 4 5 4
29 4 4 4 4 3 4 3 4 4
30 4 4 4 2 2 4 4 4 4
31 3 5 3 2 3 4 3 5 3
32 3 4 3 2 4 3 3 4 4
33 5 5 4 4 4 5 3 4 4
34 4 5 4 4 4 5 4 4 5
35 4 3 3 5 3 4 3 2 3
36 5 5 4 4 4 5 3 4 4
37 4 4 2 2 4 4 3 4 4
38 4 4 2 2 3 2 2 3 4
39 5 4 4 4 3 5 4 4 4
40 4 5 5 4 4 5 3 4 4
41 4 4 4 5 5 5 3 4 4
42 4 5 5 4 4 5 3 4 4
43 4 4 3 4 4 4 3 4 4
44 4 3 4 4 4 5 5 4 4
45 4 4 3 4 4 4 3 4 4
46 4 4 4 2 4 4 3 3 4
lxxv
48 4 5 5 4 4 5 5 3 5
49 5 5 4 4 3 4 5 5 4
50 3 4 3 1 4 4 4 3 4
51 4 3 3 4 2 3 3 4 4
52 4 4 4 4 4 4 3 4 4
53 5 4 5 5 4 5 5 5 5
54 3 2 3 2 2 4 4 3 4
(1) (2) (3) (4) (5) (6) (7) (8) (9) (10)
55 4 5 4 4 4 5 4 3 4
56 4 3 3 4 2 3 3 4 4
57 5 4 5 5 5 5 5 4 5
58 3 4 3 1 4 2 4 3 4
59 3 5 3 2 3 4 3 5 4
60 4 3 4 4 4 5 5 4 4
61 4 4 2 2 4 4 3 2 3
62 4 5 5 4 4 5 3 4 4
63 3 4 3 1 4 2 4 3 4
64 5 5 4 4 4 5 3 4 4
65 4 3 4 4 4 5 5 4 4
66 4 3 4 3 4 5 4 3 5
67 3 5 3 2 3 4 3 5 4
68 4 3 4 4 4 5 5 4 4
69 3 4 3 1 4 2 4 3 4
70 4 5 5 4 4 5 3 4 4
71 4 4 4 2 4 4 3 2 3
72 5 4 4 4 4 5 4 3 5
73 4 4 3 4 2 4 3 5 3
74 5 4 5 5 4 5 5 5 4
75 3 4 3 1 4 2 4 3 4
lxxvi
77 4 3 4 3 4 5 4 3 5
78 5 4 5 5 4 5 5 5 5
79 3 2 3 2 2 4 4 3 4
80 4 5 5 4 4 5 3 4 4
81 4 4 4 2 4 4 3 2 3
82 5 4 4 4 4 5 4 3 5
83 5 4 5 5 4 5 5 5 5
(1) (2) (3) (4) (5) (6) (7) (8) (9) (10)
84 4 3 4 4 4 5 4 3 5
85 5 4 4 4 4 5 4 3 5
86 3 4 3 1 4 4 4 3 4
87 4 3 4 3 4 5 4 3 5
88 5 5 4 4 4 5 3 4 4
89 3 4 3 1 4 4 4 3 4
90 3 4 3 1 4 2 4 3 4
91 3 2 3 2 2 4 4 3 4
92 4 5 4 5 4 5 4 5 4
93 5 5 4 4 4 5 3 4 4
94 4 3 4 3 4 5 4 3 5
95 5 4 4 4 4 5 4 3 5
96 4 4 3 5 2 4 3 5 3
97 5 4 5 5 4 5 5 5 5
98 5 5 4 4 4 5 3 4 4
99 3 4 3 1 4 2 4 3 4
100 3 2 3 2 2 4 4 3 4
101 4 4 2 2 4 4 3 2 3
102 5 4 4 4 4 5 4 3 5
103 3 4 3 1 4 2 4 3 4
104 4 5 5 4 4 5 3 4 4
lxxvii
106 5 4 5 5 4 5 5 5 4
107 4 3 4 3 4 5 4 3 5
108 3 2 3 2 2 4 4 3 4
109 3 4 3 1 4 4 4 3 4
110 3 4 3 1 4 2 4 3 4
111 4 5 5 4 4 5 3 4 4
112 4 4 3 4 2 4 3 5 3
(1) (2) (3) (4) (5) (6) (7) (8) (9) (10)
113 5 5 4 4 4 5 3 4 4
114 4 4 2 2 4 4 3 2 4
115 5 4 5 5 4 5 5 5 5
116 4 3 4 3 4 5 4 3 5
117 4 2 4 4 5 5 4 3 4
118 4 5 4 5 4 5 4 5 4
119 4 5 4 5 4 5 4 5 4
120 4 3 4 4 4 5 5 4 4
121 3 2 3 2 2 4 4 3 4
122 4 4 3 4 2 4 3 5 3
123 5 5 4 4 4 5 3 4 4
124 4 3 4 3 4 5 4 3 5
125 3 4 3 1 4 2 4 3 4
126 4 3 4 4 4 5 5 4 4
127 4 5 4 5 4 5 4 5 4
128 3 4 3 1 4 2 4 3 4
129 4 4 3 4 2 4 3 5 3
130 4 4 4 2 4 4 3 2 3
131 3 4 3 2 4 2 4 3 4
lxxviii
LAMPIRAN 2B : Transformasi Data Ordinal ke Interval
lxxix
27 2,368 4,131 3,361 4,169 2,874 3,526 4,070 4,230 2,469
lxxx
56 2,368 1,845 2,197 2,970 1,000 1,530 2,776 3,172 2,469
lxxxi
85 3,734 2,848 3,361 2,970 2,874 3,526 4,070 2,191 3,921
lxxxii
114 2,368 2,848 1,000 1,878 2,874 2,202 2,776 1,000 2,469
lxxxiii
LAMPIRAN 3 : PERHITUNGAN KORELASI
LAMPIRAN 3A : Perhitungan Korelasi Product Moment
lxxxiv
25 2,368 28,830 68,260672 5,60601 831,165008
(1) (2) (3) (4) (5) (6)
lxxxv
53 3,734 31,528 117,72058 13,942 993,986015 54 1,000 17,007 17,006525 1 289,221881
(1) (2) (3) (4) (5) (6)
lxxxvi
82 3,734 25,760 96,186952 13,942 663,602196 83 3,734 31,528 117,72058 13,942 993,986015
(1) (2) (3) (4) (5) (6)
lxxxvii
111 2,368 26,544 62,847984 5,60601 704,577618 112 2,368 19,222 45,511337 5,60601 369,475236
(1) (2) (3) (4) (5) (6)
lxxxix
27 2,368 4,131 9,78164 5,60601 17,067497
(1) (2) (3) (4) (5) (6) 28 2,368 4,131 9,78164 5,60601 17,067497 29 2,368 2,848 6,74285 5,60601 8,1102255 30 2,368 2,848 6,74285 5,60601 8,1102255 31 1,000 4,131 4,13128 1 17,067497 32 1,000 2,848 2,84785 1 8,1102255 33 3,734 4,131 15,4258 13,942 17,067497 34 2,368 4,131 9,78164 5,60601 17,067497 35 2,368 1,845 4,36943 5,60601 3,4056165 36 3,734 4,131 15,4258 13,942 17,067497 37 2,368 2,848 6,74285 5,60601 8,1102255 38 2,368 2,848 6,74285 5,60601 8,1102255 39 3,734 2,848 10,6336 13,942 8,1102255 40 2,368 4,131 9,78164 5,60601 17,067497 41 2,368 2,848 6,74285 5,60601 8,1102255 42 2,368 4,131 9,78164 5,60601 17,067497 43 2,368 2,848 6,74285 5,60601 8,1102255 44 2,368 1,845 4,36943 5,60601 3,4056165 45 2,368 2,848 6,74285 5,60601 8,1102255 46 2,368 2,848 6,74285 5,60601 8,1102255 47 2,368 4,131 9,78164 5,60601 17,067497 48 2,368 4,131 9,78164 5,60601 17,067497 49 3,734 4,131 15,4258 13,942 17,067497 50 1,000 2,848 2,84785 1 8,1102255 51 2,368 1,845 4,36943 5,60601 3,4056165 52 2,368 2,848 6,74285 5,60601 8,1102255 53 3,734 2,848 10,6336 13,942 8,1102255
xc
56 2,368 4,131 9,78164 5,60601 17,067497 57 2,368 1,845 4,36943 5,60601 3,4056165
(1) (2) (3) (4) (5) (6) 58 1,000 2,848 2,84785 1 8,1102255 59 1,000 4,131 4,13128 1 17,067497 60 2,368 1,845 4,36943 5,60601 3,4056165 61 2,368 2,848 6,74285 5,60601 8,1102255 62 2,368 4,131 9,78164 5,60601 17,067497 63 1,000 2,848 2,84785 1 8,1102255 64 3,734 4,131 15,4258 13,942 17,067497 65 2,368 1,845 4,36943 5,60601 3,4056165 66 2,368 1,845 4,36943 5,60601 3,4056165 67 1,000 4,131 4,13128 1 17,067497 68 2,368 1,845 4,36943 5,60601 3,4056165 60 1,000 2,848 2,84785 1 8,1102255 70 2,368 4,131 9,78164 5,60601 17,067497 71 2,368 2,848 6,74285 5,60601 8,1102255 72 3,734 2,848 10,6336 13,942 8,1102255 73 2,368 2,848 6,74285 5,60601 8,1102255 74 3,734 2,848 10,6336 13,942 8,1102255 75 1,000 2,848 2,84785 1 8,1102255 76 2,368 1,845 4,36943 5,60601 3,4056165 77 2,368 1,845 4,36943 5,60601 3,4056165 78 3,734 2,848 10,6336 13,942 8,1102255
79 1,000 1,000 1 1 1
xci
85 3,734 2,848 10,6336 13,942 8,1102255 86 1,000 2,848 2,84785 1 8,1102255
(1) (2) (3) (4) (5) (6)
87 2,368 1,845 4,36943 5,60601 3,4056165 88 3,734 4,131 15,4258 13,942 17,067497 89 1,000 2,848 2,84785 1 8,1102255 90 1,000 2,848 2,84785 1 8,1102255
91 1,000 1,000 1 1 1
92 2,368 4,131 9,78164 5,60601 17,067497 93 3,734 4,131 15,4258 13,942 17,067497 94 2,368 1,845 4,36943 5,60601 3,4056165 95 3,734 2,848 10,6336 13,942 8,1102255 96 2,368 2,848 6,74285 5,60601 8,1102255 97 3,734 2,848 10,6336 13,942 8,1102255 98 3,734 4,131 15,4258 13,942 17,067497 99 1,000 2,848 2,84785 1 8,1102255
100 1,000 1,000 1 1 1
101 2,368 2,848 6,74285 5,60601 8,1102255 102 3,734 2,848 10,6336 13,942 8,1102255 103 1,000 2,848 2,84785 1 8,1102255 104 2,368 4,131 9,78164 5,60601 17,067497 105 2,368 2,848 6,74285 5,60601 8,1102255 106 3,734 2,848 10,6336 13,942 8,1102255 107 2,368 1,845 4,36943 5,60601 3,4056165
108 1,000 1,000 1 1 1
xcii
114 2,368 2,848 6,74285 5,60601 8,1102255 115 3,734 2,848 10,6336 13,942 8,1102255
(1) (2) (3) (4) (5) (6)
116 2,368 1,845 4,36943 5,60601 3,4056165 117 2,368 1,000 2,3677 5,60601 1 118 2,368 4,131 9,78164 5,60601 17,067497 119 2,368 4,131 9,78164 5,60601 17,067497 120 2,368 1,845 4,36943 5,60601 3,4056165
121 1,000 1,000 1 1 1
xciii
LAMPIRAN 4 : HASIL OUTPUT SPSS
Descriptive Statistics
Mean
Std.
Deviation
Analysis
N
Missing
N
x1 3.9848 .65364 132 0
x2 3.9924 .84254 132 0
x3 3.7652 .77025 132 0
x4 3.3712 1.29240 132 0
x5 3.7424 .74773 132 0
x6 4.3409 .90655 132 0
x7 3.7652 .69743 132 0
x8 3.7045 .89731 132 0
x9 4.1136 .60086 132 0
Inverse of Correlation Matrix
x1 x2 x3 x4 x5 x6 x7 x8 x9
x1 2.245 -.485 -.137 -1.624 .168 -.172 .093 .676 -.277
x2 -.485 2.464 -.733 .840 -1.130 .285 1.097 -1.565 .314
x3 -.137 -.733 2.534 -.655 -.236 -.699 -.505 .236 -.446
x4 -1.624 .840 -.655 4.909 -.415 -1.562 .361 -2.447 .309
x5 .168 -1.130 -.236 -.415 1.955 -.144 -.553 1.137 -.406
x6 -.172 .285 -.699 -1.562 -.144 2.591 .073 .340 -.166
x7 .093 1.097 -.505 .361 -.553 .073 1.959 -.921 -.574
x8 .676 -1.565 .236 -2.447 1.137 .340 -.921 3.116 -.069
x9 -.277 .314 -.446 .309 -.406 -.166 -.574 -.069 1.750
KMO and Bartlett's Test
Kaiser-Meyer-Olkin Measure of Sampling Adequacy. .644
Bartlett's Test of Sphericity Approx. Chi-Square 579.788
Df 36
xciv
Rotation Method: Varimax with Kaiser
xcvi
Component Matrixa
Component
1 2 3
x4 .849
x3 .838
x6 .807
x1 .750
x8 .546 -.474 -.414
x7 .688
x9 .518 .658
x2 -.590 .550
x5 .454 .722
Extraction Method: Principal Component
Analysis.
xcvii
Reproduced Correlations
x1 x2 x3 x4 x5 x6 x7 x8 x9
Reproduced
Correlation
x1 .602a .406 .609 .689 .279 .599 .138 .500 .260
x2 .406 .797a .336 .331 .369 .225 -.449 .261 -.171
x3 .609 .336 .737a .641 .524 .661 .334 .345 .512
x4 .689 .331 .641 .874a .090 .712 .218 .709 .251
x5 .279 .369 .524 .090 .845a .288 .160 -.213 .486
x6 .599 .225 .661 .712 .288 .666a .356 .478 .432
x7 .138 -.449 .334 .218 .160 .356 .719a .013 .631
x8 .500 .261 .345 .709 -.213 .478 .013 .694a -.044
x9 .260 -.171 .512 .251 .486 .432 .631 -.044 .703a
Residualb x1 -.116 -.085 -.004 -.052 -.023 -.079 -.195 -.002
x2 -.116 -.009 -.069 -.045 -.102 .160 .140 .082
x3 -.085 -.009 -.047 -.087 -.032 -.011 -.027 -.058
x4 -.004 -.069 -.047 .057 .000 -.044 -.061 -.030
x5 -.052 -.045 -.087 .057 -.011 .059 .087 -.098
x6 -.023 -.102 -.032 .000 -.011 -.131 -.165 -.083
x7 -.079 .160 -.011 -.044 .059 -.131 .144 -.111
x8 -.195 .140 -.027 -.061 .087 -.165 .144 .078
x9 -.002 .082 -.058 -.030 -.098 -.083 -.111 .078
Extraction Method: Principal
Component Analysis.
a. Reproduced communalities
b. Residuals are computed between observed and reproduced correlations. There are 23
xcviii
Rotated Component Matrixa
Component
1 2 3
x4 .929
x8 .789
x6 .726
x1 .722
x3 .634 .538
x5 .916
x7 .826
x2 .446 -.674
x9 .473 .668
Extraction Method: Principal Component
Analysis.
Rotation Method: Varimax with Kaiser
Normalization.
a. Rotation converged in 4 iterations.
Component Score Coefficient Matrix
Component
1 2 3
x1 .218 .061 -.057
x2 .076 .313 -.476
x3 .133 .223 .051
x4 .334 -.136 .016
x5 -.162 .610 -.065
x6 .215 .021 .106
x7 .020 -.056 .490
x8 .344 -.301 -.055
x9 -.036 .209 .349
Extraction Method: Principal Component
Analysis.
Rotation Method: Varimax with Kaiser
Normalization.
xcix
Case Processing Summary
N %
Cases Valid 132 100.0
Excludeda 0 .0
Total 132 100.0
a. Listwise deletion based on all variables in the
procedure.
Reliability Statistics
Cronbach's
Alpha N of Items
.799 9
Item Statistics
Mean Std. Deviation N
x1 3.9848 .65364 132
x2 3.9924 .84254 132
x3 3.7652 .77025 132
x4 3.3712 1.29240 132
x5 3.7424 .74773 132
x6 4.3409 .90655 132
x7 3.7652 .69743 132
x8 3.7045 .89731 132
c
Item-Total Statistics
Scale Mean if
Item Deleted
Scale Variance if
Item Deleted
Corrected
Item-Total Correlation
Cronbach's
Alpha if Item
Deleted
x1 30.7955 18.286 .630 .767
x2 30.7879 19.436 .281 .806
x3 31.0152 16.916 .746 .748
x4 31.4091 13.541 .738 .741
x5 31.0379 19.472 .334 .798
x6 30.4394 16.447 .675 .753
x7 31.0152 20.229 .242 .807
x8 31.0758 17.948 .458 .784
x9 30.6667 19.796 .388 .792
Scale Statistics
Mean Variance Std. Deviation N of Items
ci
Correlation Matrixa
x1 x2 x3 x4 x5 x6 x7 x8 x9
Correlation x1 1.000 .291 .524 .684 .226 .576 .059 .305 .257
x2 .291 1.000 .327 .262 .324 .123 -.289 .401 -.089
x3 .524 .327 1.000 .594 .438 .629 .323 .319 .454
x4 .684 .262 .594 1.000 .147 .712 .174 .648 .221
x5 .226 .324 .438 .147 1.000 .277 .220 -.126 .388
x6 .576 .123 .629 .712 .277 1.000 .224 .312 .349
x7 .059 -.289 .323 .174 .220 .224 1.000 .157 .520
x8 .305 .401 .319 .648 -.126 .312 .157 1.000 .034
x9 .257 -.089 .454 .221 .388 .349 .520 .034 1.000
Sig.
(1-tailed)
x1 .000 .000 .000 .005 .000 .250 .000 .001
x2 .000 .000 .001 .000 .079 .000 .000 .156
x3 .000 .000 .000 .000 .000 .000 .000 .000
x4 .000 .001 .000 .046 .000 .023 .000 .006
x5 .005 .000 .000 .046 .001 .006 .076 .000
x6 .000 .079 .000 .000 .001 .005 .000 .000
x7 .250 .000 .000 .023 .006 .005 .036 .000
x8 .000 .000 .000 .000 .076 .000 .036 .348
x9 .001 .156 .000 .006 .000 .000 .000 .348