LAMPIRAN
Jenis Kelamin Responden
VAR00001
Frequency Percent Valid Percent Cumulative Percent
Valid
Pria 19 40.4 40.4 40.4
Wanita 28 59.6 59.6 100.0
Total 47 100.0 100.0
Usia Responden
VAR00001
Frequency Percent Valid Percent Cumulative Percent
Valid
>40 7 14.9 14.9 14.9
17-30 21 44.7 44.7 59.6
30-40 19 40.4 40.4 100.0
Correlations Kualitas Pelayanan Informasi
N 47 47 47 47 47 47 47 47 47 47 47
Butir 6
Pearson
Correlation .275 .316 *
Sig.
(2-tailed) .317 .195 .921 .020 .156 .020 .088 .013 .071 .007
N 47 47 47 47 47 47 47 47 47 47 47
Total
Pearson
Correlation .496 **
.556** .626** .439** .637** .772** .694** .640** .685** .614** .487** Sig.
(2-tailed) .000 .000 .000 .002 .000 .000 .000 .000 .000 .000 .001
N 47 47 47 47 47 47 47 47 47 47 47
**. Correlation is significant at the 0.01 level (2-tailed). *. Correlation is significant at the 0.05 level (2-tailed).
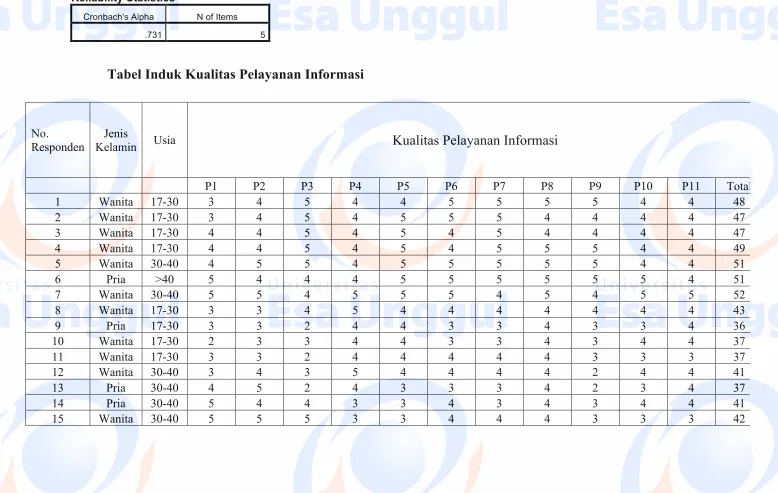
Reliability Statistics
Cronbach's Alpha N of Items
Correlations Loyalitas
Reliability Statistics
Cronbach's Alpha N of Items
.731 5
Tabel Induk Kualitas Pelayanan Informasi
No.
Responden
Jenis
Kelamin Usia
Kualitas Pelayanan Informasi
P1 P2 P3 P4 P5 P6 P7 P8 P9 P10 P11 Total
1 Wanita 17-30 3 4 5 4 4 5 5 5 5 4 4 48
2 Wanita 17-30 3 4 5 4 5 5 5 4 4 4 4 47
3 Wanita 17-30 4 4 5 4 5 4 5 4 4 4 4 47
4 Wanita 17-30 4 4 5 4 5 4 5 5 5 4 4 49
5 Wanita 30-40 4 5 5 4 5 5 5 5 5 4 4 51
6 Pria >40 5 4 4 4 5 5 5 5 5 5 4 51
7 Wanita 30-40 5 5 4 5 5 5 4 5 4 5 5 52
8 Wanita 17-30 3 3 4 5 4 4 4 4 4 4 4 43
9 Pria 17-30 3 3 2 4 4 3 3 4 3 3 4 36
10 Wanita 17-30 2 3 3 4 4 3 3 4 3 4 4 37
11 Wanita 17-30 3 3 2 4 4 4 4 4 3 3 3 37
12 Wanita 30-40 3 4 3 5 4 4 4 4 2 4 4 41
13 Pria 30-40 4 5 2 4 3 3 3 4 2 3 4 37
14 Pria 30-40 5 4 4 3 3 4 3 4 3 4 4 41
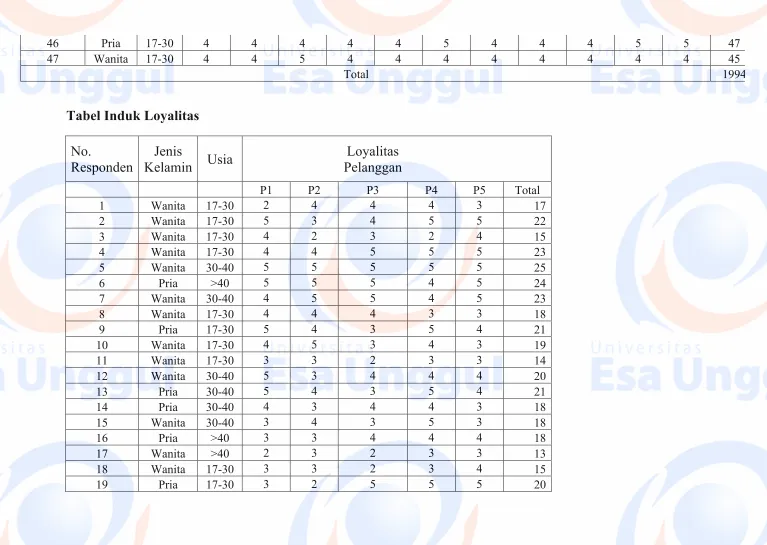
46 Pria 17-30 4 4 4 4 4 5 4 4 4 5 5 47
47 Wanita 17-30 4 4 5 4 4 4 4 4 4 4 4 45
Total 1994
Tabel Induk Loyalitas
Hasil Test Kualitas Pelayanan Informasi (n): 10
No
No Item Pernyataan
∑Responden 1 2 3 4 5 6 7 8 9 10 11 K
1 4 4 4 4 3 3 4 4 4 4 4 41
2 3 4 4 3 3 3 3 3 3 4 3 36
3 3 4 4 3 4 4 4 2 4 3 4 38
4 3 3 4 4 5 4 3 3 4 4 3 41
5 4 5 5 3 5 5 5 5 5 5 5 53
6 4 3 5 4 4 5 3 4 4 4 4 46
7 3 4 3 3 3 4 4 4 4 4 4 40
8 3 4 4 3 4 3 4 4 4 4 4 41
9 3 4 3 4 3 3 3 3 3 3 3 32
10 3 3 3 3 3 4 4 4 3 4 4 38
Hasil Retest Kualitas Pelayanan Informasi (n): 10
No
No Item Pernyataan
∑Responden 1 2 3 4 5 6 7 8 9 10 11 K
1 4 3 3 3 4 3 3 4 3 3 5 38
2 2 3 4 3 3 4 2 3 4 3 4 35
3 4 3 4 4 3 3 4 3 3 3 3 37
4 3 3 3 3 4 4 5 5 3 3 4 40
5 4 5 5 5 4 5 4 4 5 5 5 51
6 5 5 4 4 4 3 5 3 4 4 4 45
7 5 3 3 4 3 3 5 3 4 3 3 39
8 5 3 3 3 3 3 3 4 3 3 4 37
9 2 3 3 3 2 4 3 3 3 3 3 32
10 3 2 3 3 4 3 4 3 4 3 4 36
Hasil Kualitas Pelayanan Informasi n: (10)
R X X₁ X² X₁² XX₁
1 41 38 1681 1444 1558
2 36 35 1296 1225 1260
3 38 37 1444 1369 1406
4 41 40 1681 1600 1640
5 53 51 2809 2601 2703
6 46 45 2116 2025 2070
7 40 39 1600 1521 1560
8 41 37 1681 1369 1517
9 32 32 1024 1024 1024
10 38 36 1444 1296 1368
∑X = 406
∑X₁ =
390 ∑X² = 16.776
∑X₁² = 15.474
∑XX₁ = 16.106
(∑X)²= 164.836
Hasil Test Loyalitas Pelanggan n: (10)
No
No Item Pernyataan
∑Responden 1 2 3 4 5 K
1 3 3 3 3 3 15
2 3 3 3 4 3 16
3 3 4 4 3 3 17
4 4 4 4 4 3 19
5 3 3 2 3 2 13
6 3 3 3 3 2 14
7 3 3 3 3 3 15
8 3 4 4 4 3 18
9 2 3 2 2 3 12
10 3 3 4 3 3 16
Hasil Retest Loyalitas Pelanggan n: (10)
No
No Item Pernyataan
∑Responden 1 2 3 4 5 K
1 3 3 3 3 3 15
2 4 3 3 4 3 17
3 3 3 4 3 3 16
4 3 3 3 3 3 15
5 2 2 3 2 3 12
6 3 3 2 3 3 14
7 3 3 3 3 3 15
8 3 3 3 4 3 16
9 2 3 2 2 3 12
10 3 4 3 4 3 17
Hasil Loyalitas Pelanggan n: (10)
R Y Y₁ Y² Y₁² YY₁
1 15 15 225 225 225
2 16 17 256 289 272
3 17 16 289 256 272
4 19 15 361 225 285
5 13 12 169 144 156
6 14 14 196 196 196
7 15 15 225 225 225
8 18 16 324 256 288
9 12 12 144 144 144
10 16 17 256 289 272
∑Y = 155
∑Y₁ =
149 ∑Y² = 2.445 ∑Y₁² = 2.249 ∑YY₁ = 2.335
(∑Y)² = 24.025
Correlations
X Y
X
Pearson Correlation 1 .355*
Sig. (2-tailed) .014
N 47 47
Y
Pearson Correlation .355* 1 Sig. (2-tailed) .014
N 47 47
*. Correlation is significant at the 0.05 level (2-tailed).
a. Predictors: (Constant), X
Coefficientsa
Model Unstandardized Coefficients Standardized Coefficients