The Medium- Term Effects of
Scholarships in a Low- Income
Country
Deon Filmer
Norbert Schady
Filmer and SchadyA B S T R A C T
Despite progress in recent decades, a substantial fraction of children in developing countries attain little schooling, and many adults lack skills that are valued in the labor market. We evaluate the medium- term effects of a program that provided scholarships for three years to poor children upon graduation from elementary school in Cambodia, a low- income country. To do this we use a sharp regression discontinuity design. We show that scholarships have substantial effects on school attainment. By the time children would have been in grade 11 had they remained in school, two years after they stopped being eligible for scholarships, those who were offered scholarships have attained 0.6 more grades of completed schooling. Nevertheless, we fi nd no evidence that scholarships had signifi cant effects on test scores, employment, earnings, or the probability of getting married or having a child in adolescence.
I. Introduction
Despite progress in recent decades, a substantial fraction of children in developing countries attain little schooling, and many adults lack skills that are valued
Deon Filmer is a lead economist at the World Bank. Norbert Schady is the principal economic advisor for the Social Sector at the Inter- American Development Bank. They thank Felipe Barrera- Osorio, Luis Benveniste, Pedro Carneiro, Stephanie Cellini, Richard Murnane, Jamele Rigolini, T. Paul Schultz, three anonymous referees and various seminar participants for very helpful comments, as well as Beng Simeth, Tsuyoshi Fukao and the members of Scholarship Team of the Royal Government of Cambodia’s Ministry of Education for valu-able assistance in carrying out this work. Rodrigo Azuero and Haijing Huang provided outstanding research assistance. This work benefi ted from funding from the World Bank’s Research Support Budget (P094396; P095662); the Bank- Netherlands Partnership Program Trust Fund (TF055023); the Gender Action Plan Trust Fund (TF094922); and a Hewlett Foundation Trust Fund (TF096771). The fi ndings, interpretations, and conclusions expressed in this paper are those of the authors and do not necessarily represent the views of the World Bank or the Inter- American Development Bank, their Executive Directors, or the governments they represent. The data used in this article can be obtained beginning January 2015 though December 2017 from Deon Filmer at 1818 H Street NW Washington DC 20433, email dfilmer@worldbank.org.
[Submitted April 2012; accepted May 2013]
ISSN 0022- 166X E- ISSN 1548- 8004 © 2014 by the Board of Regents of the University of Wisconsin System
The Journal of Human Resources 664
in the labor market. For this reason, policymakers and academics continue to search for programs and policies that can raise educational attainment and learning in poor countries.
A number of interventions have recently been shown to increase school enrollment and attendance in some settings. These include merit- based scholarships (Kremer, Miguel, and Thornton 2009), deworming for school- aged children (Miguel and Kremer 2004), school construction (Dufl o 2001), the provision of additional teachers (Banerjee et al. 2007), vouchers for private schooling (Angrist et al. 2002; Angrist, Bettinger, and Kremer 2006), and conditional cash transfers—transfers that are made to poor house-holds, conditional on them keeping their children enrolled in school and attending regularly. (See the review by Fiszbein and Schady 2009.) Nevertheless, the evidence base on interventions that can effectively increase school attainment in poor countries is still thin. Of particular interest are evaluations that assess whether any effects that are observed in the short run are still apparent over a somewhat longer time horizon.
In this paper, we evaluate the medium- term effects of a program that provided scholarships to poor children upon graduation from elementary school in Cambodia, a low- income country. To do this we use a sharp regression discontinuity design that exploits the fact that eligibility for scholarships was determined on the basis of a composite measure that predicts the likelihood that a child would drop out of school. We present a variety of checks to support our identifi cation strategy.
Cambodia is one of the poorest countries in Asia. Most children enroll in primary school—the net primary school enrollment rate in Cambodia is 96 percent—but only a minority continues on to secondary school. The net secondary school enrollment rate is 35 percent, a fi gure that is more closely comparable to countries in sub- Saharan Africa like Mali (29 percent) and Malawi (28 percent) than to neighboring countries like Thailand (73 percent) and Vietnam (69 percent). To address these low enrollment rates, Cambodia has put in place a number of scholarship programs for children in lower secondary school (grades 7–9).
In earlier work, we have analyzed the short- term effects of scholarships on school enrollment. One scholarship program, known as the Japanese Fund for Poverty Reduc-tion (JFPR) program, increased school enrollment by 30 percentage points in grade 7 (Filmer and Schady 2008). That scholarship program was eventually discontinued and replaced by the program we analyze in this paper, known as the CESSP Scholarship Pro-gram (CSP).1 The CSP increased school enrollment rates in grade 8 by approximately 25 percentage points (Filmer and Schady 2011). These effects are substantially larger than those that have been reported for conditional cash transfer programs in Latin America, including the much- analyzed Mexican PROGRESA program—presumably, in part, be-cause of the much lower baseline school enrollment rates in Cambodia than in Mexico. (See Schultz 2004; Filmer and Schady 2011; Fiszbein and Schady 2009, pp. 128–29.)2
In this paper, we consider the effect of the CSP fi ve years after children started receiving scholarships. We show that scholarships have substantial effects on school attainment. By the time children would have been in grade 11 had they continued in school, two years after they stopped being eligible for scholarships, those who were
1. CESSP stands for Cambodia Education Sector Support Program.
Filmer and Schady 665
offered scholarships have attained 0.6 more grades of completed schooling. Never-theless, we fi nd no evidence that scholarships had signifi cant effects on test scores, employment, earnings, or the probability of getting married or having a child in ado-lescence. Because we focus on medium- term effects, our paper is closely related to a recent paper that analyzes the medium- term effects of PROGRESA (Behrman, Parker, and Todd 2011), and we discuss this in more detail in our conclusions.
The rest of the paper proceeds as follows. In Section II, we describe the CSP schol-arship program and the data. Section III discusses our identifi cation strategy. Section IV presents our main results. We conclude in Section VI.
II. The Program and Data
3A. Scholarships in Cambodia
Cambodia has a tradition of demand- side incentives that seek to raise school en-rollment and attendance at the secondary school level. There are several relatively small- scale programs that distribute bicycles, uniforms, and school materials to chil-dren in order to lower the travel and other direct costs associated with schooling. In addition, Cambodia has had a number of scholarship programs fi nanced by nongov-ernmental organizations (NGOs), international donors, and the government.
The CSP scholarship program, which we analyze in this paper, works as follows. The government fi rst selected 100 lower secondary schools throughout the country (from a total of approximately 800) to participate in the program. These CSP- eligible schools were chosen because they served poor areas, as indicated by a poverty map, and because there appeared to be high levels of school nonenrollment and dropout, as indicated by administrative data; schools covered by other scholarship programs were excluded. Next, each primary “feeder” school was mapped to a CSP- eligible secondary school.4
Finally, in every feeder school, all students in sixth grade, the last year of primary school, fi lled out an “application form” for the CSP scholarship program—regardless of whether children or their parents had expressed an interest in attending secondary school. Application forms consisted of 26 questions that were easy for sixth graders to answer and for other students and teachers to verify. In practice, the form elicited information on household size and composition; parental education; the characteristics of the home; availability of a toilet, running water, and electricity; and ownership of a number of household durables. Forms were fi lled out in school on a single day. Stu-dents and parents were not told beforehand of the questions on the forms nor were they ever told the scoring formula—both decisions designed to minimize the possibility of strategic responses (for example, by a student seeking to maximize her chances of receiving a scholarship). Head teachers in each school collected the completed forms
3. This section draws on Filmer and Schady (2009).
The Journal of Human Resources 666
and sent them to Phnom Penh, the capital. The median age of children when they completed the application survey was 14; the tenth percentile of the distribution was 12; and the 90th percentile 16.
We worked closely with offi cials from the Ministry of Education in Cambodia to design a process that assigned CSP scholarships on the basis of the information on the application forms. We hired an independent fi rm to digitize the information on the application forms, and provided the weights used to aggregate responses on the form into a composite “dropout- risk score.”5
Separately for each CSP school, applicants were then ranked by their dropout- risk score. As requested by the Ministry, in “large” CSP schools, with total enrollment above 200, 50 students with the highest value of the score were then offered a scholar-ship for grades 7, 8, and 9; in “small” CSP schools, with total enrollment below 200 students, 30 students with the highest value of the score were offered scholarships. In total, just over 3,800 scholarships were offered.6
The list of students offered scholarships was posted in each CSP school, as well as in the corresponding feeder schools. The program allowed for a complaints mecha-nism if an applicant felt they had been wrongly denied a scholarship but there were virtually no revisions made as a result of this process. We closely monitored every step in the process whereby application forms were fi lled out, dropout scores calculated, and schools given the list of scholarship recipients.7
Children who were offered a scholarship were automatically eligible to receive it for grades 7, 8, and 9 unless they repeated a grade or dropped out of school, in which case the scholarship was withdrawn. Two- thirds of the scholarships were given to girls; this is because girls were more likely than boys to drop out of school in Cambodia, which was factored into the dropout- risk score. The value of the scholarship was equivalent to US $45.8 This is roughly 2 percent of the total consumption of the average recipient
5. All of the variables in the scholarship application form had also been collected in previous nationally - representative household surveys. Using the most recently available Cambodia Socio- Economic Survey, Demographic and Health Survey, and Cambodia Child Labor Survey, we ran regressions of grade 7 enroll-ment, conditional on grade 5 completion, in a sample of 12–17- year- olds, on the variables in the application form. We used the coeffi cients from this regression to construct the weights given to individual responses on the application form. All application forms were double- entered. We verifi ed the code used by the fi rm to code individual questions, and to calculate the aggregate dropout- risk score.
6. When there were tied scores at the eligibility cutoff all applicants with the tied score were offered a scholarship.
7. The fi nal list of scholarship recipients was included in an offi cial government proclamation (“Prakas”) for each CSP school. We cross- checked the list on the “Prakas” against a list that we produced independently based on the applicant database. There were no discrepancies (allowing for a handful of adjustments based on the public comment phase).
Filmer and Schady 667
household in Cambodia, and is almost exactly equal to the direct cost of schooling, including fees, uniforms, supplies, and transportation but excluding the opportunity cost of going to school (Ferreira, Filmer, and Schady 2009).
B. Data
We make use of two sources of data in this paper. The fi rst data set includes the compos-ite dropout- risk score, as well as the individual characteristics that make up the score for all 26,537 scholarship applicants. The second data set is based on a household survey we fi elded, and which collected information on 3,020 applicants and their families.
The sample for the survey was constructed as follows. First, we purposefully se-lected fi ve provinces in different parts of the country where the program was operat-ing, and where there were a reasonably large number of program schools. In total, there were 57 program schools in these fi ve provinces: Battambang (9), Kampong Thom (14), Kratie (4), Prey Veng (25), and Takeo (5). Second, within each school, the survey sample included all children who had been offered scholarships (30 or 50 children, depending on whether a school had been designated as “small” or “large”) and 20 children who had been turned down for scholarships, beginning with the “fi rst” child turned down for a scholarship (the child whose score was just below the cutoff for eligibility) and up to the 20th child.9
Data were collected between February and April of 2010, almost fi ve years after chil-dren fi lled out the application forms.10 For applicants enrolled in school who had not repeated grades, the household survey therefore refers to school attendance in the second half of grade 11. The median age of children at the time of the household survey was 19.
The household survey collected information on a large number of child outcomes. Children were asked about the highest grade of schooling they had completed to date, whether they were enrolled in school in each academic year between 2005 (when they completed the applications) and 2010 (at the time of the survey), and, if so, in what grade. They were also asked whether they were currently working (separate questions for work for pay and work without pay), their earnings over the last pay period, and how many hours they worked in the last week.
We administered three tests during the household survey. The fi rst is a math test, which included 20 multiple choice items. Areas covered included algebra, geometry, and several questions that required using mathematical tools to answer simulated real world situations—including reading a simple graph or interpreting a bar chart. The test included mathematical concepts that students would have been exposed to over
9. Between October and December 2006, we fi elded a “midline” survey that is the basis of our earlier work on the CSP scholarship program (Filmer and Schady 2011). The sample for this midline survey was con-structed in the same way as described above for the “endline” survey we use in the current paper. During the midline, if the survey fi rm could not contact an applicant after several attempts, they were provided a list of “replacements.” These were selected from those with the next lower dropout- risk scores below those already on the list (for example, if either a scholarship recipient or one of the 20 “fi rst” children denied scholarships could not be found, the 21st child denied a scholarship was given as a replacement). The endline survey
included these “replacements” in the list of applicants that the fi rm was supposed to contact.
The Journal of Human Resources 668
the lower secondary school cycle.11 The second test was a vocabulary test based on picture recognition. This test asked respondents to identify the picture corresponding to a word which the enumerator read out loud. For each word the respondent was then asked to select from a choice of four pictures. While the initial words are relatively easy to identify (“shoulder,” “arrow,” “hut”) the test is structured such that items be-come increasingly diffi cult. (Later words in the test we administered included, for example, “speed,” “selecting,” “adjustable”.) There were in total 72 words that each applicant was asked to identify. The third test is a test of puzzles and shapes loosely based on the Ravens Progressive Matrices.12 These tests are not linked to the curricu-lum taught in Cambodia’s lower secondary schools. We normalize the scores on all three tests by subtracting the mean and dividing by the standard deviation of nonre-cipients. The Cronbach alpha values for all of our tests are reasonably high—0.68 for the math test, 0.90 for the vocabulary test, and 0.65 for the test of puzzles and shapes.13
The household survey also collected data on adolescent mental health using an ad-aptation of the Center for Epidemiological Studies Depression scale (CESD), a widely used measure of depression (Radloff 1977).14 Subjective social status was assessed using the “MacArthur ladders.”15 Adolescents were shown a picture of a ladder with ten rungs, and were told that higher rungs correspond to higher socioeconomic status. They were asked to place themselves on the ladder in relation to everyone in their communities, and in relation to everyone in Cambodia. Finally, we asked respondents if they were married or had children.
III. Identi
fi
cation Strategy
The identifi cation strategy we use in this paper is based on regression discontinuity (RD). These regressions take the following form:
(1) Yis = αs + f(Cs) +βI(Tis = 1)+ εis
where Yis is an outcome (for example, school enrollment, or the grades of completed schooling) for child i who applied to CSP school s; αs is a set of fi xed effects for lower
11. The test questions ranged from simple addition and subtraction of two- and three- digit numbers, reading the numbers off a bar chart or a graph, interpreting the area of shapes on a grid, manipulating fractions, and completing a progressive sequence of shapes.
12. The Ravens has been applied in many settings in the developing world. It is considered a test of cogni-tive capacity or general intelligence, and it is therefore not clear whether we would expect scholarships to improve scores on this test.
13. Cronbach’s alpha is the average covariance across the item responses, divided by the sum of the average variance of all items plus the average covariance across all items. It is often used as a measure of the reli-ability of a test, although it is best interpreted here as the extent to which the various items on the test capture a single underlying concept (such as ability).
14. Specifi cally, the survey included 12 questions about mental health (such as “Over the past month have you been feeling unhappy or depressed?”), which respondents answered as “always,” “sometimes,” or “never,” which we code with values of 1, 2, or 3. The total score is then the sum of all 12 scores, normalized by subtracting the mean and dividing by the standard deviation of nonrecipients. Our results are robust to different ways of aggregating the individual responses.
Filmer and Schady 669
secondary schools; f(Cs) is a fl exible formulation of the control function; I(Tis = 1)is an indicator variable that takes on the value of one if a child was offered a CSP schol-arship; and εis is the regression error term. In this set- up, the coeffi cient β is a measure of the impact of the scholarship. To allow for different slopes, we interact the control function with the indicator variable for children who were eligible for scholarships. Standard errors are clustered at the level of the primary feeder school.
Unusually, in our application of RD there are 57 school- specifi c cutoffs, rather than a single cutoff, and the cutoff falls at different values of the dropout- risk score in different schools.16 (We return to this point in our discussion of heterogeneity below.) This raises the question of how best to pool the results from what are, in effect, 57 separate applications of RD. One way to address this challenge would be to normal-ize the dropout- risk score by subtracting the value of the score at the school- specifi c cutoff. However, this gives a score of exactly zero to at least one applicant in each school (more if there are tied scores), and mechanically results in a piling of mass at the cutoff. To avoid this, we normalize the cutoff in each school as the value of the score that is the midpoint between the scores of the last scholarship recipient and the fi rst nonrecipient in that school.17 Also, to ensure that identifi cation is based on comparisons of scholarship recipients and nonrecipients within schools, not across schools, we include school fi xed effects.
The dropout- risk score perfectly predicts whether an applicant was offered a schol-arship, with the exception of a very small number of changes that resulted from the public complaint mechanism. This is therefore a case of sharp (as opposed to fuzzy) RD. Also, because we focus on the impact of being offered a scholarship, rather than that of actually taking up a scholarship, these are Intent- to- Treat (ITT) estimates of program impact. (For convenience, in the paper we interchangeably refer to children with values of the dropout- risk score above the cutoff, all of whom were offered scholarships, as children who were eligible for scholarships, recipients, or treated children.)
As in other applications of RD, it is important to ensure that results are not driven by a particular parametrization of the control function. Following Lee and Lemieux (2010), we present results based on two ways of implementing RD. The fi rst approach uses data on all children in the household survey. In this approach, the estimation choice revolves around the selection of the polynomial in f(Cs). We follow Lee and Lemieux (2010) and use both the Akaike information criterion (AIC) and bin re-gressions to select the optimal order of polynomial. As it turns out, both approaches produce very similar results, and in virtually every case, no matter which dependent variable, the optimal order of the polynomial is one (meaning that the control func-tion is linear in the score, with slopes that can be different on each side of the cutoff ). Nevertheless, to ensure that our results do not depend on the choice of polynomial, we
16. Because the number of scholarship recipients is fi xed in “small” and “large” schools, as discussed above, the value of the dropout- risk score at the cutoff will on average be higher in schools that received more ap-plications and in schools which serve poorer children.
The Journal of Human Resources 670
also present results for polynomial order two (with quadratic terms interacted with the indicator variable for scholarship recipients).18
The second approach, based on local linear regressions (LLRs), restricts the sample to those who are relatively “close to” the cutoff. In this approach, the estimation choice revolves around the selection of the bandwidth around the cutoff. Here too we follow Lee and Lemieux (2010) and present results based on a rule- of- thumb (ROT) selection of bandwidth, as well as a cross- validation (or “leave- one- out”) procedure. (In the ROT approach we use a rectangular kernel and follow the estimation steps detailed in Imbens and Kalyanaraman 2012.) Based on these calculations, we estimate that the optimal bandwidth is between four and eight, depending on the outcome in question. To avoid presenting different bandwidths in different tables, we report results from LLRs with a bandwidth of six for all outcomes, but generally also report results with a bandwidth of three (half the optimal) and 12 (twice the optimal). As we show below, our results are not sensitive to the selection of polynomial or the selection of bandwidth in the LLRs.
There are two main threats to our identifi cation strategy: attrition and manipulation of the dropout- risk score. Attrition is a potential source of concern because the fi rm that col-lected the household survey was given a list of households to visit on the basis of the roster of children who had completed the application form in 2005, but not all of these households could be located in 2010 (for example, if the information regarding the name or place of residence on the application form was inaccurate or if a household had moved to another province). In practice, almost fi ve years after students fi lled out their scholar-ship application forms (as described above), 14.1 percent of children on the list given to the fi rm could not be located. We note that these values are comparable to those for other surveys in developing countries—for example, Behrman, Parker, and Todd (2011) report an attrition rate of 14 percent for their analysis of medium- term effects of PROGRESA transfers.
Figure 1 graphs the proportion attrited as a function of the normalized dropout- risk score.19 Attrition is higher among scholarship recipients, who are poorer, but there is no evidence of a discrete jump in attrition at the cutoff that determines eligibility for scholarships. We conclude that it is unlikely that attrition is a source of bias for our estimates of scholarship effects.20
An identifying assumption for RD is that, conditional on a fl exible parametrization of the control function, there is no discrete jump at the cutoff in characteristics
(includ-18. We also calculated results for polynomial order zero, which is equivalent to a simple comparison of mean outcomes for children who were offered scholarships and those who were turned down. We do not report these results as they make no adjustment for differences in socioeconomic status between scholarship recipients and nonrecipients.
Filmer and Schady 671
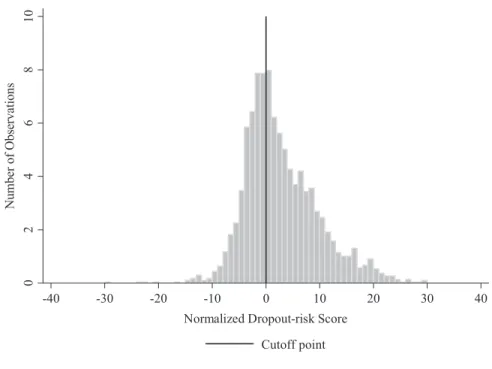
ing unobservables) that could be correlated with the regression error term. Although one cannot test this assumption directly, we provide two standard RD identifi cation checks. (See Imbens and Lemieux 2008; Lee and Lemieux 2010.) The fi rst checks for unusual heaping of mass at the cutoff. Figure 2 graphs the proportion of observations in 60 bins of the normalized dropout- risk score. The fi gure shows no unusual heaping of mass above or below the cutoff for scholarship eligibility.21
21. McCrary (2008) proposes a formal test of the log difference in the heights of the bins corresponding to observations just to the right and to the left of the cutoff. On the basis of this test, we fail to reject the null of equal mass on both sides of the cutoff. (The regression coeffi cient is 0.118, with a standard error of 0.075.)
0
.1
.2
.3
Probability of Attrition
-25 -15 -5 5 15 25
Normalized Dropout-risk Score
Figure 1
Analysis of Attrition
The Journal of Human Resources 672
A second standard check on RD involves regressions of predetermined character-istics on the indicator value for treatment (in our case, children who were offered scholarships) and the control function. In general, if the RD design is valid, we would expect the coeffi cient on the treatment indicator in these “placebo” regressions to be small and not signifi cant.
Table 1 presents results of these regressions for a number of variables from the household survey that are arguably fi xed—including the gender and age of applicants, education levels of all adults in the household, and various measures of household composition. In the polynomial order one regressions and the LLRs with a bandwidth of six, none of the coeffi cients are signifi cant at the 5 percent level or higher. We conclude that the RD approach we take in this paper is valid, and is likely to provide causal estimates of the medium- term effects of scholarships.
IV. Results
A. Effects on Enrollment and Grades of Completed Schooling
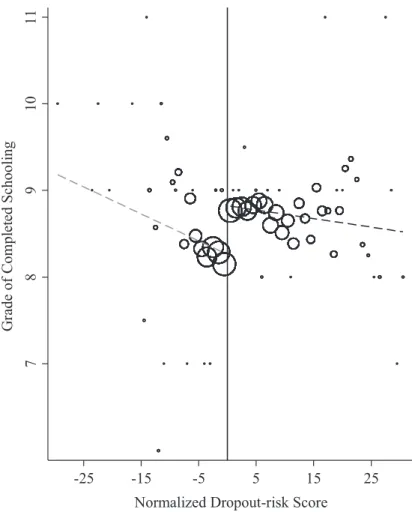
Figure 3 graphs the mean grades attained by scholarship recipients and nonrecipi-ents in 2010, almost fi ve years after both groups completed application forms, and two years after recipients stopped being eligible for scholarships. The fi gure shows a clear jump in grade attainment at the cutoff, equivalent to about half of an additional
0
2
4
6
8
10
Number of Observations
-40 -30 -20 -10 0 10 20 30 40
Normalized Dropout-risk Score
Cutoff point
Figure 2
Filmer and Schady
673
Table 1
Applicant Household Characteristics at Endline
Polynomial Regression Local Linear Regression
Order: 1 Order: 2 Bandwidth = 6 Bandwidth = 3 Bandwidth = 12
Gender –0.051* –0.044 –0.055 –0.032 –0.049
(n= 2973) (0.027) (0.033) (0.039) (0.060) (0.029)
Age –0.038 0.054 –0.100 0.048 –0.012
(n = 2971) (0.073) (0.093) (0.117) (0.160) (0.085)
Household head education 0.276 –0.087 –0.366 –0.381 –0.003
(n = 2706) (0.225) (0.251) (0.317) (0.466) (0.233)
Household spouse education –0.235 –0.425* –0.484* –0.822** –0.338
(n = 2013) (0.166) (0.220) (0.260) (0.376) (0.212)
Household highest education 0.137 –0.068 –0.194 –0.175 –0.008
(n = 2884) (0.216) (0.256) (0.325) (0.442) (0.241)
Household mean education 0.096 –0.141 –0.375 –0.400 –0.055
(n = 2884) (0.154) (0.184) (0.230) (0.320) (0.169)
Number of children 6–11 0.004 –0.027 –0.046 –0.002 –0.026
(n = 2973) (0.047) (0.061) (0.072) (0.123) (0.055)
Number of boys 6–11 –0.036 –0.037 –0.033 0.020 –0.035
(n = 2973) (0.031) (0.044) (0.053) (0.081) (0.041)
Number of girls 6–11 0.040 0.010 –0.013 –0.021 0.009
(n = 2973) (0.032) (0.042) (0.048) (0.078) (0.038)
Number of children 12–18 –0.016 0.037 0.078 0.069 0.032
(n = 2973) (0.053) (0.070) (0.081) (0.129) (0.062)
The Journal of Human Resources
674
Polynomial Regression Local Linear Regression
Order: 1 Order: 2 Bandwidth = 6 Bandwidth = 3 Bandwidth = 12
Number of boys 12–18 –0.064 –0.075 –0.080 –0.077 –0.065
(n = 2973) (0.054) (0.061) (0.073) (0.097) (0.056)
Number of girls 12–18 0.048 0.111* 0.158** 0.147 0.097*
(n = 2973) (0.046) (0.058) (0.065) (0.111) (0.054)
Number of adults 18–25 –0.012 0.033 0.044 –0.048 0.028
(n = 2973) (0.054) (0.072) (0.087) (0.146) (0.067)
Number of adults >25 –0.046 –0.077 –0.081 –0.173 –0.057
(n = 2973) (0.051) (0.067) (0.088) (0.132) (0.062)
Notes: Coeffi cients and standard errors from regression of a given characteristic on indicator variable for children with dropout–risk score above the cutoff. Polynomial regres-sion order 1 includes dropout-risk score and its interaction with the indicator for children with scores above the cutoff; polynomial regresregres-sion order 2 includes dropout-risk score and its square, and interactions with the indicator for children with scores above the cutoff; choice of bandwidth for Local Linear Regressions described in body of paper. Standard errors cluster at level of primary feeder school. Highest / mean education calculated by taking the maximum / average of education in years per household, only including household members over age 25.
*** p-value < 0.01, ** p-value < 0.05, * p-value < 0.1.
Filmer and Schady 675
grade of completed schooling. Table 2 reports the results from polynomial regressions and LLRs of grade attainment on the indicator variable for scholarship recipients and the control function. The results suggest a scholarship impact of about 0.6 grades of schooling, relative to a control group mean of 8.35 grades.
Table 3 and Figure 4 summarize the results from a number of robustness checks on the results in Table 2. In Figure 4 we present the coeffi cient and 95 percent confi dence interval on the scholarship indicator for LLRs with bandwidths ranging from 1 to 30. The fi gure clearly shows that the results are insensitive to bandwidth choice. As expected, estimates become more precise with larger bandwidths.
7
8
9
10
11
G
rade of
C
o
m
p
le
te
d School
in
g
-25 -15 -5 5 15 25
Normalized Dropout-risk Score
Figure 3
Scholarship Effects on Grades of Completed Schooling
The Journal of Human Resources
676
Table 2
Scholarship Effects on Years of Completed Schooling
Mean: Control Group
Polynomial Regression Local Linear Regression
Order: 1 Order: 2 Bandwidth = 6 Bandwidth = 3 Bandwidth = 12
Grades of completed schooling 8.35 0.560*** 0.625*** 0.598*** 0.587*** 0.635***
(0.101) (0.127) (0.140) (0.210) (0.114)
N 2,973 2,973 1,869 1,082 2,595
Notes: Coeffi cients and standard errors from regression of grades of completed schooling on indicator variable for children with dropout-risk score above the cutoff. Polyno-mial Regression Order 1 includes dropout-risk score and its interaction with the indicator for children with scores above the cutoff; PolynoPolyno-mial Regression Order 2 includes dropout-risk score and its square, and interactions with the indicator for children with scores above the cutoff; choice of bandwidth for Local Linear Regressions described in body of paper. Standard errors cluster at level of primary feeder school.
Filmer and Schady 677
Table 3
Robustness Checks
Interviewed at Midline
With Controls
Donut (1,1)
Donut (2,2)
Grades of completed 0.563*** 0.581*** 0.522*** 0.480***
schooling (0.101) (0.097) (0.123) (0.149)
N 2,944 2,973 2,503 2,084
Notes: Coeffi cients and standard errors from regression of grades of completed schooling on indicator vari-able for children with dropout-risk score above the cutoff, including secondary school fi xed effects. All regressions based on polynomial order 1 specifi cation. Specifi cation in second column includes all controls in Table 1. Standard errors cluster at level of primary feeder school.
*** p-value < 0.01, ** p-value < 0.05, * p-value < 0.1.
0
.5
1
1.
5
Estimated Scholarship Impact on Grades Completed
0 2 4 6 8 10 12 14 16 18 20 22 24 26 28 30
Bandwidth
Figure 4
Scholarship Effects on Grades of Completed Schooling, Varying Bandwidths
The Journal of Human Resources 678
Additional robustness checks based on the polynomial order 1 regressions are in Table 3. One possible concern with our estimates is reporting bias—specifi cally, that scholarship recipients may be more likely to overstate the grades of completed school-ing they have attained than nonrecipients. In earlier work (Filmer and Schady 2011) on the short- term effect of scholarships we collected self- reported school enrollment data in a household survey conducted in late 2006, approximately 18 months after children fi lled out the application forms, as well as school attendance data from four unan-nounced school visits we conducted in 2006 and 2007. We showed that the estimated effect of scholarships on enrollment was very similar using both sources of data, sug-gesting that scholarship recipients were no more likely to overstate their school enroll-ment than nonrecipients, at least in the short run. As a robustness test on the results in Table 2 we run regressions using the 2010 household survey data but limit the sample to children who were also interviewed in 2006 (and for whom, as discussed above, we had earlier found no evidence of reporting bias). These results are in Column 1 of Table 3. Not surprisingly, given that 99 percent of the children we interviewed in 2010 were also interviewed in 2006, excluding children who were not interviewed in 2006 has no bearing on our results.
The following column in Table 3 reports the results from a specifi cation that includes the controls in Table 1. Including these controls does not substantially alter the results. As a fi nal specifi cation check, we report the results from a “donut” esti-mator proposed by Barreca et al. (2011). Barreca et al. point out that the motivating assumption for RD is a comparison of means approaching the cutoff (rather than a comparison of means at the cutoff itself ). Because any manipulation of eligibility is most likely to occur around the cutoff, Barreca et al. suggest it is useful to check whether RD results are robust to symmetrically discarding observations in the im-mediate vicinity of the cutoff. In Column 3 of Table 3 we report the results from regressions that exclude children whose score places them within one full point of the cutoff; this is equivalent to dropping observations in the two bins that are closest to the cutoff in Figure 2. In Column 4 we exclude those with scores within two points of the cutoff; this is equivalent to dropping observations in the four bins that are closest to the cutoff in Figure 2. These results suggest a scholarship impact of about 0.5 grades of schooling. In sum, the results in Figure 4 and Table 3 show that our main results on grade attainment are robust to a variety of specifi cation checks.
In Table 4, we use retrospective questions in the household survey to estimate program effects on school enrollment in grades 7–11. For this purpose, we defi ne the dependent variable in two alternative ways. In the fi rst set of specifi cations, the dependent variable takes on the value of one if a child is enrolled in a given school year, no matter what grade she is enrolled in, and zero otherwise; in the second set of specifi cations, the dependent variable takes on the value of one if a child is enrolled in school in the appropriate grade in a given school year (for example, enrolled in grade 7 in 2005–2006, enrolled in grade 8 in 2006–2007, and so on), and zero otherwise. These specifi cations therefore also account for any effect the scholarship may have had on grade repetition (in addition to the effect on school enrollment).
Filmer and Schady 679
in grade 7 to 18 percent in grade 11. Second, the differences between the means in the two columns are modest, suggesting that there is relatively little grade repetition in this sample.
The remaining columns in Table 4 provide our estimates of scholarship effects. We limit the discussion to the coeffi cients from the polynomial order one and the LLRs with a bandwidth of six, although we note that other results in the table are generally similar. In grade 7, where counterfactual enrollment rates are high, the impact of the scholarship is modest—nine to ten percentage points in our preferred specifi cations. In grades 8 and 9, program effects are substantial, 18 to 20 percentage points.22 Pro-gram effects in grade 10 are smaller, between seven and eight percentage points, but these represent increases of almost one- third, relative to the control group mean of 23 percent for age- appropriate school enrollment. The results in the last row show even smaller effects on school enrollment in grade 11, and these are not signifi cant at con-ventional levels in our preferred specifi cations. In sum, and consistent with the results on grade attainment discussed earlier, the results in Table 4 show substantial program effects on school enrollment.
B. Effects on Learning Outcomes
We next turn to program effects on the tests of vocabulary, math, and puzzles and shapes. Note that these tests were applied to children in their homes, regardless of whether they were enrolled in school or not. Also, nonresponse rates on all three tests are negligible—only three children missed the math test, one child missed the test of puzzles and words, and no children missed the vocabulary test. This considerably simplifi es estimation, as there is no need to correct for nonresponse or for the effect of scholarships on school enrollment, a complication with school- based tests. (See, for example, the analysis in Angrist et al. 2002; Angrist, Bettinger, and Kremer 2006 of a school voucher program in Colombia.) The reduced- form estimates we report in Table 5 below are therefore the impact of the scholarships on test scores, inclusive of any program effects on grade attainment, any income effects, any program effects on other determinants of learning, such as motivation or effort expended in school, and any Hawthorne effects. (For example, if children who were offered scholarships chose to put more effort into test- taking than those who were turned down for scholarships.) To motivate our results, we fi rst note that children with more grades of completed schooling do better on all three tests. Among children who were turned down for scholarships, an additional grade of schooling is associated with a 0.21 standard de-viation better performance on the test of math (with a standard error of 0.02), a 0.23 standard deviation better performance on the vocabulary test (with a standard error of 0.02), and a 0.13 standard deviation higher score on the test of puzzles and shapes (with a standard error of 0.02).23 As is well understood, these associations need not be causal, as they could in part refl ect the selection of higher- ability children into higher
22. In our earlier work we use a household survey carried out in 2006 and data from unannounced school visits, and report similar effects on school enrollment, between 23 and 28 percentage points (Filmer and Schady 2011).
The Journal of Human Resources
680
Table 4
Scholarship Effects on School Enrollment, Various Years
Polynomial Regression
Mean: Control Group Order : 1 Order: 2
1 2 1 2 1 2
Enrollment 2005–2006 (grade 7) 0.915 0.913 0.090*** 0.088*** 0.104*** 0.100***
(0.013) (0.013) (0.017) (0.017)
Enrollment 2006–2007 (grade 8) 0.598 0.594 0.197*** 0.197*** 0.189*** 0.187***
(0.029) (0.029) (0.038) (0.038)
Enrollment 2007–2008 (grade 9) 0.405 0.401 0.175*** 0.174*** 0.174*** 0.173***
(0.031) (0.031) (0.041) (0.041)
Enrollment 2008–2009 (grade 10) 0.247 0.231 0.081*** 0.081*** 0.087*** 0.099***
(0.026) (0.027) (0.031) (0.031)
Enrollment 2009–2010 (grade 11) 0.205 0.178 0.032 0.031 0.044 0.077***
(0.024) (0.026) (0.029) (0.028)
Filmer and Schady
681
Local Linear Regression
Bandwidth = 6 Bandwidth = 3 Bandwidth = 12
1 2 1 2 1 2
Enrollment 2005–2006 (grade 7) 0.104*** 0.100*** 0.125*** 0.124*** 0.099*** 0.095***
(0.019) (0.020) (0.028) (0.030) (0.017) (0.017)
Enrollment 2006–2007 (grade 8) 0.194*** 0.192*** 0.209*** 0.209*** 0.207*** 0.206***
(0.043) (0.044) (0.068) (0.068) (0.034) (0.034)
Enrollment 2007–2008 (grade 9) 0.181*** 0.182*** 0.141** 0.141** 0.177*** 0.176***
(0.045) (0.045) (0.067) (0.067) (0.036) (0.037)
Enrollment 2008–2009 (grade 10) 0.069* 0.080** 0.064 0.087 0.096*** 0.102***
(0.036) (0.036) (0.055) (0.054) (0.029) (0.029)
Enrollment 2009–2010 (grade 11) 0.030 0.053 0.035 0.061 0.052* 0.066**
(0.034) (0.033) (0.051) (0.049) (0.027) (0.026)
N 1,869 1,082 2,595
Notes: Coeffi cients and standard errors from regression of school enrollment on indicator variable for children with dropout-risk score above the cutoff. Secondary school
fi xed effects are included. In Specifi cations 1 the dependent variable is school enrollment in that year; in Specifi cations 2 the dependent variable is age-appropriate school enrollment in that year. Polynomial Regression Order 1 includes dropout-risk score and its interaction with the indicator for children with scores above the cutoff; Polynomial Regression Order 2 includes dropout-risk score and its square, and interactions with the indicator for children with scores above the cutoff; choice of bandwidth for Local Linear Regressions described in body of paper. Standard errors cluster at level of primary feeder school.
The Journal of Human Resources
682
Table 5
Scholarship Effects on Test Scores
Mean: Control Group
Polynomial
Regression Local Linear Regression
Order: 1 Order: 2 Bandwidth = 6 Bandwidth = 3 Bandwidth = 12
Puzzles and shapes 0.000 –0.003 –0.035 –0.013 0.047 –0.007
(0.060) (0.081) (0.086) (0.128) (0.072)
Verbal 0.000 0.005 0.005 0.063 0.035 0.041
(0.057) (0.073) (0.079) (0.128) (0.067)
Math 0.000 0.033 –0.016 0.008 0.015 0.023
(0.061) (0.072) (0.087) (0.126) (0.066)
Average (all) 0.000 0.011 –0.006 0.049 0.040 0.036
(0.059) (0.075) (0.080) (0.129) (0.068)
N 1,154 2,973 2,973 1,869 1,082 2,595
Filmer and Schady 683
grades. Nevertheless, the fact that there is an association between grades attained and test scores makes it more likely that scholarships would also increase test scores.
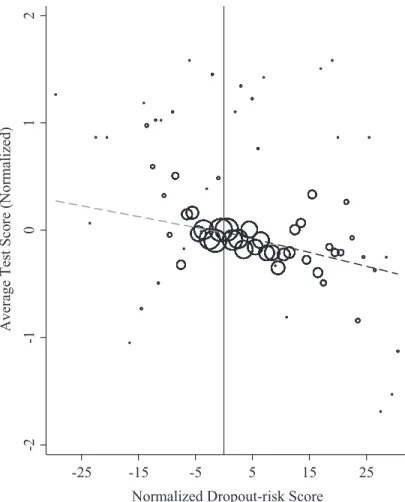
Figure 5 graphs the test score averaged across the three tests at different values of the dropout- risk score.24 The fi gure shows that, as expected, children with lower values of the score generally do better on the tests. However, there is no jump in test scores at the cutoff for scholarship eligibility. In Table 5 we report the coeffi cients
24. The average has been normalized so that it, too, has a mean of zero and a standard deviation of one.
-2
-1
0
1
2
A
v
er
age Tes
t Sco
re (Normalized)
-25 -15 -5 5 15 25
Normalized Dropout-risk Score
Figure 5
Scholarship Effects on Average Test Scores
The Journal of Human Resources 684
and standard errors for scholarship recipients for regressions of different tests, as well as the average effect on all tests. There is no evidence that the scholarship program improved scores on any test. For the average across all three tests, and based on the polynomial specifi cation with order one, we can rule out effect sizes of 0.13 standard deviations or larger with 95 percent confi dence.25
In sum, our results show that, in spite of a substantial effect on grades of completed schooling, scholarships did not improve test scores. One possible explanation for these results is that schooling in Cambodia generally has little effect on learning outcomes. An alternative, more subtle, possibility is that there are differences in the latent distri-bution of test scores between children who were brought into school by the scholarships and other children. This explanation is consistent with selection into schooling on the basis of expected gains (Willis and Rosen 1979; Heckman, Urzúa, and Vytlacil 2006; Carneiro and Lee 2011). In the absence of scholarships, children with higher ability could be more likely to stay in school than lower- ability children because for them the expected returns are high; higher- ability children also learn more while in school. Conversely, lower- ability children, for whom the expected returns to school are low, could be more likely to drop out of school; these children would not have learned much had they stayed in school. The scholarship program lowers the costs of education for recipients, and some of the lower- ability children who under normal circumstances would have dropped out now stay in school. However, the test performance of these children is not improved by their additional schooling. Although we believe this expla-nation is plausible, we do not have the data that would allow us to test it convincingly. We note, however, that in their evaluation of PROGRESA in Mexico, Behrman, Parker, and Todd (2009) also fi nd program effects on grade attainment but not on test scores.
C. Heterogeneity
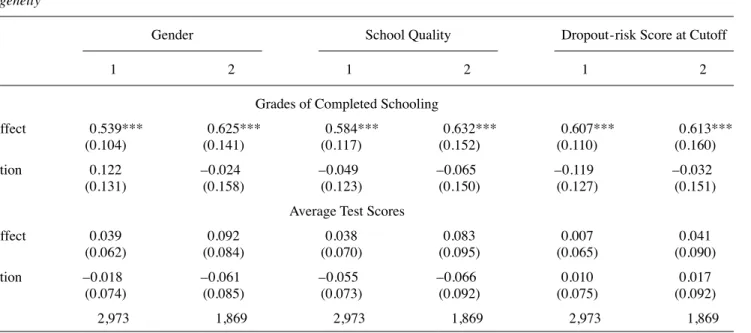
We next turn to a discussion of heterogeneity in program effects, focusing on gender, school quality, and the value of the dropout- risk score at the school- specifi c cutoff. These results are presented in Table 6 and Figures 6 and 7. To keep the number of results manageable, we focus on the values from polynomial regressions of order one, and LLRs with a bandwidth of six. In each case, the table reports the coeffi cient on the main scholarship effect, and the coeffi cient on an interaction between scholarship recipients and a given characteristic—for example, in the lefthand panel, the coef-fi cient in the second row corresponds to the interaction between scholarship recipients and an indicator variable for girls. The top panel of the table reports effects on grades of completed schooling, and the bottom panel reports effects on average test scores.
The lefthand panel of Table 6 shows there is no evidence that the scholarship pro-gram had differential effects by gender. The main effects are very similar to those in Tables 2 and 5, and the interaction between the indicator variable for girls and scholar-ship recipients is not signifi cant.
Filmer and Schady
685
Table 6
Heterogeneity
Gender School Quality Dropout-risk Score at Cutoff
1 2 1 2 1 2
Grades of Completed Schooling
Main effect 0.539*** 0.625*** 0.584*** 0.632*** 0.607*** 0.613***
(0.104) (0.141) (0.117) (0.152) (0.110) (0.160)
Interaction 0.122 –0.024 –0.049 –0.065 –0.119 –0.032
(0.131) (0.158) (0.123) (0.150) (0.127) (0.151)
Average Test Scores
Main effect 0.039 0.092 0.038 0.083 0.007 0.041
(0.062) (0.084) (0.070) (0.095) (0.065) (0.090)
Interaction –0.018 –0.061 –0.055 –0.066 0.010 0.017
(0.074) (0.085) (0.073) (0.092) (0.075) (0.092)
N 2,973 1,869 2,973 1,869 2,973 1,869
Notes: Coeffi cients and standard errors from regression of grades of completed schooling (upper panel) or average test scores (lower panel) on indicator variable for children with dropout-risk score above the cutoff. Specifi cations 1 correspond to polynomial regressions of order 1; Specifi cations 2 correspond to Local Linear Regressions with band-width = 6. Gender main effect is a variable equal to 1 for girls; school-quality main effect is an indicator variable for schools of above-average school quality, as described in main body of paper; dropout- risk score at cutoff main effect is an indicator variable that takes on the value of one for schools where the cutoff falls above the average for the entire sample, as described in main body of paper. Interactions correspond to an interaction between main effect and indicator for children with scores above the cutoff. Standard errors cluster at level of primary feeder school.
The Journal of Human Resources 686
To construct a measure of school quality, we focus on differences across schools in performance on a math test, after netting out differences in socioeconomic status across schools.26 We then divide schools into those with above- average and below- average school quality, and interact the indicator variable for scholarship recipients with the indicator variable for children who attended schools of above- average quality. The re-sults from these regressions, reported in the middle panel of Table 6, show no evidence that scholarships had larger effects on grade attainment or test scores for children who attended higher- quality schools, at least when school quality is measured in this way.
Finally, we test for heterogeneity of scholarship effects for different values of the school- specifi c cutoff. We begin by graphing the density of the dropout- risk score of all applicants to the 57 CSP schools in our sample (dark bars) and the value of the dropout risk score at the school- specifi c cutoff (hollow bars) in Figure 6. The fi gure shows there is considerable variation in the value of the school- specifi c cutoff,
26. We use a math test that was applied to all children in CSP- eligible schools in 2006, when scholarship recipients were in grade 7. We limit the sample to children who were not offered scholarships, and regress individual test scores on the 26 characteristics that were collected on the scholarship application form. We then calculate the average value of the residuals, by school. These are, in effect, the mean test scores of children turned down for scholarships in every CSP- eligible school, purged of differences in socioeconomic status across schools.
0
.0
5
.1
D
ens
it
y
40 50 60 70 80 90 100
Dropout-risk Score
Figure 6
Distributions of Dropout- Risk Score and School- Level Cutoff
Filmer and Schady 687
-4
-2
0
2
4
Estimated Scholarship Impact on Grades Completed
55 60 65 70 75 80 85
Dropout-risk Score at Cutoff
Scholarship Effects on Grades of Completed Schooling
-4
-2
0
2
4
Estimated Scholarship Impact on Average Test Scores
55 60 65 70 75 80 85
Dropout-risk Score at Cutoff Scholarship Effects on Average Test Scores
Figure 7
Heterogeneity by School- Level Cutoff
The Journal of Human Resources 688
which ranges from 61 (corresponding to the fi fth percentile of the distribution of the dropout- risk score across all applicants) to 80 (corresponding to the 77th percentile)
In the righthand column of Table 6 we report the main effect of scholarships, and the coeffi cient on an interaction between scholarship recipients and an indicator vari-able for children who attended schools where the value of the dropout- risk score at the cutoff was above average (that is, schools where children were more likely to drop out). As with the other results in Table 6, we fi nd no evidence of heterogeneity.
To extend these results, we next run polynomial order one regressions of a given out-come (grades of completed schooling, average test scores) on the indicator variable for scholarship recipients, separately by school. This gives us 57 coeffi cients for each of the two outcomes we consider. In Figure 7 we then plot the coeffi cients of these regressions as a function of the value of the school- specifi c cutoff. The fi gure also includes a line corresponding to a nonparametric (Fan) regression.27 If scholarships had larger effects on children who were more (less) likely to drop out of school in the absence of the CSP, we would expect this line to slope upward (downward) from left to right. Figure 7 shows that this does not appear to be the case.28 In sum, we conclude from Table 6 and Figure 7 that there is no evidence of heterogeneity in the effects of scholarships on grades of completed schooling or test scores by gender, school quality, or the dropout- risk score.
D. Other Outcomes
As can be seen in Table 4, less than one- quarter of scholarship applicants were en-rolled in school in 2010. In the household survey most children report they work—37 percent report they work for pay, and 40 percent report they work without pay.29 There are clear differences in employment by gender, especially in work for pay. Among girls who work for pay, 75 percent of girls work in the garment industry, and 15 per-cent in services and sales; among boys who work for pay, 31 perper-cent work in services and sales, 26 percent in agriculture, 21 percent in construction and mining, and 16 percent in the garment industry.
Since scholarship recipients completed more schooling, we might expect them to have better labor market outcomes. In fact, Table 7 shows that the scholarship pro-gram did not affect the likelihood of working for pay or without pay. There is some evidence of reductions in the intensive margin in work for pay: Scholarship recipients work between one and four fewer hours per week for pay, although the coeffi cients in these regressions are not always signifi cant at conventional levels. The last two rows
27. Solid (dark) circles correspond to schools where the effect is signifi cant; empty (light) circles to schools where the coeffi cient is not signifi cant at conventional levels.
28. In our earlier work (Filmer and Schady 2011) we found evidence that the short- term impact of scholar-ships on school enrollment was somewhat larger in schools where the cutoff corresponded to children who were on average more likely to drop out.
Filmer and Schady
689
Table 7
Scholarship Effects on Labor Outcomes
Mean: Control Group
Polynomial Regression
Local Linear Regression
Bandwidth = 6
Bandwidth = 3
Bandwidth = 12
Order: 1 Order: 2
Works for pay 0.369 0.003 –0.030 0.008 0.039 –0.023
(0.026) (0.034) (0.039) (0.064) (0.032)
Hours worked for pay 16.6 –2.139* –4.332*** –2.327 –1.363 –4.011***
(1.252) (1.660) (1.901) (3.219) (1.505)
Works for no pay 0.399 –0.008 0.011 0.017 0.009 0.006
(0.028) (0.035) (0.045) (0.059) (0.032)
Hours worked for no pay 9.1 –0.325 0.424 0.577 1.325 –0.024
(0.971) (1.229) (1.454) (2.146) (1.164)
ln (monthly earnings) 5.276 0.125 –0.079 0.114 0.214 –0.093
(0.426) (0.567) (0.643) (0.887) (0.488)
ln (monthly earnings) 12.499 0.045 0.050 0.132 0.511** 0.058
only work for pay (0.108) (0.147) (0.151) (0.222) (0.121)
N 1,154 2,973 2,973 1,869 1,082 2,595
Notes: Coeffi cients and standard errors from regression of labor market outcome on indicator variable for children with dropout-risk score above the cutoff. Polynomial Regression Order 1 includes dropout-risk score and its interaction with the indicator for children with scores above the cutoff; Polynomial Regression Order 2 includes dropout-risk score and its square, and interactions with the indicator for children with scores above the cutoff; choice of bandwidth for Local Linear Regressions described in body of paper. Standard errors cluster at level of primary feeder school.
The Journal of Human Resources 690
in Table 7 shows that total monthly earnings are not signifi cantly different among scholarship recipients and nonrecipients.
A number of factors could account for the absence of signifi cant scholarship effects on earnings, in spite of the positive effects on completed grades of schooling. One possibility is that, because the additional schooling did not result in more learning (as measured by test scores), it did not raise productivity and therefore earnings. Another possibility is that the returns to the additional schooling are positive but that they are initially offset by the fact that scholarship recipients will on average have fewer years of work experience (because some stayed in school longer, and it is diffi cult to combine schooling and full- time work for pay); under this scenario, with a longer time horizon, we would expect the earnings of scholarship recipients to eventually surpass those of nonrecipients. A third possibility is that there is a great deal of measurement error in earnings, and that this makes it hard to identify program effects with reason-able precision.30
Finally, we analyze program effects on subjective social status (as measured by the MacArthur ladders with the village or the country as reference groups), on mental health (as measured by the CESD depression scale), and on the probability that adolescents are married or have had a child. Table 8 shows that the scholarship program did not affect subjective social status. The third row of the table suggests that scholarships may have improved mental health, although the coeffi cients in these regressions are not always signifi cant at conventional levels. There is no evidence that the scholarship program led recipients to delay marriage or childbirth, although we note that the fractions married (19 percent) and who have children (8 percent) were still relatively low at the time we carried out the household survey. For these outcomes, as for earnings, a longer time horizon may be needed to meaningfully estimate the impact of the scholarship program.
V. Conclusion
Many programs in developing countries seek to raise school enroll-ment and grade attainenroll-ment. Drawing on randomized evaluations of conditional cash transfers, school feeding programs, programs that provide school uniforms free of charge, and merit- based scholarships, a recent review concludes that interventions that reduce the price of schooling can have substantial effects on access to education (Kremer and Holla 2009).
In this paper we show that a program that gave scholarships to poor children in Cambodia for the three years of lower secondary school had substantial effects on school enrollment and grade attainment. Our paper thus adds to the sparse literature on the medium- term (as opposed to short- term) effects of monetary incentives on schooling in developing countries.
Because we focus on medium- term effects, our paper is closely related to a recent paper that analyzes the medium- term effects of PROGRESA in Mexico (Behrman,
Filmer and Schady
691
Table 8
Scholarship Effects on Other Outcomes
Mean: Control
Group
Polynomial Regression Local Linear Regression
Order: 1 Order: 2 Bandwidth = 6 Bandwidth = 3 Bandwidth = 12
Ladder 1 (village/neighborhood) 3.976 0.020 –0.014 –0.059 –0.004 0.006
(0.083) (0.103) (0.130) (0.213) (0.095)
Ladder 2 (Cambodia) 3.296 0.021 0.101 –0.015 –0.007 0.059
(0.078) (0.110) (0.121) (0.180) (0.093)
Depression 0.007 0.118** 0.099 0.039 0.023 0.117**
(0.047) (0.063) (0.079) (0.117) (0.057)
Married 0.186 0.001 –0.029 –0.052 –0.089* –0.027
(0.024) (0.030) (0.034) (0.052) (0.027)
Has children 0.077 0.001 –0.003 –0.010 –0.014 –0.010
(0.016) (0.021) (0.024) (0.039) (0.020)
N 1,154 2,973 2,973 1,869 1,082 2,595
Notes: Coeffi cients and standard errors from regression of outcome on indicator variable for children with dropout-risk score above the cutoff. Polynomial Regression Order 1 includes dropout-risk score and its interaction with the indicator for children with scores above the cutoff; Polynomial Regression Order 2 includes dropout-risk score and its square, and interactions with the indicator for children with scores above the cutoff; choice of bandwidth for Local Linear Regressions described in body of paper. Standard errors cluster at level of primary feeder school. The depression variable is coded so that higher values correspond to better mental health.
The Journal of Human Resources 692
Parker, and Todd 2011). Behrman, Parker, and Todd present a variety of estimates of program effects on completed grades of schooling, using different samples and differ-ent iddiffer-entifi cation strategies. Based on their double- difference matching estimates, the authors conclude that three years of PROGRESA transfers (relative to no transfers) result in approximately 0.3 more grades of completed schooling (Figures 5 and 6 in Behrman, Parker, and Todd 2011, pp. 112–13). In comparison, we estimate effect sizes of roughly 0.6 additional grades of completed schooling. Thus, the program effects in Cambodia appear to be substantially larger than those found for PROGRESA. This is particularly noteworthy because transfers made by PROGRESA are on average an order of magnitude larger than the value of scholarships awarded by the program in Cambodia we analyze in this paper. (They represent 20 percent of the consumption of the average recipient household in Mexico, compared to two percent in Cambodia— see Fiszbein and Schady 2010, pp. 128–29.)31 Taken together with our earlier results on short- term effects (Filmer and Schady 2008, 2011), the results in this paper suggest that quite small monetary incentives can have large effects on school enrollment and grade attainment in poor countries.
In spite of this large effect on grade attainment, however, we fail to fi nd any pro-gram effects on learning outcomes or earnings. There are a variety of reasons, both substantive and measurement- related, why this could be the case, and our data do not allow us to credibly test competing hypotheses. Also, children could benefi t from pro-grams that increase grade attainment levels even if their cognitive skills, as measured by tests, are no higher than they would have been without the additional schooling. They may acquire important noncognitive skills, including discipline, perseverance, motivation and a work ethic. (See Heckman and Rubinstein 2001; Heckman, Stixrud, and Urzúa 2006.) Despite the medium- term time frame we analyze, it may still be too early to tell whether the labor market outcomes of children who received scholarships will eventually be better than those of children who did not receive them. Schooling could also have other benefi ts, including better health status for scholarship recipi-ents and (eventually) their children—even if learning, as measured by test scores, is limited. Nevertheless, the absence of scholarship effects on test scores, employment, earnings, and subjective social status all lead us to be cautious. It would be important in future research to continue to follow the benefi ciaries of this and similar programs into adulthood.
References
Angrist, Joshua, Eric Bettinger, Erik Bloom, Elizabeth King, and Michael Kremer. 2002. “Vouchers for Private Schooling in Colombia: Evidence from a Randomized Natural Experi-ment.” American Economic Review 92(5):1535–58.
Angrist, Joshua, Eric Bettinger, and Michael Kremer. 2006. “Long- Term Educational Conse-quences of Secondary School Vouchers: Evidence from Administrative Records in Colom-bia.” American Economic Review 96(3):847–72.
Filmer and Schady 693
Banerjee, Abhijit V., Shawn Cole, Esther Dufl o, and Leigh Linden. 2007. “Remedying Education: Evidence from Two Randomized Experiments in India.” Quarterly Journal of Economics 122(3):1235–64.
Barreca, Alan I., Melanie Guldi, Jason M. Lindo, Glen R. Waddell. 2011. “Saving Babies? Revisiting the Effect of Very Low Birth Weight Classifi cation.” Quarterly Journal of Economics 126(4): 2117–23.
Behrman, Jere R., Susan W. Parker, and Petra E. Todd. 2009. “Medium- Term Impacts of the Oportunidades Conditional Cash Transfer Program on Rural Youth in Mexico.” In Poverty, Inequality and Policy in Latin America, ed. Stephan Klasen and Felicitas Nowak- Lehman, 219–70. Cambridge: MIT Press.
———. 2011. “Do Conditional Cash Transfers for Schooling Generate Lasting Benefi ts? A Five- Year Followup of PROGRESA/Oportunidades.” Journal of Human Resources
46(1):93–122.
Carneiro, Pedro, and Sokbae Lee. 2011. “Trends in Quality- Adjusted Skills Premia in the United States, 1960–2000.” American Economic Review 101(6):2309–49.
Dufl o, Esther. 2001. “Schooling and Labor Market Consequences of School Construction in Indonesia: Evidence from an Unusual Policy Experiment.” American Economic Review
91(4):795–813.
Ferreira, Francisco H.G., Deon Filmer, and Norbert Schady. 2009. “Own and Sibling Effects of Conditional Cash Transfer Programs: Theory and Evidence from Cambodia.” World Bank Policy Research Working Paper 5001. Washington, D.C.: World Bank.
Filmer, Deon, and Norbert Schady. 2008. “Getting Girls into School: Evidence from a Scholar-ship Program in Cambodia.” Economic Development and Cultural Change 56(2): 581–617. ———. 2009. “Targeting, Implementation, and Evaluation of the CSP Scholarship Program in
Cambodia.” Unpublished manuscript, Washington, D.C.: World Bank.
———. 2011. “Does More Cash in Conditional Cash Transfer Programs Always Lead to Larger Impacts on School Attendance?” Journal of Development Economics 96(1):15–57. Fiszbein, Ariel, and Norbert Schady. 2009. Conditional Cash Transfers: Reducing Present and
Future Poverty. Washington, D.C.: World Bank.
Heckman, James J., Sergio Urzua, and Edward Vytlacil. 2006. “Understanding Instrumental Variables in Models with Essential Heterogeneity.” Review of Economics and Statistics
88(3):389–432.
Heckman, James J., and Yona Rubinstein. 2001. “The Importance of Noncognitive Skills: Les-sons from the GED Testing Program.” American Economic Review, Papers and Proceedings
91(2):245–49.
Heckman, James J., Jora Stixrud, and Sergio Urzua. 2006. “The Effects of Cognitive and Noncognitive Abilities on Labor Market Outcomes and Social Behavior.” Journal of Labor Economics 24(3):411–82.
Imbens, Guido W., and Karthik Kalyanaraman. 2012. “Optimal Bandwidth Choice for the Regression Discontinuity.” The Review of Economic Studies 79(4):933–59.
Imbens, Guido W., and Thomas Lemieux. 2008. “Regression Discontinuity: A Guide to Prac-tice.” Journal of Econometrics 142(2):615–35.
Kremer, Michael, and Alaka Holla. 2009. “Improving Education in the Developing World: What Have We Learned from Randomized Evaluations?” Annual Review of Economics
1(1):513–42.
Kremer, Michael, Edward Miguel, and Rebecca Thornton. 2009. “Incentives to Learn.” Review of Economics and Statistics 91(3):437–56.
Lee, David S., and Thomas Lemieux. 2010. “Regression Discontinuity Designs in Econom-ics.” Journal of Economic Literature 48(2):281–355.
The Journal of Human Resources 694
Miguel, Edward, and Michael Kremer. 2004. “Worms: Identifying Impacts on Education and Health in the Presence of Treatment Externalities.” Econometrica 72(1):159–217. Pop- Eleches, Cristian, and Miguel Urquiola. 2013. “Going to a Better School: Effects and
Behavioral Responses.” American Economic Review 103(4):1289–1324.
Radloff, Leonore Sawyer. 1977. “The CES- D Scale: A Self- Report Depression Scale for Research in the General Population.” Applied Psychological Measurement 1(3):385–401. Schultz, T. Paul. 2004. “School Subsidies for the Poor: Evaluating the Mexican PROGRESA
Poverty Program.” Journal of Development Economics 74(1):199–250.