INTEGRATED SURVEYING TECHNIQUES FOR SENSITIVE AREAS:
SAN FELICE SUL PANARO
M. Ballarin a, V. Buttolo a, F. Guerra a, P. Vernier a
a Laboratorio di Fotogrammetria, Sistema dei Laboratori, Università IUAV di Venezia, Santa Croce 191, 30135 Venezia
(martinab, buttolo, guerra2, vernier)@iuav.it
Commission V, WG V/2
KEY WORDS: laser scanner, multi image photogrammetry, UAV, point cloud, cultural heritage, earthquake.
ABSTRACT:
The last few years have marked an exponential growth in the use of electronic and computing technologies that opened new possibilities and new scenarios in the Geomatic field. This evolution of tools and methods has led to new ways of approaching survey. For what concerns architecture, the new tools for survey acquisition and 3D modelling allow the representation of an object through a digital model, combining the visual potentials of images, normally used for documentation, with the precision of a metric survey.
This research focuses on the application of these new technologies and methodologies on sensitive areas, such as portions of the cities affected by earthquakes. In this field the survey is intended to provide a useful support for other structural analysis, in conservation as well as for restoration studies.
However, survey in architecture is still a very complex operation both from a methodological and a practical point of view: it requires a critical interpretation of the artefacts and a deep knowledge of the existing techniques and technologies, which often are very different but need to be integrated within a single general framework.
This paper describes the first results of the survey conducted on the church of San Geminiano in San Felice sul Panaro (Modena). Here, different tools and methods were used, in order to create a new system that integrates the most recent and cutting-edge technologies in the Geomatic field. The methodologies used were laser scanning, UAV photogrammetry and topography for the definition of the reference system. The present work will focus on the data acquisition and processing whit these techniques and their integration.
1 . INTRODUCTION
The survey of areas devastated by earthquakes presents some specific characteristics that differentiate it from the conventional schemes and standardized methods traditionally used. Every situation is a case in itself and requires the intervention and the integration of methods and tools that operate with heterogeneous precision but somehow have to communicate with each other within a single general reference system.
The references, which generally guide and underline architecture (and therefore also its survey), such as planes parallel to floors and walls, are often no longer available. In many cases buildings present serious damages that modify their shape, but sometimes collapses occur and there are only ruins. In such situations the references previously considered as fundamental for the design and the execution of a survey, are completely lost (Buttolo, 2011a; Buttolo, 2011b). On the 20th and the 29th of May 2012, a large area of north of Italy was affected by some strong earthquakes. The distribution of damages caused by the seismic shakes shows the need to record the position of the artefacts within the urban area, to record the artefacts themselves as architectural objects and to record some details in order to facilitate a possible recovery.
At the same time, everything must be embedded within a larger framework, in order to preserve the relationship between the parts that compose the whole area considered.
In this case, survey no longer aims just to study the city and its factories, but it becomes a multi-scale container where emergencies can be catalogued: it is therefore understood in this sense as instrumental for the disciplines of structural analysis, conservation and restoration.
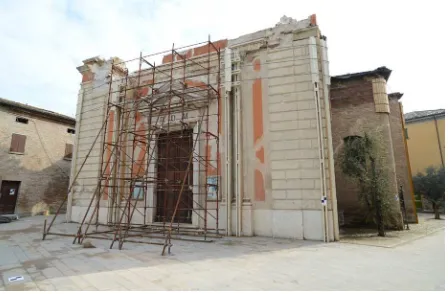
Figure 1: The church of San Geminiano
support the planning and execution of the restoration, the analysis of geometric, material, static and degradation features of the building and to allow subsequent study and recovery of the damaged artefact.
Due to the complexity of the building’s geometry and the obvious difficulties of the environment (fig. 2), the survey can only use the most advanced instrumental, methodological and data processing techniques. At the same time it stimulates the advancement of research on both the data acquisition and their post-processing.
Figure 2: The inside of the church
Therefore, it was necessary to merge multiple survey techniques: innovative techniques for cultural heritage have been tested in order to be integrated, with the aim of arriving at a complete 3D documentation which can be used for further studies on conservation and restoration, as well as a finished product for distribution and knowledge also for the general users.
In fact, the integration of data generated by different survey methods is one of the open problems in the documentation of cultural heritage, a field that the Laboratory of Photogrammetry of IUAV University has investigated for the past few years (see for example: Balletti, 2012; Balletti, 2006).
2 . ACQUISITION 2.1 Laser Scanner
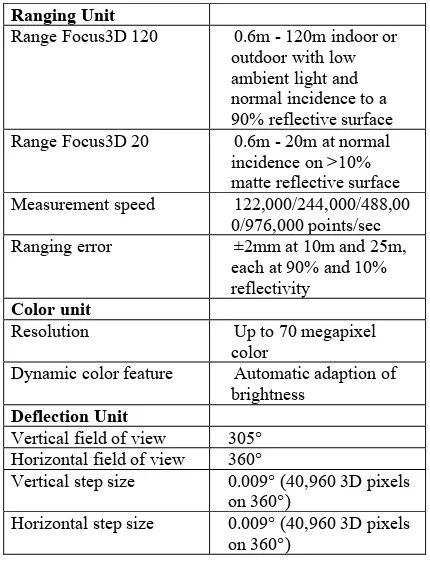
As is well known, laser scanning technology allows the user to digitally acquire three-dimensional objects of various sizes in the form of point clouds. The digital geometric description of the object is discrete: the higher the resolution is set during the acquisition of the data, the denser the point cloud will be and thus the details of the representation (Guidi, 2010). Each point that constitute the point cloud is defined by a spatial position in the X, Y, Z coordinates, with respect to the origin point represented by the position of the scanner. If the scanner has a built-in digital camera it is also possible to map the RGB value, and the colour of the point is acquired. In San Felice sul Panaro the laser scanner used was the Faro Focus 3D, owned by the Laboratory of Photogrammetry, that allows distance accuracy up to 2 mm, ranging from 0.6 to 120 m and which can acquire up to 976,000 points per second (tab. 3).
Ranging Unit
Range Focus3D 120 0.6m - 120m indoor or outdoor with low ambient light and normal incidence to a 90% reflective surface Range Focus3D 20 0.6m - 20m at normal
incidence on >10% matte reflective surface Measurement speed 122,000/244,000/488,00
0/976,000 points/sec Ranging error ±2mm at 10m and 25m,
each at 90% and 10% reflectivity
Color unit
Resolution Up to 70 megapixel
color
Dynamic color feature Automatic adaption of brightness
Deflection Unit
Vertical field of view 305° Horizontal field of view 360°
Vertical step size 0.009° (40,960 3D pixels on 360°)
Horizontal step size 0.009° (40,960 3D pixels on 360°)
Table 3. Faro Focus 3D specifications
This type of instrument is a Terrestrial Laser Scanner (TLS) that offers an efficient method for 3D measurement and 3D image documentation. It is small and compact; it can be used in wireless mode. All of these characteristics were taken into account when the decision was made to use this tool in a sensitive area, such as the earthquake zone.
The FARO Laser Scanner Focus 3D (fig. 4) uses Phase Shift measurement technology to measure the distance to a surface: an infrared laser is sent out and reflected back to the system. The distance is measured by analysing the shift in the wavelength of the returning beam.
This tool is suitable for fast acquisition of good quality three-dimensional images even in difficult environmental
conditions. It is considered a "hybrid laser-photogrammetric scanner", as it offers the opportunity to acquire not only the three observations necessary for the determination of the X, Y, Z coordinates of each point, but also to the R, G, B (radiometric) values corresponding to each measured point. The aim of the survey operation planned in San Felice sul Panaro was to define the positions of the different volumes built on the square of this part of the village and to record the fronts of the buildings, and in particular the church. The ultimate purpose was to obtain a 3D model that could be used to carry out further analysis on degradation as a static evaluation of the structures. In fact, their behaviour is affected by instability and morphological deformations that have occurred over time, aggravated by the strong seismic shakes of May 2012.
The high speed of data acquisition is a strong positive characteristic when using the laser scanner, which combines the precision of the metric survey with the definition of the image. The image of the artefacts is characterized at the same time as the dimensional definition of the buildings and urban spaces of the survey, allowing the three-dimensional reconstruction of the space of the square and the church, keeping all the related elements together.
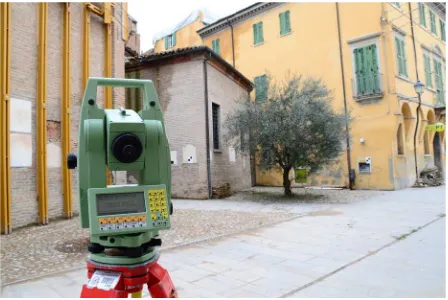
The topographic survey, carried out with a total station Leica TCR (fig. 5), allows the definition of the geometric reference network and has enabled all of the scans performed in the urban space of the square, around the church and inside it, to be brought into a single reference system.
Figure 5: Total station TCR Leica
The topographic network was composed of 5 survey stations, constituting a loop traverse, closed on a point identified on an architectural element of the building behind the apse of the church. In fact, from the last station it was impossible to see the first one. In order to create redundant data, from each survey station we looked forward to the next occupied point, looked back to the previous one and observed every target used for the laser scanner (even if it had already been observed by another survey station). In this way the loop traverse became a true topographic network.
The redundant observations were adjusted using the least square method, through MicroSurvey Starnet software, obtaining precisions of 1-2 mm on the final coordinates used for the georeferencing of the laser scanner data.
Although it is commonly referred to as automatic data points of acquisition should be provided in order to cover all
the blind spots caused by protruding surfaces, recesses and various impediments.
The factors just mentioned were taken into account and determined the placement and the number of scan stations defined, together with the choice of the instrument itself. For the scans, we set an angular step of 0.035°, which guaranteed the acquisition of one point every 6 mm at 10 m of distance between the laser and the building. Considering the average distance and the number of scans planned, this was more than enough for a restitution scale of 1:50.
Post-processing followed the acquisition phase: using specific software products (Faro SCENE, Pointools) the 15 single scans were assembled (fig. 6). A methodology called "georeferencing on target", which involves the use of the topographical data acquired with the total station, as mentioned above, has been used to align the scans in a global point cloud. The standard deviation on the alignment is less than 1 cm. The final result is a 3D point model made of more than 450,000,000 points.
Figure 6: Registered point clouds
One of the reasons that led to the choice of a survey through the use of a laser scanner was precisely this need to acquire the overall shape of the church with its irregularities and not just its essential lines. This enabled further evaluation of the quality of the construction and the possible deformations, which occurred over time and after the earthquake. The laser scanner was also chosen for its ability to detect elements whose complexity cannot be acquired with more traditional methodologies and for its capacity to minimize operator exposure in high-risk environments such as portions of the cities affected by earthquakes.
Nonetheless, the model was not complete, as the metric data of the highest parts of the building, such as rooftops, were not acquired.
2.2 UAV photogrammetry
In order to obtain the most complete data of the area we then performed a photogrammetric survey from Unmanned Aerial Vehicle. This technique is one of the most useful in the areas devastated by an earthquake, as it allows the documentation of damaged buildings without putting surveyors in any danger, and at the same time it acquires data on areas that are not reachable using other tools, such as the building’s roofs (on UAVs, aerial photos and their use in Geomatics see for example: Celikoyan, 2003; Dominici, 2012; Haala, 2011; Heisenbeiss, 2010; Rinaudo, 2012; Spatalas, 2006; Skarlatos, 2004).
The vehicle used was a hexacopter by Mikrokopter assembled for the Laboratory of Photogrammetry by Tecnodrone s.r.l. (fig. 7).
- Flight autonomy (max payload): 10-12 minutes; - All-up weight: 1800 g;
- Maximum payload: 250-300g; - Motors typology: 6 brushless motors; - GPS system embedded;
- Telemetry system on board with transmission of the flight parameters to the ground station:
- Flight speed; - Flight altitude; - Distance from the pilot; - Battery charge; - GPS position;
- Real time transmission to the ground station of the flight video;
- Radio control with 2.4 Ghz transmission, 9 channels.
Figure 7: The UAV used for the acquisition
The camera mounted on the vehicle was a Canon Powershot S100, a compact camera light enough to be lifted by our hexacopter (198 g), but with a good resolution and characteristics suitable for the job (tab 8).
Focal length
Sensor dimensions
(mm)
Pixel dimension
s (µ)
Sensor format (px)
e F_w F_h d pixel f_w f_h
5.2 7.44 5.58 1,86 4000 3000
Table 8: Characteristics of the camera used.
In the preliminary phase, flight plans were defined, following the standard pipeline of traditional aerial photogrammetry. We considered the scale of the photograms, their ground-coverage, the focal length of the camera, the overlap between the photograms, the flight altitude and therefore the distance between the projection centres.
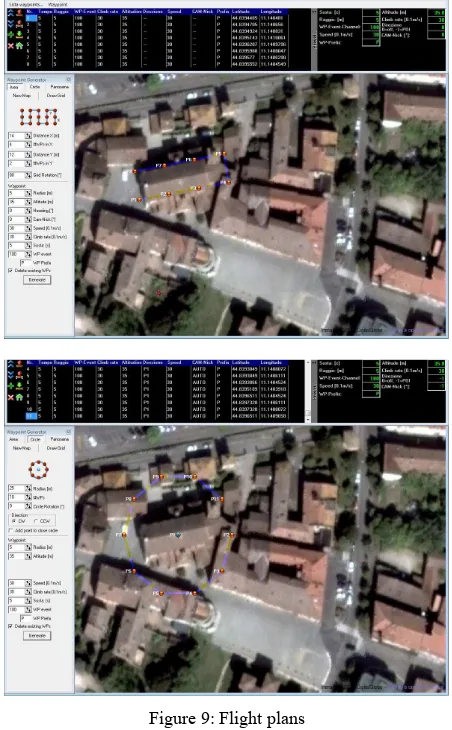
Thanks to the embedded electronic sensors, such as GPS, barometric altimeter, gyroscopes and accelerometers, the UAV can fly in an assisted or autonomous mode. In fact, waypoints can be manually identified on a georeferenced aerial photo through the vehicle’s software and transmitted to the drone in order to define a flight path. For this project, we defined three flight plans, at different altitudes.
The average height for the flights performed was 35 meters, which provided a ground-coverage of about 37 x 50 m. The distance between the projection centres was set at 14 m, so that the forward overlap was 75% and the side overlap was 70% (in the worst scenario).
The vehicle flew following the route defined through waypoints, while, from the ground station, operators checked both its trajectory and the photo acquisition, thanks to the possibility of watching in real time (on a laptop) what the camera was framing.
These vehicles are subjected to weather conditions, especially wind, which make the definition of a proper photogrammetric block quite difficult. Moreover, the conformation of the area to survey, did not allow the visibility of the drone during the whole acquisition process: therefore, the fly through waypoints was absolutely necessary.
The acquisition phase was fast, lasting less than a morning: we performed three acquisition sessions of more or less 6-8 minutes each. In reality, the vehicle has autonomy for 12 minutes, but it is necessary to make it land a few minutes before the battery runs out, in order to have enough time to deal with possible mistakes or problems during the process. Over the whole morning we acquired 195 photographs. Among these photograms, we chose those taken at a flight height of 30 meters maximum, in order to maintain a GSD of maximum 1 cm, allowing restitution suitable for the 1:50 scale. This was made possible by the telemetry data, recorded on a micro SD card placed on the vehicle itself.
We had also planned a flight with circular path, camera at a 45 degrees angle, and shots with convergent optical axes, but the weather was too windy. Instead we were able to acquire vertical photos with a grid flight path (fig. 9).
Figure 9: Flight plans
checkerboard targets (A4 paper), the same used for laser scanning survey because they needed to be recognised by the laser scanner and they were visible from the flight altitude of the drone.
3 . DATA PROCESSING
At the end of the acquisition process, the photograms were used to integrate the laser scanner data, in order to obtain a complete 3D model of the church and the surrounding area. We chose to work with Photoscan Agisoft, software that allows the orientation of photogrammetric blocks with a random distribution, as long as they cover the whole object and there is an adequate overlap to identify enough tie points between the photograms. This software uses robust algorithms, performed offline; the operations are almost completely automatic: the operator can set some parameters, related to the quality of the desired results, such as the accuracy on the estimation of the rough camera positions and some reconstruction parameters for the creation of the final mesh.
Photoscan Agisoft, unlike other Structure Form Motion software products, allows the orientation of the model obtained in a user defined reference system. In fact it is possible to directly locate some markers on the 3D model or on the single photograms, and to assign them X, Y, Z coordinates.
A set of photograms was then imported into the software, previously selected in order to guarantee the generation of a reliable 3D model (fig. 10).
For the alignment of the photograms, the twelve targets mentioned above were manually detected on the photographs and the coordinates obtained by the topographic survey were assigned to them. In this way, the same points were used first for the photo alignment and then for the rototranslation and scaling of the model.
Figure 10: The model in Photoscan Agisoft
Given, though, that these targets were always located at the margins of each photogram, the final result was not accurate enough. To test the reliability of the model, some checkerboard that were not used as ground control points to orient it, were used as check points. Their coordinates were compared with the ones on the laser scanner point cloud and
their difference turned out to be between 5 and 10 centimetres.
Therefore, we subsequently identified a set of easily recognizable points inside the church, to which we attributed laser coordinates, as the point clouds obtained by laser scanner were already registered in the reference system given by topography.
The dense point cloud obtained after this process was then exported from Photoscan and imported into Pointools, a software which allows the management and visualisation of large files and quantity of points in an easy way. Here, we checked the accuracy of the result obtained after the introduction of these new ground control points inside the church: the two sets of coordinates of the check points differ by about 1 cm, as shown in the table below (tab. 11).
Point ∆x (m) ∆y (m) ∆z (m)
D 002 0.003 0.002 0.001
D 003 0.001 0.004 0.011
D 008 0.002 0.011 0.005
D 010 0.002 0.002 0.005
Table 11: Precisions on the check points.
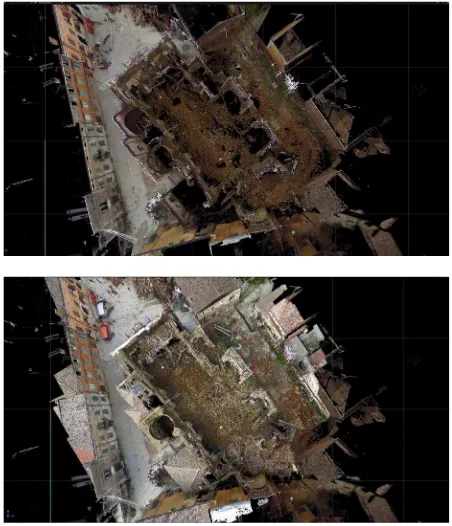
At the end of this process, we unified the photogrammetric point cloud with the one acquired by Faro Focus 3D, so that we could obtain a complete 3D model of the whole area. This result is suitable for representation at the nominal scale of 1:50 (fig. 12), considering the scan settings already mentioned, the GSD of the photograms used for the photogrammetric model and the standard deviation on the alignment of the laser scanner point cloud with the photogrammetric one.
Figure 12: Above, laser scanner point clouds. Below, integration with the photogrammetric point cloud.
further analysis for the conservation and the restoration of the church.
4 . CONCLUSIONS
The methodological path just described represents an alternative solution to the problem of surveying areas destroyed by earthquakes. This project uses the most innovative and recent techniques and methodologies in the geomatic field. In fact, the traditional tools normally used in these areas, such as laser scanning and total stations, are flanked by new systems (UAV and multi-image photogrammetry), in order to fill up gaps in the data acquired. Especially in logistically difficult situations, the integrated use of Unmanned Aerial Vehicles and dense stereo matching systems, is very efficient and can solve many problems. As stated before, multi image algorithms, implemented in different Structure from Motion software products, like Photoscan Agisoft, allow the user to obtain high-resolution point clouds from a set of photograms with random distribution. These point clouds are very useful even if they are ‘noisier’ than those acquired with laser scanner technologies.
The processing of the data demonstrated some issues related to the metrical control of the resulting model: Photoscan only gives an indication of the errors on the points used in the orientation of the model, but not on the geometry of the whole model.
Nevertheless, this project underlines, once again, the necessity of controlling all the survey operations, which can only be done with the topographic network. It represents the general framework in which the point clouds obtained both by laser scanner and UAV photogrammetry are placed and then integrated.
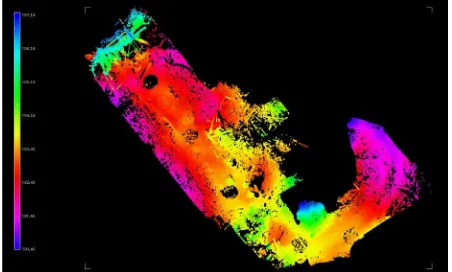
The data obtained are now used by the team that studies the church for different purposes. First of all, we can calculate the volume of the ruins inside the church, which will be valuable support for their removal (fig. 13).
Figure 13: Volumetric analysis on the ruins inside the church
Moreover, we have data that can be used to evaluate the structural reaction of the walls when the ruins will be removed.
Finally, not only the final point cloud, but even just the photographic documentation acquired from the aerial vehicle was very important: it provided a clear documentation of the top of the church for the first security measures taken on the two lateral chapels.
5 . REFERENCES
Balletti, C., Adami, A., Guerra, F., Vernier, P., 2012. Dal rilievo alla maquette: il caso di San Michele in Isola. Archeomatica, pp. 24-30.
Balletti, C., Guerra, F., Pilot, L., 2006. Integrazione di tecnologie 3d multiscala per la conoscenza, l’interpretazione e la diffusione di un sito archeologico. In: X Conferenza Nazionale ASITA, Federazione delle Associazioni Scientifiche per le Informazioni Territoriali ed Ambientali, Fiera di Bolzano, 14-17 novembre 2006.
Buttolo, V., Geremia, E., Guerra, F., 2011a. Rilievo Laser Scanning e Analisi dei dati di facciate colpite dal sisma. In: Proceedings of V-Earth Sim, Virtual Earth Simulation, L'Aquila .
Buttolo, V., 2011b, Il sisma aquilano: rilievo laser scanner delle architetture e interpretazione dei dati. In:Proceedings of Asita 2011, Parma.
Celikoyan, T. M., Altan, M. O., Toz, G., 2003. Evaluation of a theatre by using low-altitude aerial and terrestrial photogrammetry. ISPRS Archives Vol. XXXIV-5/C15, CIPA, Antalya, Turkey, pp. 375–379. ISSN: 1682–1750.
Dominici, D., Baiocchi, V., Zavino, A., Alicandro, M., Elaiopoulos, M., 2012. Micro UAV for post seismic hazards surveying in old city center of L’Aquila. In: FIG Working Week 2012 “Knowing to manage the territory, protect the environment, evaluate the cultural heritage”, Rome, Italy, 6-10 May 2012.
Guidi, G., Russo, M., Beraldin, J.A., 2010, Acquisizione 3d e modellazione poligonale, McGraw-Hill Companies, pp.
Haala, N., Cramer, M., Weimer, F., Trittler, M., 2011. Performance test on UAV-based photogrammetric data collection. ISPRS Archives, Vol. XXXVIII-1/C22 UAV-g 2011, Conference on Unmanned Aerial Vehicle in Geomatics, Zurich, Switzerland.
Heisenbeiss, H., Sauerbier, M., 2010. UAVs for the
documentation of archaeological excavations, IN:
International Archives of Photogrammetry, Remote Sensing and Spatial Information Sciences, Vol. XXXVIII, Part 5.
Rinaudo, F., Chiabrando, F., Lingua, A., Spanò, A., 2012. Archaeological site monitoring: UAV photogrammetry can be an answer. In: International Archives of Photogrammetry, Remote Sensing and Spatial Information Sciences, Vol. XXXIX-B5, pp. 583-588.
Spatalas, S., Tsioukas, V., Daniil, M., 2006. The use of remote controlled helicopter for the recording of large scale urban and suburban sites. In: Proceedings of the Scientific Conference. Culture of Representation, Xanthi, Greece.