SAMPLING STRATEGY FOR
SPACE MEAN SPEED SURVEY
Leksmono Suryo Putranto
Senior Lecturer Civil Engineering Department
Tarumanagara University, Jl. Let.Jen. S. Parman No. 1
Jakarta 11440 Phone: (021) 5672548 ext 332
;
Anita Sari
Student
Civil Engineering Department Tarumanagara University, Jl. Let.Jen. S. Parman No. 1
Jakarta 11440 Phone: (021) 5672548 ext 332
Bernadus Ivan Santoso
Student
Civil Engineering Department Tarumanagara University, Jl. Let.Jen. S. Parman No. 1
Jakarta 11440 Phone: (021) 5672548 ext 332
Abstract
In most traffic projects, speed survey is required. If the speed survey uses detector, all data might be obtained. Otherwise a sampling strategy needs to be introduced. To ensure the collection of representative sample of speeds there were several sampling options, e.g. collecting sample every regular interval. In this paper three regular intervals were tested, i.e. 30 seconds, 1 minute and 2 minutes 30 seconds. Travel time data was collected in morning, mid day and afternoon periods in a two-lanes two-ways underpass in Jakarta. Travel speeds were calculated by dividing light vehicle travel times with the underpass length. Space mean speeds were calculated as a light vehicle travel mean speeds/ 5 minutes. The observation of each light vehicle travel times (to get each light vehicle travel speeds) was conducted for the first 15 minutes of three observation periods. More frequent speed sample collection provides higher accuracy.
Key Words: Space mean speed, sampling strategy, regular interval sampling
INTRODUCTION
In most traffic related projects, speed survey is required. If the speed survey is conducted
using detector, all speeds data might be obtained. Otherwise a sampling stragegy needs to
be introduced. To ensure the collection of representative sample of sppeds there were
several sampling options. One of the most practical sampling strategy is by withdraw
sample in a regular interval.
OBJECTIVE
The objective of this study is to understad the effect speed sample withdrawal frequency to
the accuracy of obtained space mean speeds.
PREVIOUS STUDIES
Putranto (2010) conducted space mean speeds observations in 3 new development
locations in Jakarta to fulfill traffic impact analysis required by Jakarta Transport Agency.
As the alocated budget is very limited only 4 speed observations per hour per vehicle type
(during 06.00-09.00 and 16.00-19.00) were carried out. Light vehicles, heavy vehicles and
motorcycle speeds were observed. This cause doubt on the accuracy of the result.
Therefore a study to understand the effect of speed sampling frequency is required.
METHODOLOGY
In this paper three regular intervals were tested, i.e. 30 seconds, 1 minute and 2 minutes 30
seconds. Travel time data was collected in Thursday, 13 October 2011 in morning
(06.10-08.08), mid day (10.45-12.47) and afternoon (14.40-16.38) periods in a lanes
two-ways underpass in Teuku Nyak Arief Street, South Jakarta. These periods were
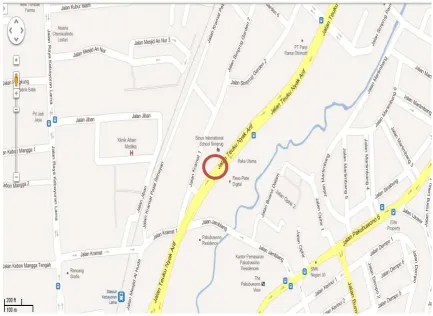
deliberately chosen to avoid measurement in stop and go condition. Figure 1 shows the
location of the underpass in red circle, Figure 2 shows view of underpass taken from
Simprug side and Figure 3 shows the video camera view above the uderpass for speed and
flow survey. Although the underpass is a two-lanes two ways street but it is quite wide (9,2
m) because its also serve Bus Rapid Transit Line 8 flow (non-exclusive BRT lane in the
underpass but exclusive lane in most other parts of the line).
Figure 2
View of the Underpass Taken
from Simprug
Figure 3
Camera View for Speed and Flow
Flow Observation
Travel speeds were calculated by dividing light vehicle travel times with the underpass
length (67.7 m). Space mean speeds were calculated as a light vehicle travel mean speeds/
5 minutes. The observation of each light vehicle travel times (to get each light vehicle
travel speeds) was conducted for the first 15 minutes of three observation periods.
Sampling error of 30 seconds sampling interval was calculated by Equation 1.
% 100 _ _ _ 30 _ _ _ _ _ 30 _ _ _ _ x n observatio overall from s n observatio s per from s n observatio overall from s n observatio s per of error Sampling
(1)
From Santoso (2011), it was found that sampling error for speed observation every 30
seconds was only about 1-2 %. This was considerably small error. As conducting overall
speed observation is very tidious and difficult task, using 30 seconds sampling interval as a
bench mark to calculate sampling error of 1 minute interval (Equation 2) and 2 minutes 30
seconds interval (Equation 3) is considered to be sufficient.
% 100 _ 30 _ _ _ 1 _ _ _ 30 _ _ _ 1 _ _ _ _ x n observatio s per from s n observatio m per from s n observatio s per from s n observatio m per of error Sampling
(2)
% 100 _ 30 _ _ _ 30 _ 2 _ _ _ 30 _ _ _ 30 _ 2 _ _ _ _ x n observatio s per from s n observatio s m per from s n observatio s per from s n observatio s m per of error Sampling
(3)
Lower sampling error in % indicates closer similarity between the space mean speed in
regular interval sampling with bench mark speed.
SUMMARY OF RESULTS
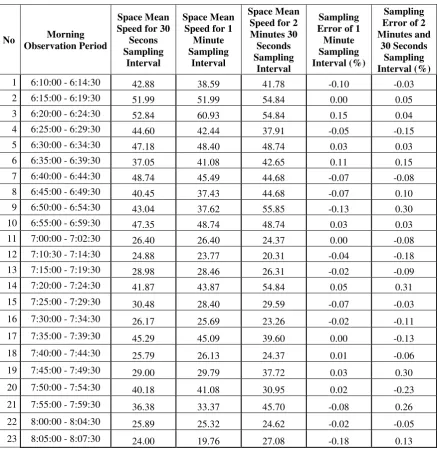
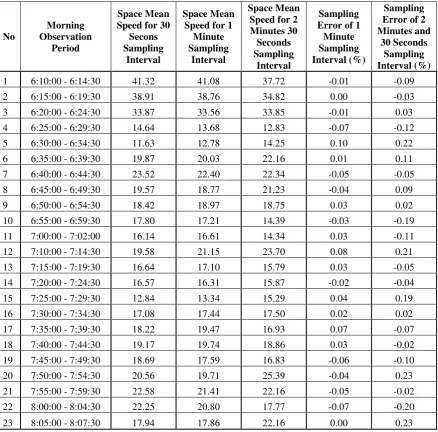
Table 1.
Space Mean Speed & Sampling Errors for North-South Direction in the
Morning
No Morning
Observation Period
Space Mean Speed for 30
Secons Sampling
Interval
Space Mean Speed for 1
Minute Sampling
Interval
Space Mean Speed for 2 Minutes 30 Seconds Sampling
Interval
Sampling Error of 1 Minute Sampling Interval (%)
Sampling Error of 2 Minutes and
30 Seconds Sampling Interval (%)
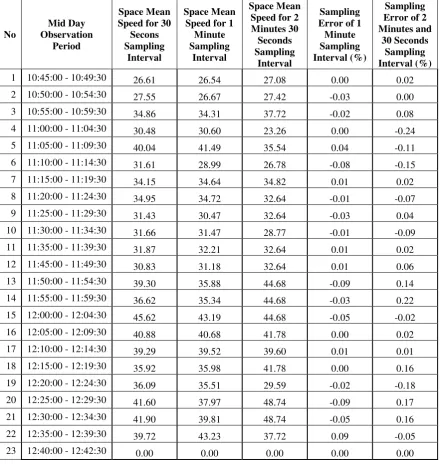
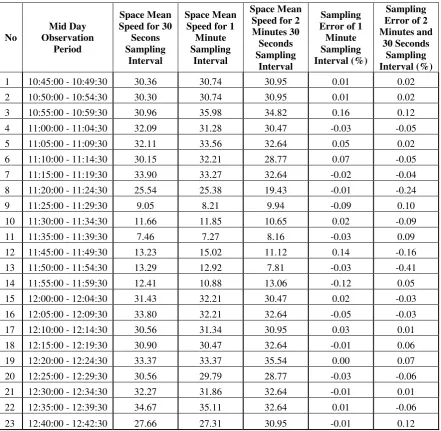
Table 2.
Space Mean Speed & Sampling Errors for North-South Direction in the Mid
Day
No
Mid Day Observation
Period
Space Mean Speed for 30
Secons Sampling
Interval
Space Mean Speed for 1
Minute Sampling
Interval
Space Mean Speed for 2 Minutes 30 Seconds Sampling
Interval
Sampling Error of 1 Minute Sampling Interval (%)
Sampling Error of 2 Minutes and
30 Seconds Sampling Interval (%)
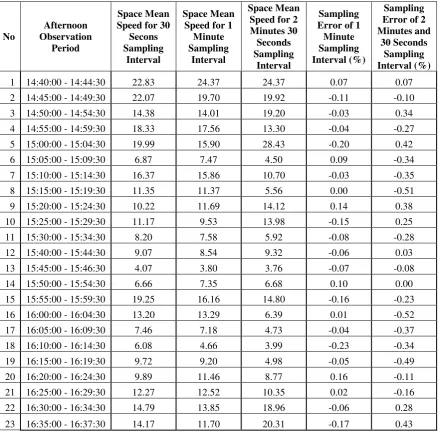
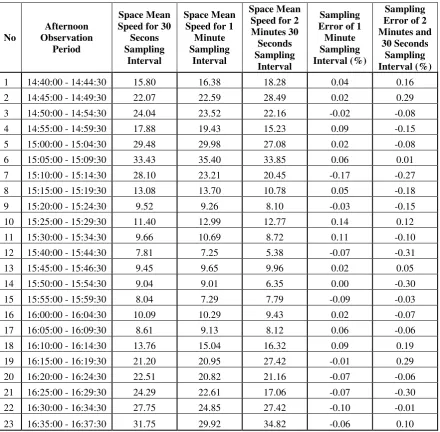
Table 3.
Space Mean Speed & Sampling Errors for North-South Direction in the
Afternoon
No
Afternoon Observation
Period
Space Mean Speed for 30
Secons Sampling
Interval
Space Mean Speed for 1
Minute Sampling
Interval
Space Mean Speed for 2 Minutes 30 Seconds Sampling
Interval
Sampling Error of 1 Minute Sampling Interval (%)
Sampling Error of 2 Minutes and
30 Seconds Sampling Interval (%)
Table 4.
Space Mean Speed & Sampling Errors for South-North Direction in the
Morning
No
Morning Observation
Period
Space Mean Speed for 30
Secons Sampling
Interval
Space Mean Speed for 1
Minute Sampling
Interval
Space Mean Speed for 2 Minutes 30 Seconds Sampling
Interval
Sampling Error of 1 Minute Sampling Interval (%)
Sampling Error of 2 Minutes and
30 Seconds Sampling Interval (%)
Table 5.
Space Mean Speed & Sampling Errors for South-North Direction in the Mid
Day
No
Mid Day Observation
Period
Space Mean Speed for 30
Secons Sampling
Interval
Space Mean Speed for 1
Minute Sampling
Interval
Space Mean Speed for 2 Minutes 30 Seconds Sampling
Interval
Sampling Error of 1 Minute Sampling Interval (%)
Sampling Error of 2 Minutes and
30 Seconds Sampling Interval (%)
Table 6.
Space Mean Speed & Sampling Errors for South-North Direction in the
Afternoon
No
Afternoon Observation
Period
Space Mean Speed for 30
Secons Sampling
Interval
Space Mean Speed for 1
Minute Sampling
Interval
Space Mean Speed for 2 Minutes 30 Seconds Sampling
Interval
Sampling Error of 1 Minute Sampling Interval (%)
Sampling Error of 2 Minutes and
30 Seconds Sampling Interval (%)
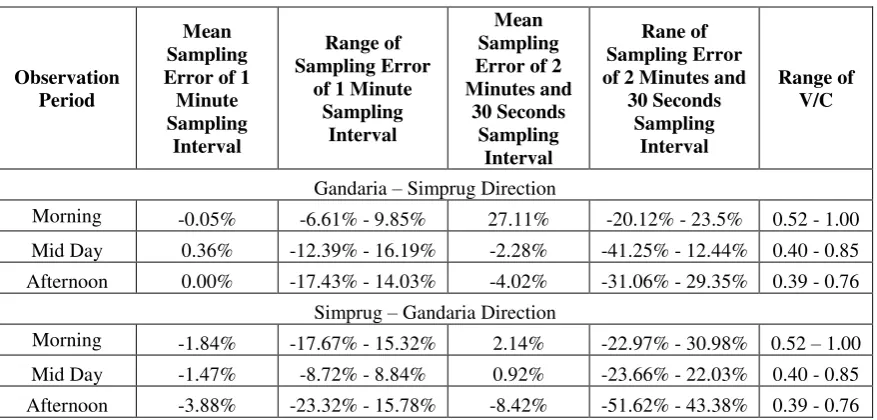
Table 7.
Summary of Sampling Error
CONCLUSIONS
It can be seen that in general sampling error for more frequent sampling interval was in
general less than sampling error for less frequent sampling interval. There was no pattern
of relationship between sampling error and range of V/C or observation period, but it
seems that moderate range of V/C in the mid day in general results in less sampling error.
REFERENCES
Putranto, L.S. 2007.
Rekayasa Lalu-Lintas.
Jakarta: Penerbit Indeks.
Putranto, L.S. 2010.
The Proceeding of the 7
thAsia Pacific Conference on Transportation
and the Environment (APTE).
The Evaluation of Space Mean Speeds of Road Links
Surronding New Developments in Jakarta. Semarang: APTE International Steering
Committee.
Observation Period
Mean Sampling Error of 1
Minute Sampling
Interval
Range of Sampling Error
of 1 Minute Sampling
Interval
Mean Sampling Error of 2 Minutes and
30 Seconds Sampling
Interval
Rane of Sampling Error of 2 Minutes and
30 Seconds Sampling
Interval
Range of V/C
Gandaria – Simprug Direction
Morning -0.05% -6.61% - 9.85% 27.11% -20.12% - 23.5% 0.52 - 1.00 Mid Day 0.36% -12.39% - 16.19% -2.28% -41.25% - 12.44% 0.40 - 0.85 Afternoon 0.00% -17.43% - 14.03% -4.02% -31.06% - 29.35% 0.39 - 0.76
Simprug – Gandaria Direction