Reconciling agricultural economic and environmental objectives: the
case of recreating wetlands in the Fenland area of eastern England
J. Morris
∗, D.J.G. Gowing, J. Mills, J.A.L. Dunderdale
Cranfield University, Silsoe, Bedford, MK 454DT, UKReceived 12 October 1998; received in revised form 15 July 1999; accepted 23 December 1999
Abstract
Although assistance to farming remains the dominant method for supporting the rural sector in the UK, there has been a shift in policy towards agri-environmental schemes which attempt to reconcile competing demands on the countryside as a simultaneous provider of food, rural livelihoods and environmental goods and services.
Many of these issues and challenges facing UK and European agriculture are evident in the intensively farmed Fenland of East Anglia, eastern England, a low-lying area of 5000 sq km which has been reclaimed from swamps over many centuries.
Using the Fenland as a case study, this paper examines the hydrological requirements and likely financial and economic effects of a change in land use associated with the restoration of wet grassland as a means of achieving environmental enhancement in otherwise intensively farmed areas. Significant financial incentives are necessary to encourage farmers to switch to alternative land uses, but these are consistent with payments made under existing agri-environmental schemes in UK. Furthermore, comparative advantage for commercial arable farming on the one hand, and social and institutional factors on the other, act as constraints to the conversion of arable land to livestock and grassland systems. Most wet grassland restoration is likely to occur on less productive land and to be associated with changes in land tenure or proprietor circumstances. © 2000 Published by Elsevier Science B.V. All rights reserved.
Keywords: Wetland; Fenland; Fen; Environment; Economics; Agriculture; Sustainability
1. Introduction
In the UK, and Europe as a whole, the future of agriculture and its role in the rural sector is at a cross-roads. Although European farming systems more than adequately meet the need for indigenous food supply, there is concern about the continued degradation of the natural environment, and of the declining relative
∗Corresponding author. Tel.:+44-1525-863-309;
fax:+44-1525-863-388.
E-mail address: [email protected] (J. Morris)
contribution of large scale, mechanised farming to ru-ral livelihoods and the local economy. More recently, concern regarding the safety of intensively produced foods has further questioned whether modern farming methods serve the public interest.
Whereas assistance to the agricultural industry re-mains the dominant method of supporting the rural sector, there has been a noticeable shift in agricultural and rural policy over the last decade. This recognises the complex interaction between agriculture and the environment and reflects a realisation that less inten-sive farming on some land would not diminish the
ability to feed the population. It also recognises the need to diversify the rural economy through the pro-motion of alternative farm based activities. Simulta-neously, there are signs that consumers are beginning to express preference for food with assured environ-mental and ethical credentials.
With respect to agri-environmental issues, agricul-tural policy now consists of controls and incentives to induce provision of environmental goods, along-side the more conventional support to farm incomes. A ‘twin track’ approach has emerged, whereby agri-environmental policies are designed to deliver environmental goods in conjunction with agricultural output (Department of Environment, 1995). One ap-proach uses the notion of cross-compliance to support a level of protection and enhancement. This requires that if farmers are to benefit from agricultural price support, they must undertake specified environmen-tally positive activities. For example, European Union (EU) farmers who benefit under the Common Agri-cultural Policy (CAP) must set aside a proportion of their land or operate within maximum livestock stocking rates. To qualify for support, farmers must comply with environmental terms and conditions.
The second approach involves making payments to farmers for adopting farming practices that enhance environmental quality, or reverse the trend of intensive agricultural systems. The Environmentally Sensitive Area (ESA), Nitrate Sensitive Area (NSA) and Coun-tryside Stewardship (CS) schemes are existing exam-ples, in which farmers are incentivised or compensated to deliver management agreements and specified standards of enhancement. The proposed reformation of the CAP under Agenda 2000 devotes increased resources to agri-environmental measures. Aid to less favoured areas will also be used as an instru-ment to encourage low-input agriculture (European Union, 1998). The level of direct commodity price support will be reduced and the CAP decentralised to provide the foundations for a rural development policy.
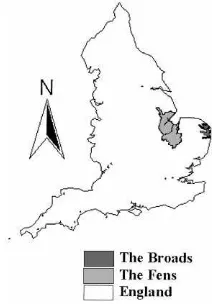
Many of these issues and challenges facing UK and European agriculture are evident in the Fenland of East Anglia, eastern England (Fig. 1), an area of 5000 sq km of unique character in the UK, compara-ble only with The Netherlands in Europe. In its orig-inal form, ‘fen’ consists of a variety of low lying marshes, swamps, bogs and open water. Reclaimed
Fig. 1. Location of Fenland study area.
over many centuries, Fenland now contains some of the most fertile, valuable and intensively farmed land in the UK, characterised by peat soils and served by a sophisticated surface and underground drainage net-work which removes excess water in the winter and provides sub-irrigation in summer.
Fenland is important in terms of its integration of land use, economic activity, wildlife and scenic value, and is internationally recognised for its bio-diversity. Within this managed environment, there are, however, few areas which retain the hydrological and ecological properties of the original fen. Without action to protect and add to these fens, the uniqueness of these natural features could be irreversibly lost.
Concern about the socio-economic and environmen-tal sustainability of Fenland has encouraged various national, regional and local organisations to formulate a strategy for the area which includes the re-creation of traditional wetland features. This ‘Wet Fens for the Future’ initiative aims to bring together the various stakeholders to seek common interests and to explore practical and achievable means of promoting the fen programme.
In this context, the following case study of Fen-land (based on Morris et al., 1996a) is a microcosm of a more general and increasingly common global challenge of how best to reconcile the conflicts of interests between agriculture, environment, rural livelihoods and the general public good. The issues and approaches described in the case are consid-ered therefore to have relevance beyond the specific circumstances of the English Fenland.
2. Aim
The broad aim of this paper is to examine the likely financial and economic effects of a change in land use in the Fenland of eastern England associated with the re-creation of the fens, particularly in the form of wet grassland, as a means of achieving environmental en-hancement in otherwise intensively farmed areas. The purpose is to define the hydrological requirements of fen-type habitats and attempt to reconcile these with farming and other landuse of varying intensity. The paper also seeks to determine the order of financial in-centives which may be necessary to encourage farmers to switch to alternative land use.
3. Methodology
3.1. Hydrology
Agricultural grassland was once an important fea-ture of Fenland providing much of its nafea-ture conserva-tion and landscape interest. The current hydrological infrastructure of the region would permit the restora-tion of such grassland and would allow changes to be made to relatively small hydrological units without major effects elsewhere in the catchment. Much of the area, which would naturally be a freshwater marsh, is
currently pump-drained. Water-levels could be raised simply by altering the current management of pumps. Several large rivers which drain surrounding upland catchments cross Fenland as embanked high-level car-riers (Darby, 1909; Summers, 1976). Water from such water courses could potentially be used to supplement created grassland systems in summer. This paper does not deal with the restoration of swamp communities, which historically may have been the natural vegeta-tion type over much of the area, as the changes to hy-drological infrastructure needed to achieve this would be much more far reaching.
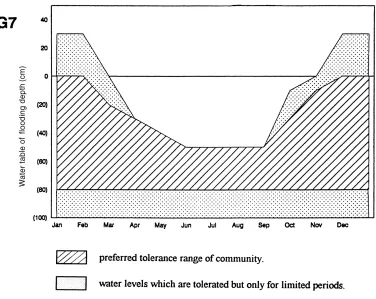
Different land uses, whether for agriculture or nat-ural habitats, require different water regime require-ments. The definition of the hydrological conditions necessary for the creation of grassland communities is the first stage in evaluating a scheme’s feasibility. Figs. 2–4 summarise the water regime requirements of three contrasting grassland communities as defined by the National Vegetation Classification (Rodwell, 1992). The quantified regimes were derived from pub-lished information on these communities (Gowing and Youngs, 1997). These conditions were used to deter-mine the agricultural practices and land use which could be sustained in the event of a reversion from arable to grassland systems in Fenland.
MG7 is a productive grassland dominated by peren-nial ryegrass (Fig. 2). Management is usually through intensive grazing through most of the year with the annual addition of nutrients, in particular, nitrogen. No additional water is necessary, though yields are in-creased if summer drought can be avoided. This com-munity is commonly found throughout the country where cattle are grazed on improved permanent pas-tures and it is readily recreated on agricultural land by sowing the principal component grass, namely peren-nial ryegrass (Lolium perenne L.).
Fig. 2. Water regime requirements for MG7 plant community.
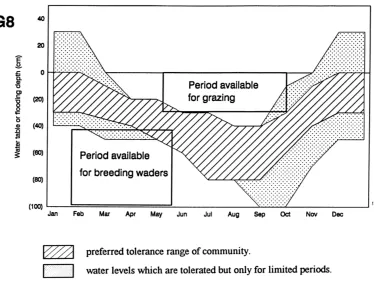
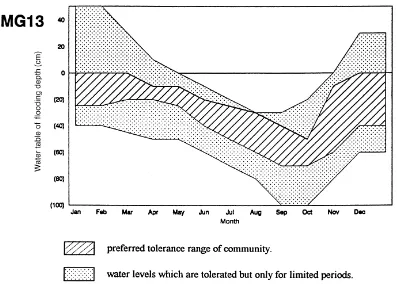
Fenland, but is the target of a habitat creation initia-tive at Wicken Fen, Cambridgeshire (Friday, 1997). Few case studies are available to demonstrate whether the community can be restored to previously arable land, but some success has been achieved with related vegetation types (McDonald, 1993). For illustrative purposes, boxes have been drawn on Fig. 3 to indicate the periods suitable for grazing and breeding waders. MG13 is a species-poor inundation grassland dom-inated by creeping bent grass (Agrostis stolonifera L.) (Fig. 4). It has little botanical value but can provide good conditions for breeding waders and wintering wildfowl. No fine control of water levels is required. This community depends on inundation from flood events during the spring. Management consists of cat-tle grazing whenever soil is firm enough to support them. It can still be found in some parts of Fenland such as the Ouse Washes Reserve, Cambridgeshire and being a less species-rich community than MG8 is
relatively easy to restore on former arable sites if the appropriate hydrology is imposed.
3.2. Economics of alternative farming systems
Fig. 3. Water regime requirements for MG8 plant community.
wet grassland systems were identified, together with the circumstances which might favour farmer partici-pation in a land use conversion programme.
3.3. Policy options and scenarios
Five scenarios which reflect different combinations of policy conditions and farming systems were iden-tified and used to examine the financial and economic impact of land use change in Fenland. These provided a framework for a financial and economic analysis of land use alternatives, ranging from existing arable farming systems to livestock rearing and fattening sys-tems of varying intensity.
3.3.1. Scenario 1 — current situation
Scenario 1 assumes the continuation of existing farming systems under the prevailing agricultural pol-icy framework. The dominant agricultural system of the Fenland represents a distinct type of farming based
on intensive cash cropping. The majority of land is classified as Grade 1 or 2.
Data from the regional farm business survey (Mur-phy, 1996) were used to determine current enterprises, expenditure and income for an ‘average’ size Fen arable farm. Two other typical farm models were iden-tified, which reflect farms of differing size, structure, land capability, enterprise combination and productiv-ity. These three models were identified as Scenario 1a, 1b and 1c (Table 1).
Scenario 1a represents the average Fenland arable farm model which covers 130 ha and follows a typi-cal rotation of winter wheat, oil seed rape, maincrop potatoes, sugar beet, field beans and set-aside.
Fig. 4. Water regime requirements for MG13 plant community.
Scenario 1c is representative of those in the top 10 performing farms in Fenland (size 525 ha). Profits are consistently high with the majority of land classed as Grade 1. Marginal land is usually down to set-aside. Rotations are predominantly based on root crops and field scale vegetables such as carrots and onions with cereals as a break crop.
Table 1
Farm size and cropping patterns by typical fen farmsa
Scenario 1a Scenario 1b Scenario 1c
Average farm Marginal farm Intensive farm
Farm size ha 130 65 525
Crops: % of farm area
Wheat 49 38 39
Other combinable cropsb 16 20 10
Potatoes 8 13
Sugar beet 18 35 22
Vegetables 7
Set aside 9 7 9
aBased on Regional Farm Business Survey sources, Agricultural Economics Unit, Cambridge University. bOil seed rape, peas, beans.
3.3.2. Scenario 2 — free market
these revised price conditions. In practice, however, a change in prices towards world market levels is likely to result in changes in the pattern and structure of farming.
3.3.3. Scenarios for wet grassland
3.3.3.1. Scenario 3. This scenario assumes that per-manent grassland is grazed intensively by sheep and beef from mid/late March to mid/late November and grass conservation takes place (1 cut silage). It is based on the management prescription contained in Tier 1 of the Norfolk Broads ESA agreement (Ministry of Agri-culture Fisheries and Food, MAFF, 1992). This habitat is consistent with the MG7 community. From an agri-cultural perspective, drainage is classed as ‘good’ (the watertable lies more than 0.5 m from the ground sur-face for more than 80% of the grazing season, (Dun-derdale and Morris, 1996)). Nitrogen application is restricted to 125 kg/ha. Farmers receive subsidies for suckler cows, beef and sheep subject to an overall maximum stocking rate of two livestock units per ha. Quota to produce livestock are available from national reserve as part of arable reversion scheme.
3.3.3.2. Scenario 4. This scenario assumes interme-diate grassland management. The habitat is consistent with the MG8 plant community. The management prescription set out under Tier 2 of the Norfolk Broads ESA agreement (MAFF, 1992) applies. Hay instead of silage is cut and grazing is prohibited between November–March inclusive. The maximum nitrogen application rate is 44 kg/ha. The following assump-tions have also been made regarding intensity of land use:
• agricultural drainage status deteriorates to a ‘bad’ condition (watertable depth >0.3 m from ground surface for >50% grazing season and >0.5 m for
<80% of grazing season (Dunderdale and Morris,
1996));
• beef suckler and ewe subsidies are available as
under Scenario 3; and,
• extensification subsidies for suckler cows apply
assuming overall stocking rates are below 1.4 livestock units per ha.
3.3.3.3. Scenario 5. Scenario 5 assumes that grass-land is maintained in a very wet condition for much of
the year. This scenario is similar to that of ESA Tier 3 pertaining to wet grassland with retained high ground water levels. The resultant habitat is consistent with the wet grassland community of MG13. The management prescriptions set out under Tier 1 and 2 apply together with the further restriction that land use is confined to the summer grazing of store cattle and the application of fertiliser is prohibited. Grazing is restricted to the period between late May and the end of October be-cause of ‘very bad’ agricultural drainage (watertable depth<0.3 m from ground surface for >50% of graz-ing season (Dunderdale and Morris, 1996)).
3.4. Financial and economic analysis of agricultural systems
3.4.1. Budgeting and pricing methodology
Analysis of the financial and economic performance of each of these scenarios followed a common format. Two farm perspectives and two pricing perspectives were taken. With respect to the former, a whole farm budget was compiled for each scenario showing the average annual income and expenditure and resultant net return per ha for the farm as a whole (the lat-ter accords with the UK farm management accounting convention of Management and Investment Income (MII)). Variable costs are based on standard regional estimates which reflect local yield performance. Fixed costs are based on regional farm management survey sources (Agro Business Consultants, 1996; Murphy, 1996; Nix, 1996). In the case of arable farms, fixed costs are based on data for Fenland farms, whereas for livestock, fixed cost data are drawn from livestock rearing and fattening farms in various parts of the country.
A partial budget was also compiled for each sce-nario showing the extra income and expenditure and net margin per ha associated with substitution of farming activities at the margin, without changing the predominant farming system. Some changes in labour requirements and operating costs of machinery occur but the majority of fixed costs on the farm remain unchanged.
estimates were used which reflected the continuing de-cline in real prices for farm output (with the exception of beef prices which have recently been depressed by BSE).
Economic prices were used to reflect the value of agricultural inputs and outputs to the national economy once the costs of support have been removed. Adjust-ments to remove Government subsidies followed the methods advised by MAFF (1993) for the appraisal of flood defence projects in cases where reduced stan-dards of drainage result in permanent reductions in farm output. This involves reducing the financial com-modity prices received by farmers (inclusive of sub-sidies) by specified percentages according to crop or livestock type (e.g. 10% in the case of wheat, and 35 and 25% for beef and sheep, respectively) to reflect, somewhat crudely, the cost of subsidies provided by the Government.
Although the latter method is currently used by MAFF, an alternative definition of economic prices is to value farm commodities at their international world market equivalent prices (net of marketing and
Table 2
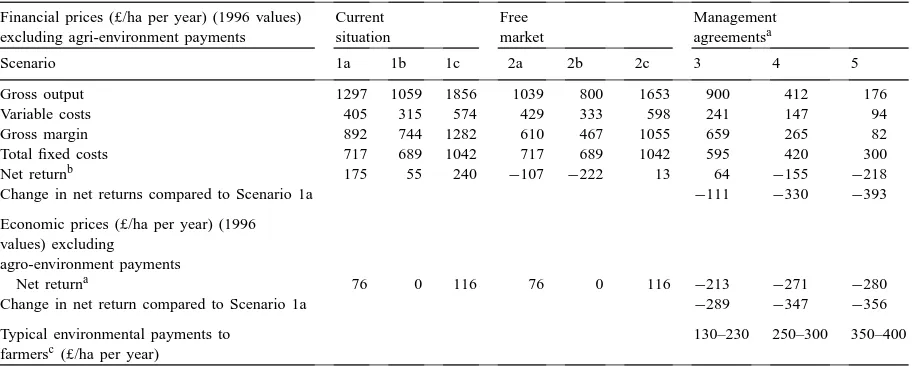
Whole farm budgets for Fenland farming system/policy combinations
Financial prices (£/ha per year) (1996 values) excluding agri-environment payments
Current situation
Free market
Management agreementsa
Scenario 1a 1b 1c 2a 2b 2c 3 4 5
Gross output 1297 1059 1856 1039 800 1653 900 412 176
Variable costs 405 315 574 429 333 598 241 147 94
Gross margin 892 744 1282 610 467 1055 659 265 82
Total fixed costs 717 689 1042 717 689 1042 595 420 300
Net returnb 175 55 240 −107 −222 13 64 −155 −218
Change in net returns compared to Scenario 1a −111 −330 −393
Economic prices (£/ha per year) (1996 values) excluding
agro-environment payments
Net returna 76 0 116 76 0 116 −213 −271 −280
Change in net return compared to Scenario 1a −289 −347 −356
Typical environmental payments to farmersc (£/ha per year)
130–230 250–300 350–400
aAssumes MAFF economic adjustment factors. Use of international border prices would give economic net returns equivalent to free market scenario, subject to cautions expressed in text.
bNet return based on Management & Investment Income.
cBased on ESA Tier 1, 2 and 3 payments for Scenarios 3, 4 and 5, respectively. These payments can be added to the estimated financial net returns and economic net returns to derive net returns inclusive of environmental payments and benefits, respectively. For example, farmers switching from Scenario 1 to 5 would receive payments of about £ 400/ha generating a net return of £ 182/ha, and a change in net return of £ 7/ha compared to Scenario 1a. In economic terms, net revenue would be £ 120/ha inclusive of environmental benefits, and change in net revenue would be £ 44/ha. The latter uses environmental payments to indicate the economic value of environmental benefits.
transport costs associated with importing or export-ing commodities). These economic prices would ap-proximate prevailing under ‘free market’ conditions with unrestricted international trade. In reality, how-ever, the world market for farm produce is a resid-ual market in which prices largely reflect intervention and protectionist policies of national governments. For these reasons, estimates of economic prices require very cautious interpretation. The analysis used 1996 values throughout.
4. Analysis and results
4.1. Whole farm analysis
Table 2 confirms the financial profitability of ex-isting farming regimes in the Fenland under current policy arrangements (£ 175, 55 and 240/ha, respec-tively for Scenarios 1a, 1b and 1c). However, it also confirms that financial performance varies amongst farms according to enterprise combination and levels of intensity. In practice, actual net return varies con-siderably from year to year in response to market and climatic conditions. The estimates here are expected average values for the medium term. The disposable income accruing to the farm family may be larger than indicated because the latter includes a charge for family labour which is a source of income and for rents which are not paid where occupiers are own-ers. The estimates do not, however, include interest charges on borrowings.
In general, most holdings within Fenland report rel-atively high and reliable profits from current agricul-tural practices, despite annual fluctuations in output prices for enterprises such as potatoes. The financial viability of current agriculture is evident. It is those producing on the most marginal soils on a smaller scale and with relatively high rents to pay that face fluctuations around the break-even point.
Table 2 also estimates the value added of existing farming systems under free market conditions (Sce-nario 2). There are substantial reductions in farm in-come relative to the current situation (Scenario 1). Net return is £ −107,−222 and 13/ha for Scenarios 2a, 2b and 2c, respectively. These estimates, however, are unlikely to prevail in practice. In the face of declin-ing prices, farmers are likely to adjust their croppdeclin-ing patterns away from subsidy dependent crops such as oil seeds, and to reduce inputs in an attempt to re-duce costs and thereby protect profits. In the past, farmers did increase output through intensification as a means of maintaining net income as the market was guaranteed. The free market would remove this guar-antee: excess output would hasten a decline in com-modity prices. Current farming systems are dependent on Government support, except for vegetable produc-tion, much of which substitutes for otherwise imported commodities.
The analysis confirms the comparative advantage of this reclaimed area for arable farming. There are concerns, however, about the sustainability of current farming practices, given evidence of deteriorating soil and water resources. These are real resource costs
(evident in increasing costs of soil amelioration and the need for water treatment) which at present go un-recorded. It is likely that in future, farmers will need to comply with environmental requirements and this may, at least in the short to medium term, compro-mise the financial performance of their businesses. Revisited or new technologies such as integrated pest management, minimum tillage, or precision appli-cation systems can help to deliver more sustainable farming. The growing popularity of organic produce and farming methods provides an opportunity for reconciling farming and environmental interests, but of course they require similar drainage conditions to that of conventional agriculture.
Table 2 also shows the financial performance at whole farm level of Scenarios 3, 4 and 5, all of which involve the rearing and fattening of livestock on grass-land. These scenarios differ in terms of degree of wet-ness and drainage conditions, which in turn affect the productivity, carrying capacity and hence profitability of the farming systems. Although increased wetness reduces farm profits, it potentially increases environ-mental benefits.
Scenario 3 represents a moderately intensive livestock system on reasonably well drained land in-volving suckler beef, grass finished store cattle and lowland fat lamb production. The system is based on the practices associated with Tier 1 of ESA man-agement agreements. In this respect, the Scenario in-volves ‘cross-compliance’. Overall stocking rates are about two livestock units per ha and these qualify for subsidies per head at the appropriate rate. Scenario 3 appears financially viable with a net return of £ 64/ha. Scenario 4 represents a low input grassland system producing sucker calves and lambs. The system is in-dicative of Tier 2 arrangements. Overall stocking is about one livestock unit per ha and farms qualify for additional ‘extensification’ subsidies per head of stock. For the assumptions made, revenues are insufficient to recover costs and financial net return is £−155/ha.
Scenario 5 is an extensive wet grassland system. Beef cows and store cattle are summer grazed. It is too wet for sheep. Stocking rates are less than one live-stock unit per ha. Revenues are insufficient to recover costs and the financial net return is £−218/ha.
incentives which compensate for loss of income. The exception is the possible switch from arable to moder-ately intensive grass on small, marginal farms on poor soils. Where whole farm change does occur it is likely that other factors will be important, such as ownership change or impending farmer retirement. The whole farm switch to grassland is also constrained by access to production quota for livestock (without which farm-ers cannot obtain subsidies) as well as a relative lack of livestock skills and supporting infrastructure in the region. Farmers can acquire quota for livestock subsi-dies from the Government under special arrangements for arable reversion schemes. Otherwise, farmers will incur additional costs to purchase or lease such quota. Table 2 also shows that the use of economic prices results in economic net returns for Scenarios 1a, 1b and 1c of £ 76, 0 and 116/ha, respectively, signifi-cantly lower than estimates based on financial prices. The economic value to the nation of Scenario 2 is as-sumed to be the same as for Scenario 1 because the same farming system applies (but the returns to farm-ers of operating the current system under free market conditions are not the same).
The economic returns from Scenarios 3, 4 and 5 are also shown in Table 2. MAFF guidelines on the reductions of beef and sheep gross output to reflect headage payments have been applied (MAFF, 1993). Economic value added is £−213,−271 and−280/ha, respectively. There appear to be significant net eco-nomic costs associated with livestock production.
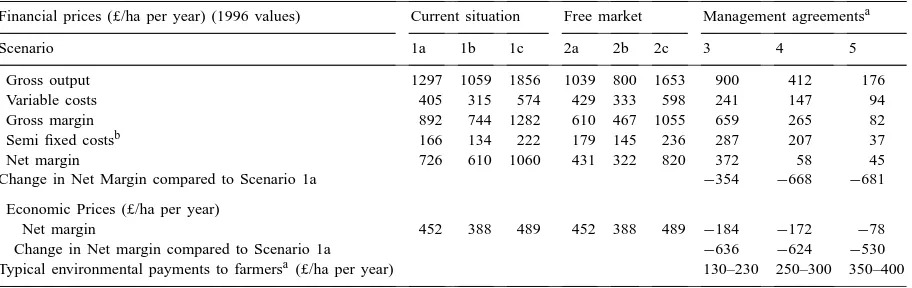
Table 3
Partial farm budgets for Fenland farming system/policy combinations
Financial prices (£/ha per year) (1996 values) Current situation Free market Management agreementsa
Scenario 1a 1b 1c 2a 2b 2c 3 4 5
Gross output 1297 1059 1856 1039 800 1653 900 412 176
Variable costs 405 315 574 429 333 598 241 147 94
Gross margin 892 744 1282 610 467 1055 659 265 82
Semi fixed costsb 166 134 222 179 145 236 287 207 37
Net margin 726 610 1060 431 322 820 372 58 45
Change in Net Margin compared to Scenario 1a −354 −668 −681
Economic Prices (£/ha per year)
Net margin 452 388 489 452 388 489 −184 −172 −78
Change in Net margin compared to Scenario 1a −636 −624 −530
Typical environmental payments to farmersa(£/ha per year) 130–230 250–300 350–400
aSee notes to Table 2.
bSemi fixed costs include direct labour and machinery operating costs but exclude capital expenses, rents and other overhead charges.
These reflect the high levels of support to the livestock sector.
Economic analysis indicates that in terms of agri-cultural production, the costs to the national economy associated with a switch from arable to livestock sys-tems are as great as, if not greater than, those to farm-ers. This is because of the relatively high levels of Government support given to livestock farmers in the form of subsidies per animal. These economic losses may be offset by savings in other directions, especially savings in the costs to Government of flood defence and land drainage. The economic losses arising from a switch from arable to livestock are of course com-pensated by the economic value of the environmental benefits associated with wet grassland.
4.2. Partial farm analysis
Table 3 shows the effect on farm income of a unit hectare increase or decrease in size of a particular farming activity (defined in terms of net margin per ha), assuming that the dominant features and there-fore the fixed cost structure of the farm remain largely unchanged. This perspective is relevant where small areas on a farm might switch from one land use to another.
£ 610 to 1060/ha depending on circumstances. These values are evident in practice when farmers pay high prices for extra land which they can farm without in-creasing their labour force or inventory of buildings and machinery. Net margins remain high under the free market (Scenario 2). The net margins for the live-stock scenarios are positive, but relatively small for the extensive systems (Scenarios 4 and 5).
The application of MAFF guidelines (MAFF, 1993) to derive economic estimates of net margins results in lower net margin values compared with the financial analysis. Table 3 shows that economic net margins per ha are positive for all arable scenarios. (Economic val-ues for Scenario 2 are assumed the same as for Sce-nario 1). SceSce-narios 3, 4 and 5 all demonstrate negative net margins, suggesting that, once the value of subsi-dies are taken out, the extra returns from livestock do not recover the extra costs. Indeed the less intensive is the livestock system, the less is the economic loss. The income losses of switching small areas of the farm from arable to grass are high, unless there are concomitant savings in fixed costs for the whole farm. For the typical Fenland farm, land is often perceived as the major constraint, especially as farmers pursue economies of scale in the operation of mechanised farming systems. Giving up land in any quantity is not popular, unless it is problematic because of limited access or low productivity, or can serve interests such as game cover.
There may be opportunities to encourage wet grass-land on some of the relatively unproductive areas of the larger farms. Some of these areas are already down to permanent fallow under the Government’s non-rotational Set-aside Scheme. Such areas could be targeted for conversion to wet grassland without interfering with the arterial drainage system which serves adjacent conventionally farmed areas.
4.3. Incentive payments
Numerous conservation policies, grants and pay-ments are available to support the conversion of inten-sive arable and grassland areas to less inteninten-sive land use which simultaneously delivers environmental en-hancement. The payments indicate the levels of incen-tive or compensation perceived necessary to encourage farmers to adopt environmentally beneficial land use and farming practice. They also indicate a willingness
to pay on the part of society for the delivery of envi-ronmental enhancements. Indeed, MAFF (1993) flood defence project appraisal guidance recommends that agri-environmental payments to farmers can be used to estimate the economic value of the environmental benefits obtained.
The ESA policy, introduced in 1987, is designed to help the conservation of areas of high landscape or wildlife value which are vulnerable to changes in farming practice (MAFF, 1989). It offers payments to farmers to maintain or to introduce environmentally beneficial and/or traditional farming methods.
Payments vary between ESA schemes in the differ-ent geographical areas of the country and according to the specified management prescription (or ‘Tier’) within a given scheme. Tier 1 payments typically re-quire a commitment to permanent grassland, in return for payments of about £ 130/ha per year, although payments can be £ 250/ha per year for arable conver-sion to grassland. Payments for wet grassland on Tier 2 range between £ 250 and 300/ha per year, and for Tier 3 with high water levels, up to £ 400/ha per year. Table 2 shows that Tier payments to farmers are of similar magnitude to the losses in net return incurred in the switch from Scenario 1a to Scenario 3, 4 or 5 and therefore may go some way towards providing in-centive payments or compensation. The payments are also indicative of the extra environmental benefits to society of less intensive farming. For example, society is willing to pay £ 400/ha to farmers under Tier 3, and this appears to more than compensate for the loss of economic value of farm production (£−356/ha) asso-ciated with a switch to extensive livestock.
Another scheme, the Wildlife Enhancement Initia-tive, administered by English Nature, offers annual payments for positive management on Sites of Special Scientific Interest and land adjacent to them. In return for payments, farmers are required to follow guide-lines on ditch water levels, stocking rates and land management. Such land use prescriptions will be an important element of wet grassland management.
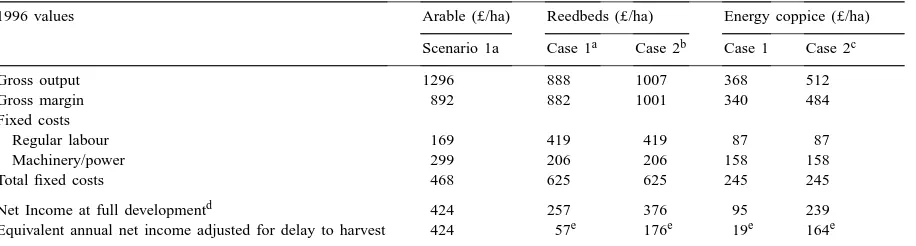
Table 4
Comparison of budgets for arable, reedbeds and energy coppice enterprises
1996 values Arable (£/ha) Reedbeds (£/ha) Energy coppice (£/ha)
Scenario 1a Case 1a Case 2b Case 1 Case 2c
Gross output 1296 888 1007 368 512
Gross margin 892 882 1001 340 484
Fixed costs
Regular labour 169 419 419 87 87
Machinery/power 299 206 206 158 158
Total fixed costs 468 625 625 245 245
Net Income at full developmentd 424 257 376 95 239
Equivalent annual net income adjusted for delay to harvest 424 57e 176e 19e 164e
aCase 1 represents current situation with no grant or subsidies.
bCase 2 for reedbeds includes ESA grant for 50% of establishment costs.
cCase 2 for energy coppice includes area payment and Woodland Grant payment for establishment. dNet income before land charges (rent/rates) and general expenses.
ePresent value sum of capital allowances and net income divided by years to full development.
Farm woodland is a further option for Fenland farm-ers, with grant schemes for the capital costs of estab-lishment £ 1050/ha (at 1996 values) for broad-leaved woodland, and annual payments for the early years of the plantation.
Incentive payments such as these may encourage land use change in areas of marginal agricultural pro-ductivity within a farm, or where this can serve to ease the pressure of intensive agriculture on natural re-sources and the environment. Whole farm conversion to wet grassland or alternative use is unlikely unless the particular proprietor circumstances favour change.
4.4. Alternative wetland activities
There is potential for alternative farm-based en-terprise development in the restored wetland envi-ronment, namely; wood products energy coppice, countryside sports, nature conservation and tourism.
Table 4 compares the farm budgets for reedbeds and energy coppice with the typical arable system in the Fens and shows that these enterprises are unlikely in themselves, without substantial and targeted incen-tives, to be sufficiently attractive to encourage a switch out of arable farming on any significant scale. Further-more, local and regional market constraints may limit the scale to which any one activity can offer a realistic option to agriculture.
Game and wildfowl shooting and recreational fish-ing, in particular for trout, are popular activities in the Fenland which offer potential for generating ad-ditional income. The development of visitor-oriented nature conservation sites can help to raise the profile of the region, as well as stimulating the local economy (Humphreys, 1994). Wetland restoration can exploit the considerable potential for ecological and heritage tourism in the Fenland generating local income and employment benefits, including those associated with on farm retail outlets and holiday cottages.
5. Conclusions
The analysis of the Fenland case provides manage-ment guidelines that may have applicability to other similar sites. An important conclusion is that restora-tion of the original swampy fen and its biological communities requires changes in hydrological infras-tructure and processes incompatible with continued commercial farming. In this respect, the creation of grassland systems of varying degrees of wetness of-fers an intermediate solution which can reconcile agricultural and environmental interests.
type of farming and the type of wet grassland which can be supported. For this reason, blanket prescriptions may not work particularly well. It may be more appro-priate to specify management agreements which target the environmental objectives to be achieved and which incorporate a level of incentive/compensation which reflects income loss and expenses incurred. There is presently a plethora of different schemes and regula-tions operating at national and regional level. There is a need to reconcile and co-ordinate these to suit par-ticular local purposes.
Acknowledgements
This research was funded by Countryside Com-mission, English Nature, Cambridgeshire and Lin-colnshire County Councils, Environment Agency, Royal Society for the Protection of Birds. The authors thank the anonymous reviewers for improvements to the original draft.
References
Agro Business Consultants, 1996. The Agricultural Budgeting and Costing Book. Agro Business Consultants Ltd., Leicestershire, 336 pp.
Department of Environment, 1995. Rural England. HMSO, London, 146 pp.
Darby, H.C., 1909. The changing Fenland: Cambridge University Press, 267 pp.
Dunderdale, J.A.L., Morris, J., 1996. River Maintenance Evaluation. R&D Note 456. Report to the NRA, Cranfield University, School of Agriculture, Food and Environment, Silsoe, Bedford, UK, 127 pp.
European Union, 1998. Agenda 2000 — The Future for European Agriculture. European Union, Agriculture and Rural Development, Brussels, Belgium, 16 pp.
Friday, L.E., 1997. Wicken Fen: The Making of a Wetland Nature Reserve. Harley Books, London.
Gowing, D.J.G., Youngs, E.G., 1997. The effect of the hydrology of a Thames flood meadow on its vegetation. In: Large, A.R.G. (Ed.), Floodplain Rivers: Hydrological Processes and Ecological Significance. British Hydrological Society Occasional Paper No. 8, pp. 69–80.
Humphreys, T., 1994. Fen Tourism Group Customer Survey 1994: Summary Results and Report. Fen Tourism Group, 13 pp. McDonald, A.W., 1993. The role of seedbank and sown seeds in
the restoration of an English flood-meadow. J. Veg. Sci. 4 (3), 395–400.
Ministry of Agriculture Fisheries and Food, 1989. Environmentally Sensitive Areas. HMSO, London, 50 pp.
Ministry of Agriculture Fisheries and Food, 1992. The Broads — Guidelines for Farmers: Environmentally Sensitive Areas. HMSO, London.
Ministry of Agriculture Fisheries and Food, 1993. Flood and Coastal Defence Project Appraisal Guidance Notes. HMSO, London, 63 pp.
Morris, J., Mills, J., Burton, R.G.O., Hall, J.R., Dunderdale, J.A.L., Gowing, D.J.G., Gilbert, J.C., Spoor, G., 1996a. Wet Fens for the Future. Feasibility Study Phase 2 — A Study of the Socio-Economic and Soil Management Implications of Creating New Wetlands in Fenland. Cranfield University, School of Agriculture, Food and Environment, Silsoe, Bedford, UK, 166 pp.
Morris, J., Weatherhead, E.K., Knox, J.W., Gowing, D.J.G., Dunderdale, J.A.L., Green, C., Tunstall, S., 1996b. The Practical Implications of Introducing Tradeable Permits for Water Abstraction. Report to the Royal Society for the Protection of Birds, by Cranfield University, School of Agriculture, Food and Environment and Middlesex University, Flood Hazard Research Centre. Cranfield University, Silsoe, Bedford, UK, 69 pp. Murphy, M.C., 1996. Report on Farming in the Eastern Counties
of England 1994/1995. Agricultural Economics Unit, University of Cambridge, 234 pp.
Nix, J., 1996. Farm Management Pocket Book, 27th Edition (1997). Wye College, University of London, Kent, 220 pp.
Rodwell, J.S., 1992. British Plant Communities Vol. 3 — Grassland & Montaine Communities. Cambridge University Press, Cambridge, 540 pp.
Royal Commission on Environmental Pollution, 1996. Sustainable Use of Soil. 19th Report, HMSO, London, 260 pp.