Optimum Distributed Generation Allocation Using PSO in order
to Reduce Losses and Voltage Improvement
I.J.Hasan
1, M.R.Ab. Ghani
2, C.K.Gan
31,2,3Faculty of Electrical Engineering, Universiti Teknikal Malaysia Melaka, Melaka, Malaysia 1
Email: [email protected], 2Email: [email protected] ,3Email: [email protected]
Keywords: DG, Distribution Network Planning, PSO.
Abstract
The technology advancement in Distributed Generations (DG) has significantly influenced the environmental pollution. In power system, more especially in distribution networks, DGs can able to mitigate the total losses of the network which effectively has significant effects on environmental pollution. Optimal location and size of DG in distribution networks is one of the important issues of the power system. This paper aims to investigate the best solution for optimal operation of distribution networks by taking into consideration of DG. The optimal allocation of DG can be considered as an integer problem that can be formulated by metaheuristic methods. In this paper, the Particle Swarm Optimization (PSO) algorithm has been used to solve the DG placement and sizing. The IEEE 34 bus test system has been utilized to demonstrate the effectiveness of the PSO algorithm on herein mentioned problem. The result illustrates the losses minimization and voltage profile improvement.
1 Introduction
The management of power system has been facing with the major changes during the past decades. The willing to create a competitive environment has caused to develop various sectors such as generation, transmission and distribution. These developments and the other issues such as the environmental pollution, construction problems of the new transmission lines, and technology development to the construction of small generation units has caused the increase in the utilization of Distributed Generation (DG).
Researches of Electric Power Research Institute (EPRI) has figured out that more than 25 present capacities of DGs installed until 2010. DGs are able to connect to distribution network in most of the cases without transmission lines. Accordingly, the impacts of DGs on losses and voltages of networks should be investigated comprehensively on distribution networks operation and planning [1, 2].
The optimal operation of distribution networks applies to optimum use of resources and equipment’s control such as the ability of transformers tap ganging based on loads, AVRs and capacitors. The optimization of DG allocation has applied to minimize of the objective function with considering the technical problem constraint. In the past, distribution networks were not able to connect the DG resources into the main utility grid. While present networks are able to simply
connect DGs into the utility grid. More utilization of DG into the network may cause serious impacts on conventional distribution networks. The problem formulation of optimal utilization of DG aims to reduce grid losses based on active power resources control pattern[3, 4].
In recent years, researchers have been developed the optimum allocation of the DG in distribution networks. Several methodologies based on analytical tools and optimization programming methods have been executed [5–8]. In [7] the optimal sizing of DG by Improved Analytical (IA) method and Harmony search algorithm used but the optimum placement of DG has not considered. The optimization based algorithms have also been utilized by many researchers[6, 8]. In [6] the optimum allocation of wind-based DG unit presented by using particle swarm optimization technique. The results compared with analytical approach and verified. In [8] the dynamic programming application performed for DG allocation in terms of loss reduction and reliability improvement.
Consequently, according to literature reviewed of the DG allocating problem in networks planning, the objective functions of distribution network planning need to be modified for future networks. It can provide the appropriate patterns to control their impacts and effects on distribution networks. This paper presents the impacts of connected DG into distribution networks and investigates the optimum locations and sizes of DGs using PSO algorithm. The section II discusses the PSO algorithm that is used for minimization of total cost of the network.
Successful authors will be asked to submit a final camera ready paper for publication. Authors are asked to prepare and submit electronic versions of their full papers according to these instructions.
2 Particle Swarm Optimization
The swarm intelligent algorithm is one of the evolutionary computation methods that produced by Eberhart and Kennedy to solve the optimization problems [9]. The algorithm is based on particles movement towards the optimal point. The algorithm should be initialized by number of population and each particle is moved based on the Best Personal Position (Pbest) and Best Global Position (Gbest) which are obtained from neighbours particle’s information. According to Fig 1 the basis of PSO can be explained as following:
based on Euclidean distance in a various categories. The instance, in Fig 1 is consisting of three factors tracer. The function of each particle in the search space is calculated and in each category is determined the value of particle depending on the target function is minimized or maximized. Thus, the best member of each category is determined. On the other hand, with regard to previous information of each particle the best point can be identified that it’s already discovered. Therefore the optimal point of each category and each particle is determined. The first recognition is in each category corresponding to the global optimum and the second recognition is corresponding to the personal or local optimum point.
Best Personal Position Previous
Position
Current Position
Best Global Position Next Position
Fig 1: Principle of PSO particle movement [10]
According to Fig 1 and with this information, the particle can move in the direction of the following vector equation [11]:
) (
) (
) * (
1 t
i Gbest t
i Pbest t
i t
i w V X X X X
V + = +
α
− +β
− (1)1
+ +
+
= t
i t i i t
i X V
X (2)
where, t i
X
Current position of Particle
≤ ≥ =
+ +
j j
t i
j j
j Pbest Pbest
OF OF
if X
OF OF
if X
X
1 1 )
(
(3)
≤ ≥
= + +
+
j j
j Pbest
j j
j Gbest Gbest
OF OF
if X
OF OF
if X
X
1 )
1 (
1 )
(
(4)
Pbest
X Best personal position of Particle
Gbest
X Best global position of Particle
t i
V Velocity of particle i for previous vector 1
+
t i
V Velocity of particle i towards next position
w
Inertia weight factorβ
α& Acceleration coefficient
OF Objective Function
Therefore, PSO algorithm is able to achieve the best optimal global point with sequence iteration.
2.1 Methodology
The minimization of objective function is the main aim of distribution network planning. The objective function variables have a non-linearity correlation. Therefore, the optimal operation has non-linear and discrete optimization problem. PSO is a metaheuristic method as explained formerly is based on creating an initial random solution. Fig 2 illustrates the flowchart of PSO algorithm. The algorithm has been explained as follows subsections:
1) Initialization
The initial placement and sizing of DG units configuration has been given in first step of algorithm. The function model generation and setting the random population, iteration number, initial particles weight and velocity into the search space has been inputted as well.
2) objective function calculation
The objective function parameters has been calculated based on the initial input parameters and summation of each particle.
3) Determine Pbest
The parameters of objective function related to the position of each particle is compared with the corresponding value in previous position with lower objective function is listed as Pbest for the current iteration as equation (3) [12].
4) Determined Gbest
The best result of the Pbests for all the particles will be appointed as the Gbest as dedicated in equation (4) [12].
Fig 2: PSO algorithm
5) Velocity and position updating
1 1r
c
=
α (5)
2 2r
c
=
β (6) where,
1
c Personal learning coefficient
2
c Global Learning coefficient )
1 , 0 ( ~ & 2
1 r U
r Uniformly distributed random numbers
6) Check stop condition
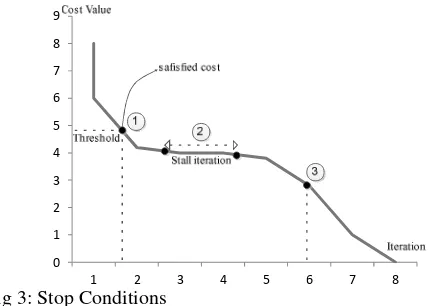
Depends on objective function there are different modes of finalization of the algorithm. The stop condition is shown in Fig 3.
0 1 2 3 4 5 6 7 8 9
1 2 3 4 5 6 7 8
Fig 3: Stop Conditions
The following describes a few methods for stopping the loop iteration:
a) The algorithm can be finalized after achieving to satisfy cost and desired value of the objective function.
b) After achieving the stall iteration. That means after the specified time has elapsed or number of iterations without any improvement in outcome. c) After the specified time has elapsed or number of
state iterations.
The algorithm might be stopped by calling one the above conditions and the results can be printed in the output files.
3 The impacts of DGs on voltage drop and
transformer tap position
Due to the small ratio of X to R in distribution networks and the radial structure of these grids, the impact of DGs on distribution network voltage is significant. By considering this issue, the voltage drop for the network cab be written as follows [13]:
I
jX
R
V
V
V
=
1−
2=
(
+
)
∆
(7)∗ − =
2
V jQ P
I (8)
2 2
2
2 2
2 2
2 ( ) ( ) ( )
V XQ RP V
XQ RP XQ
RP
V = + + − ≈ +
∆ (9)
where,∆V is the line voltage drop,R+ jXis the line impedance,Q is the reactive power,
P
is the active power,2 1,V
V and I are the Bus 1 and 2 voltage amplitude and the
current flow through the line, respectively.
The above equations should consider as one of the constraint of the optimization problem. This constraint can be considered as penalty factor into the objective function. The transformer tap positions can be influenced by voltage improvement in distribution networks which is important for voltage regulation. Once the voltage at secondary terminal of transformer has improved as possible close to one per unit, the tap position steps can be situated in initial position. This act can gives more opportunity to voltage regulation by tap changer and will be increased the lifecycle of transformers that would be cost effective [14]. It means that, the voltage improvement by allocating DG units into the distribution network will be caused more flexibility of transformer tap changer to regulate the voltage.
4 Objective function and problem formulation
Your full paper should be submitted online via the conference website. It should be expected that after your submission, your final paper will be published directly from the PDF you send without any further proof-reading. Therefore, it is advisable for the authors to print a hard copy of their final version and read it carefully. The objective function and constraints are formulated in this section. DG placement and sizing have influenced on the total network losses in distribution networks. Therefore, the power losses reduction and voltage improvement will be obtained from the following objective functions (A & B) in the radial distribution network. The power losses and voltage improvement formulations have obtained from references [15, 16].
4.1 Power losses formulation
The total power losses equation can be introduced as follows [15, 16]:
)) cos(
* *
* ( (
2
i i i i i
i i i n
i power real
y s r Ysr Vr
Vs APD APO L
θ δ
δ − +
− −
=
∑
=
(10) where,
power real
L Real Power Losses
i
APO Active power from output bus i
i
APD Active power on demand bus i
i
Vs Voltage from sending bus i i
Vr Voltage on receiving bus i i
Ysr Admittance of sending and receiving bus i
i
s
δ
Phase angle of sending bus i ir
δ Phase angle of receiving bus i i
y
θ Phase angle of
Y
i<
θ
i4.2 Improve the voltage profile
∑
= − =
n
i
rate i
P Vr V
V
1
2
)
( (11)
where,
P
V Voltage profile objective function [p.u.] rate
V Rated voltage [p.u.]
Those equations (10) and (11), represents the main objective function which can be written as follows in equation (12).
]
)
[(
L
V
DP
Min
Z
=
real power+
γ
∗
P+
(12)where,
γ
is the violation coefficient andDP
is the Penalty factor (derived from problem constraint) Z Evaluation function (minimized with PSO).4.3 The problem constraints
The following shows the problem constraints of distribution network planning:
Bus voltage min max i t i
i
V
V
V
≤
≤
Current feeders rated fi fi
I
I
≤
Reactive power of capacitors min max ci t gi
ci Q Q
Q ≤ ≤
Maximum power line transaction line ij t line
ij
P
P
≤
max5 Case Study
The test case that used in this paper is the IEEE_34 node which is shown in Fig 4. This case has been used to demonstrate the functionality of the proposed algorithm in order to find the optimum placement and sizing of the DG into the predefined test case. There are a few initial assumptions of the DG sizes and constraints whish are specified as follows:
•The number of iteration, population, C1&C2 andwdamping are considered 1000, 30, 2, 0.99 respectively.
•Maximum number of DG units: 34 units (all nodes) •Minimum power generation for each DG unit: 100kW •Maximum power generation for each DG unit: 1MW •Voltage constraint (0.95 ≤ Vnode ≤1.05)
•DG units are considered as constant output generation with unit power factor.
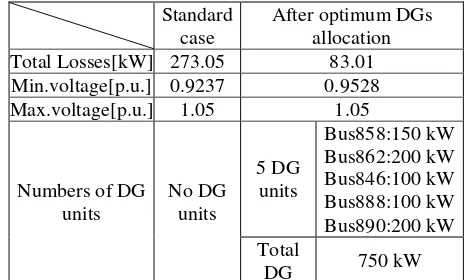
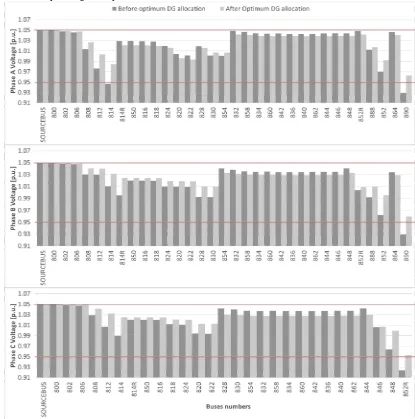
Table 1 shows the comparison between the IEEE 34 standard and optimum DGs allocation cases. As obtained from the result, after allocating the optimum DG to the standard test case, the losses of the network have been reduced, significantly. The total loss of the network is reduced from 273.05kW to 83.01kW. It should be noted, the losses reduction is obviously causes the total cost decreases. In Fig 5 indicates the voltage profile improvement after DG installation which is within the standard voltage range. The optimization cost reduction based on iteration number is shown in Fig 6. It illustrates the proposed algorithm is gradually convergence to the minimum possible losses which
has been defined in optimum DG case in Table 1. In addition, Table 1 indicates the minimum and maximum voltages of the network for both cases. The distance voltage drop profile
Error! Reference source not found. is shown in Fig 7. It shows the voltage profile has been improved by allocating the optimum DG compares to standard case.
800
806 808 812 814
810
802 850
818 824 826 816
820 822
828 830 854 856 852 832
888 890 838 862
840 836 860 834
842 844 846 848
864
858
Fig 4: IEEE 34 buses diagram
Table 1: Comparison between standard and optimum case illustrates the transformer tap changer position which is extremely important in terms of voltage regulation controller of the transformers. The transformer tap positions number has been decreased in optimized DG allocated case compare to standard case. It means that, transformers have more flexibility in order to voltage regulation if position of tap changer is close to zero. The results of tap position shows the positive impact of DG on transformer tap position which may cause to increase the transformer lifecycle. For instance, in ‘reg1a’ the initial tap position was situated at 14, but after DG implementation it changed to 6. The maximum tap position is 16 steps, which means before DG allocation transformer was able to improve the voltage just two more tap steps while after DG it has been 10 tap steps.
Standard case
After optimum DGs allocation Total Losses[kW] 273.05 83.01 Min.voltage[p.u.] 0.9237 0.9528
Max.voltage[p.u.] 1.05 1.05
Numbers of DG units
No DG units
5 DG units
Bus858:150 kW Bus862:200 kW Bus846:100 kW Bus888:100 kW Bus890:200 kW Total
DG 750 kW
Table 1: Comparison between standard and optimum case
Standard case After optimum DGs allocation Tap[p.u] Position Tap[p.u] Position reg1a
reg1b reg1c reg2a reg2b reg2c
1.08750 1.02500 1.03125 1.08125 1.08125 1.08125
14 4 5 13 13 13
1.03750 1.00000 1.00000 1.05000 1.03750 1.03125
Table 2: Transformer taps changer comparison
Fig 5: The voltage comparison before and after DG allocation
0 100 200 300 400 500 600 700 800 900 1000 0
500 1000 1500 2000 2500 3000
Iteration
L
o
ss
es
Fig 6: The losses minimization
0 50 100 150 200
0.92 0.94 0.96 0.98 1 1.02 1.04 1.06
Distance [km]
V
o
lt
ag
e
[
p
.u
.]
Phase(a) Phase(b) Phase(c)
After DG:
Fig 7: The voltage dorp in distance for both before and after DG allocation
Conclusion
The more connection of DG needs more studies about their impacts on distribution networks. One of the studies that tried to discuss in this paper is optimal placement and sizing of DGs. The Particle Swarm Optimization (PSO) has used to solve the objective functions of optimum DG placement and size in distribution network. The results carried out the total losses can be minimized significantly by allocating the optimum size of DG in the optimum placement. In addition the minimum voltage profile of network is reinforced to the specified standard range and generally voltage profile has improved. It can be summarized, using DG units in distribution networks is the proper solution in planning to reinforce the network operation, if the size and placement of units allocated adequately.
Acknowledgements
The authors would like to gratefully acknowledge the funding support provided by the Ministry of Higher Education Malaysia under the research grant no. MTUN/2012/UTEM-FKE/7 M00015.
References
[1] P. Chiradeja, “Benefit of Distributed Generation: A Line Loss Reduction Analysis,” 2005 IEEE/PES Transmission and Distribution Conference and Exhibition: Asia and Pacific, pp. 1–5, 2005.
[2] Z. Wang and Q. Xu, “On distribution system planning method for reliability and its application,” 24th International Conference on Electric Utility Deregulation and Restructuring and Power Technologies (DRPT)., pp. 1727–1731, Jul. 2011.
[3] A. A. Ghadimi and H. Rastegar, “Optimal Control and Management of Distributed Generation Units in an Islanded MicroGrid,” Integration of Wide-Scale Renewable Resources Into the Power Delivery System, 2009 CIGRE/IEEE PES Joint Symposium, 2009, pp. 1-7. [4] B. Wille-Haussmann, C. Wittwer, and S. Tenbohlen,
"Reduced models for operation management of distributed generation" 20th International Conference and Exhibition on Electricity Distribution - Part 1, CIRED 2009, pp. 1-4.
[5] C. Wang and M. H. Nehrir, “Analytical approaches for optimal placement of distributed generation sources in power systems,” Power Systems, IEEE Transactions on, vol. 19, no. 4. pp. 2068–2076, 2004.
[6] S. Kansal, B. B. R. Sai, B. Tyagi, and V. Kumar, “Optimal placement of wind-based generation in distribution networks,” Renewable Power Generation (RPG 2011), IET Conference on. pp. 1–6, 2011.
[7] K. S. Rao and M. N. Rao, “Multiple distributed generator allocation by Harmony search algorithm for loss reduction,” Emerging Trends in Electrical Engineering and Energy Management (ICETEEEM), 2012 International Conference on. pp. 59–64, 2012.
[8] N. Khalesi and M.-R. Haghifam, “Application of dynamic programming for distributed generation allocation,” Electrical Power & Energy Conference (EPEC), 2009 IEEE. pp. 1–6, 2009.
[9] J. Kennedy and R. C. Eberhart, “A discrete binary version of the particle swarm algorithm” IEEE International Conference on Computational Cybernetics and Simulation, vol.5, pp. 4104-4108 1997.
[10] J. I. Hassan, C. k. Gan, M. Shamshiri, B. B. Isamdi, and G. A. M. Ruddin, “Losses Reduction and Voltage Improvement Using Optimum Capacitor Allocation by PSO in Power Distribution Networks”, Intrnational Reveiw on Modeling and Simulation (IREMOS), vol. 6, no.4 , pp. 1219–1226, August 2013.
[11] Y. Valle, S. Member, G. K. Venayagamoorthy, S. Member, and R. G. Harley, “Particle Swarm Optimization : Basic Concepts , Variants and Applications in Power Systems,” vol. 12, no. 2, pp. 171– 195, 2008.
[12] I. Ziari, G. Ledwich, M. Wishart, a. Ghosh, and M. Dewadasa, “Optimal allocation of a cross-connection and sectionalizers in distribution systems,” TENCON 2009 - 2009 IEEE Reg. 10 Conf., pp. 1–5, Nov. 2009.
[13] M. H. Moradi and M. Abedinie, “A combination of Genetic Algorithm and Particle Swarm Optimization for optimal DG location and sizing in distribution systems,” 2010 Conf. Proc. IPEC, pp. 858–862, Oct. 2010.
[14] S. W. Clark, “Improvement of step-voltage regulating transformer efficiency through tap changer control modification,” T&D Conference and Exposition, 2014
IEEE PES. pp. 1–5, 2014.
[15]S. Najafi, S. H. Hosseinian, M. Abedi, a. Vahidnia, and S. Abachezadeh, “A Framework for Optimal Planning in Large Distribution Networks,” IEEE Trans. Power Syst., vol. 24, no. 2, pp. 1019–1028, May 2009.
![Fig 1: Principle of PSO particle movement [10]](https://thumb-ap.123doks.com/thumbv2/123dok/509317.57719/2.595.75.255.250.415/fig-principle-pso-particle-movement.webp)